

Yes, we're now running our only Summer Sale. All Courses are 30% off until 20th July, 2026:
Learn through the super-clean Baeldung Pro experience:
>> Membership and Baeldung Pro.
No ads, dark-mode and 6 months free of IntelliJ Idea Ultimate to start with.
1. Overview
Several factors can make a network underperform. Some of the most common reasons for slow network connectivity are high latency, application dependencies, packet loss, intercepting devices, and inefficient window sizes. Network latency refers to the time it takes for data to travel from its source to its destination.
Often, network congestion is a temporary issue that occurs when traffic flowing through a network exceeds its maximum capacity. In most cases, it’s caused by a sudden upsurge in traffic. When the network is continually slow, there might be other persistent factors.
In this tutorial, we’ll look at some of the Linux tools we can use to monitor our network and detect these issues.
2. Nagios
Nagios is a powerful open-source monitoring tool used to monitor networks, systems, infrastructure, and applications. It allows us to monitor various aspects of our network performance, such as uptime, latency, disk usage, CPU utilization, and others.
We can configure Nagios to display data for different hosts on the network and also for each service running on those hosts.
2.1. Installing Nagios
We can easily install Nagios by downloading and compiling the source code:
$ sudo apt-get update
$ sudo apt-get install -y autoconf gcc libc6 make wget unzip apache2 php libapache2-mod-php7.4 libgd-dev
$ sudo apt-get install openssl libssl-dev

$ cd ~/tmp
$ wget -O nagioscore.tar.gz https://github.com/NagiosEnterprises/nagioscore/archive/nagios-4.4.14.tar.gz
$ tar xzf nagioscore.tar.gz

$ cd /tmp/nagioscore-nagios-4.4.14/
$ sudo ./configure --with-httpd-conf=/etc/apache2/sites-enabled
$ sudo make all

$ sudo make install-groups-users
$ sudo usermod -a -G nagios www-data
Next, we need to ensure we’ve installed the binary files, CGIs, and HTML files. We also install the daemon files and configure it to start at boot:
$ sudo make install
$ sudo make install-daemoninit
Let’s install the command mode. This installs and configures the external command file:
$ sudo make install-commandmodeAdditionally, we need to ensure we’ve installed and configured Apache’s web server.
Next, we’ll have to create an Apache user account to be able to log into Nagios:
$ sudo htpasswd -c /usr/local/nagios/etc/htpasswd.users nagiosadminFor any other user we’re adding, we need to remove the -c flag. Otherwise, we’ll replace the existing ‘nagiosadmin’ user.
To modify the default configurations, we edit the files in /etc/nagios3/ directory. Some of these files are nagios.cfg where we can set the global options, and /etc/nagios3/conf.d where we define host services, contact groups, and more.
In addition, we define the host we want to monitor in the hosts.cfg file including parameters like IP addresses, hostname, and the services we want to monitor on each host in the services.cfg file (for example, HTTP, FTP, and SSH).
Let’s be sure to restart the Apache web server and the Nagios service after every change:
$ sudo systemctl restart apache2.service
$ sudo systemctl start nagios.service
2.2. Exploring Nagios
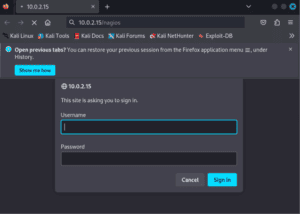
We can access the web interface via a web browser through “http://localhost/nagios/“:
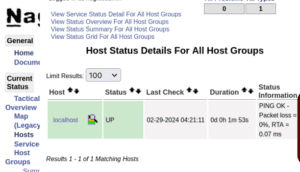
Following this, Nagios will start monitoring the configured hosts and services according to our defined parameters. We can always customize these parameters and thresholds according to the outcome we want to achieve.
Next, we need to ensure we’ve installed the required plugins as per the documentation. After adding the plugins, let’s refresh our browser:
We can click on other options to view different statistics. For example, if we want to view all the currently running services, we click on the Services link:
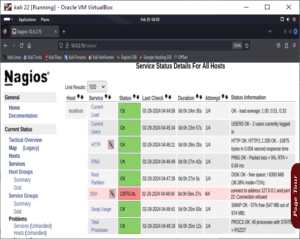
We can click on any service to view statistical information about it.
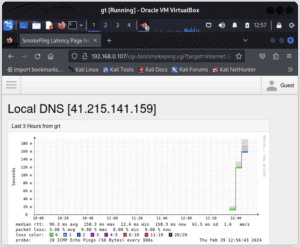
3. SmokePing
SmokePing is an open-source network latency monitoring tool. We use it to compute, store, and display latency, latency distribution, and packet loss.
By design, SmokePing measures the round-trip time (RTT) between two or more hosts on a network. This is achieved by sending ICMP echo requests and recording the time taken for each request to be returned.
Additionally, it utilizes the RRDtool to keep data stored for a longer duration and to draw pretty graphs. The information collected by SmokePing is updated every few seconds by default, although we can customize this to our specifications as needed.
Further, we can use SmokePing to measure the delay between applications, web servers, and more.
Apart from measuring network latency, some of the other common features of SmokePing are:
- It uses the collected data to generate graphical charts to visualize latency trends over time.
- It has an advanced alarm system that can be triggered if “latency patterns” configured.
3.1. SmokePing Probes
SmokePing uses various probes (small programs that can be used to perform/investigate a specific action) to monitor network performance. These probes are specialized modules responsible for sending specific types of packets to targets and collecting data about network latency and packet loss:
- It sends ICMP echo request packets to the target and measures the RTT for each packet. This is suitable for monitoring the general responsiveness of a network.
- The DNS probe measures the response time of DNS queries to resolve domain names to IP addresses.
- The HTTP probe measures the response time of HTTP requests to web servers.
- The TCP probe measures the RTT and packet loss rate of TCP connections to a specified port on the target.
- The UDP probe measures the RTT and packet loss rate of UDP packets sent to a specified port on the target.
- Other probes include curl, LDAP, Fping6, FpingContinuous, NFSping, Qstat, and RADIUS.
3.2. Installing SmokePing
Firstly, for SmokePing to work properly, we need to ensure that a web server and a database exist before installing it. If not, we should install them:
$ sudo apt update
$ sudo apt install apache2 mysql
Following this, we can install SmokePing since it’s available through our OS distribution’s package manager:
$ sudo apt-get install smokeping -yNext, we access the web interface through “http://hosts_ip_address/cgi-bin/smokeping.cgi”:
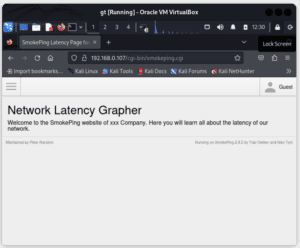
Subsequently, we edit the /etc/smokeping/config file where we define the targets we want to monitor (such as servers, routers, or other network devices). After specifying the targets to monitor, we can access them by selecting the titles we defined in the menu section:
4. NetHogs
NetHogs is an open-source command-line tool used for monitoring network traffic in a Linux environment. It provides real-time insights into which processes are consuming network bandwidth. This makes it valuable for network monitoring, troubleshooting, and identifying bandwidth-intensive applications.
NetHogs obtains its data from files in the /proc/net directory and doesn’t rely on any kernel modules. When displaying the collected data, it shows both the process ID (PID) and the program’s name. This makes it easy to identify which programs are consuming a lot of bandwidth.
Before installing NetHogs, we need to ensure libcurses5-dev and libcap0.8-dev are installed. NetHogs depends on ncurses for the text-based interface and libpcap for user-level packet capture.
Let’s install it through our package manager:
$ sudo apt-get install nethogsWhen we start NetHogs, it displays the current network data. It then continually picks up data by using both proc data and libpcap for user-level packet capture. It then displays a text-based chart, using ncurses:
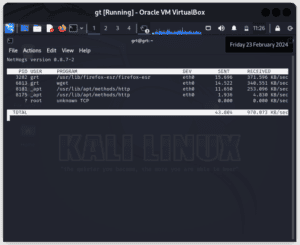
NetHogs is an interactive program that can be used in shell programs, or as a graphical program with the nethogs-qt-based GUI. If we run NetHogs without specifying any options, it defaults to measuring traffic to and from the eth0 port:
$ sudo nethogsWe can also use it to measure multiple ports at a time:
$ sudo nethogs -d 5 eth0 eth15. BandwidthD
BandwidthD is an open-source network monitoring tool designed to track and analyze network traffic patterns. It operates by capturing packets on a network interface and then categorizing them based on various criteria such as IP addresses, protocols, and ports. The data can be collected for 2 days, 8 days, 40 days, and 400 days.
To use BandwidthD, we need to install it on a server or a computer within our network:
$ sudo apt-get install bandwidthdAlso, we need to ensure that libpcap, libgl, and libpng libraries are present in our system. If not, we must install them.
Once installed, we can modify the default configurations by editing the /etc/bandwidthd/bandwidthd.conf file. While editing configurations, we need to specify the network interface(s) we want to monitor, as well as other settings such as data storage location and port number.
Next, let’s start bandwidthd:
$ sudo bandwidthdThis will create a web user interface (http://routers_ip_address/bandwidthd) from which we can start capturing network traffic passing through the interface(s) we’ve chosen. It will collect data continuously and use it to generate graphs.
From the web interface, we’re able to view the reports generated from the collected data by accessing the static files located in the /var/lib/bandwidthd/htdocs/ directory. We can also configure Apache to serve it.
In the following examples, we’re visualizing the amount of data consumed by each protocol running in our network:
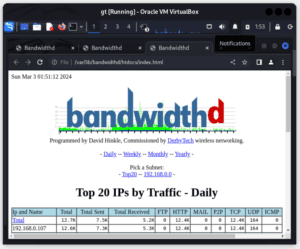

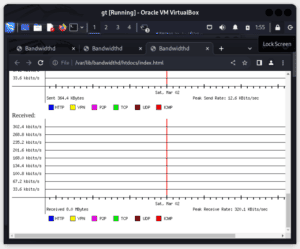
These results are denoted using an IP address. To display the graphs, we click on the IP address we’re interested in. These visualizations provide insights into network usage, identifying which hosts, protocols, or services are consuming the most bandwidth. The HTTP, TCP, UDP, ICMP, VPN, and P2P protocols are color-coded.
From the graphs, we can now analyze the reports to identify any congestion points or abnormal traffic patterns. This helps in troubleshooting network performance issues and optimizing resource allocation.
6. Wireshark
Wireshark is a powerful tool for monitoring network traffic that we can use to identify the root causes of a slow or congested network. Often, it comes preinstalled in most Linux distros, but if it’s missing, we can install it through:
$ sudo apt update
$ sudo apt-get install wireshark
To effectively monitor our congested network using Wireshark, we need to ensure that our adapter supports monitor mode. Wireshark has many features that would help us identify slow/congested networks.
For example, to begin our troubleshooting, we capture network traffic on the affected network segment using Wireshark. Then, we apply display filters in Wireshark to focus on specific types of traffic relevant to the slow or congested network. For instance, we can filter by source or destination IP addresses, protocols, or ports associated with the affected services.
Next, we use Wireshark’s statistics tools (to generate IO graphs) to analyze bandwidth usage and identify bandwidth-intensive applications/devices on the network. We look for excessive traffic volume, spikes, or errors that may indicate latency/congestion.
For example, in the examples below, we can see the number of TCP errors occurring within a period:
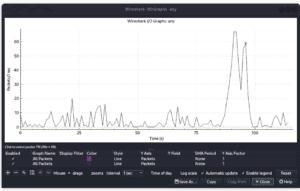
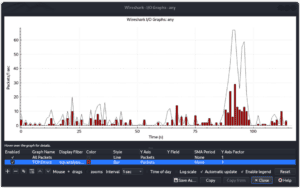
Finally, we should analyze the packet round-trip times (RTT) and response times to identify latency issues. Essentially, we’re looking for delays in packet transmission or server responses that may be contributing to network slowness.
7. Conclusion
In this article, we’ve looked at some of the most common Linux tools used for monitoring networks. Also, we’ve briefly discussed how to obtain and install these tools and how to use them to identify network issues. These tools offer various features, with some being more detailed than others.
Depending on our requirements and environments, we can select any tool that best suits us.