

Mocking is an essential part of unit testing, and the Mockito library makes it easy to write clean and intuitive unit tests for your Java code.
Get started with mocking and improve your application tests using our Mockito guide:
Handling concurrency in an application can be a tricky process with many potential pitfalls. A solid grasp of the fundamentals will go a long way to help minimize these issues.
Get started with understanding multi-threaded applications with our Java Concurrency guide:
Spring 5 added support for reactive programming with the Spring WebFlux module, which has been improved upon ever since. Get started with the Reactor project basics and reactive programming in Spring Boot:
Since its introduction in Java 8, the Stream API has become a staple of Java development. The basic operations like iterating, filtering, mapping sequences of elements are deceptively simple to use.
But these can also be overused and fall into some common pitfalls.
To get a better understanding on how Streams work and how to combine them with other language features, check out our guide to Java Streams:
Explore Spring Boot 3 and Spring 6 in-depth through building a full REST API with the framework:
Yes, Spring Security can be complex, from the more advanced functionality within the Core to the deep OAuth support in the framework.
I built the security material as two full courses - Core and OAuth, to get practical with these more complex scenarios. We explore when and how to use each feature and code through it on the backing project.
You can explore the course here:
Spring Data JPA is a great way to handle the complexity of JPA with the powerful simplicity of Spring Boot.
Get started with Spring Data JPA through the guided reference course:
Refactor Java code safely — and automatically — with OpenRewrite.
Refactoring big codebases by hand is slow, risky, and easy to put off. That’s where OpenRewrite comes in. The open-source framework for large-scale, automated code transformations helps teams modernize safely and consistently.
Each month, the creators and maintainers of OpenRewrite at Moderne run live, hands-on training sessions — one for newcomers and one for experienced users. You’ll see how recipes work, how to apply them across projects, and how to modernize code with confidence.
Join the next session, bring your questions, and learn how to automate the kind of work that usually eats your sprint time.
1. Overview
A WebSocket provides an event-driven, bi-directional, and full-duplex connection between a client and the server. WebSocket communication involves a handshake, messaging (sending and receiving messages), and closing the connection.
In this tutorial, we’ll learn to debug WebSockets using browsers and other popular tools.
2. Building a WebSocket
Let’s start by building a WebSocket server that pushes stock ticker updates to the clients.
2.1. Maven Dependencies
Firstly, let’s declare the Spring WebSocket dependency:
<dependency>
    <groupId>org.springframework.boot</groupId>
    <artifactId>spring-boot-starter-websocket</artifactId>
    <version>2.5.4</version>
</dependency>
2.2. Spring Boot Configuration
Next, let’s define the required @Configurations to enable WebSocket support:
@Configuration
@EnableWebSocketMessageBroker
public class WebsocketConfiguration implements WebSocketMessageBrokerConfigurer {
    @Override
    public void configureMessageBroker(MessageBrokerRegistry config) {
        config.enableSimpleBroker("/topic");
        config.setApplicationDestinationPrefixes("/app");
    }
    @Override
    public void registerStompEndpoints(StompEndpointRegistry registry) {
        registry.addEndpoint("/stock-ticks").withSockJS();
    }
}
Note that this configuration provides a message broker-based WebSocket and registers STOMP endpoints.
Additionally, let’s create a controller that sends mock stock updates to the subscribers:
private SimpMessagingTemplate simpMessagingTemplate;

public void sendTicks() {
    simpMessagingTemplate.convertAndSend("/topic/ticks", getStockTicks());
}
2.3. Client – A User Interface
Let’s build an HTML5 page that displays the updates from the server:
<div class="spinner-border text-primary" role="status">
    <span class="visually-hidden">Loading ...</span>
</div>
Next, let’s connect to a WebSocket server using SockJS:
function connect() {
    let socket = new SockJS('/stock-ticks');
    stompClient = Stomp.over(socket);
    stompClient.connect({}, function (frame) {
        stompClient.subscribe('/topic/ticks', function (ticks) {
            ...
        });
    });
}
Here, we open a WebSocket using SockJS and then subscribe to the topic /topic/ticks. Eventually, the client consumes and displays the messages on the user interface when the server produces the messages.
2.4. Demonstration
Let’s start the server and open the application in a browser:
mvn spring-boot:runAs a result, we see the stock ticks changing every three seconds without a page refresh or a server poll:
So far, we’ve built an application that receives stock ticks on a WebSocket. Next, let’s learn how to debug this application.
3. Mozilla Firefox
Mozilla Firefox has a WebSocket inspector along with other web developer tools. In Firefox, we can enable the developer tools in several ways:
- Windows and Linux: Ctrl + Shift + I or F12 or Application Menu → More Tools → Web Developer Tools
- macOS: Cmd + Opt + I
Next, click on Network Monitor → WS to open the WebSockets pane:

With the WebSocket inspector active, let’s explore it further.
3.1. Handshake
Open the URL http://localhost:8080 in Firefox. With the developer tools open, we now see an HTTP handshake. Click on the request to analyze the handshake:
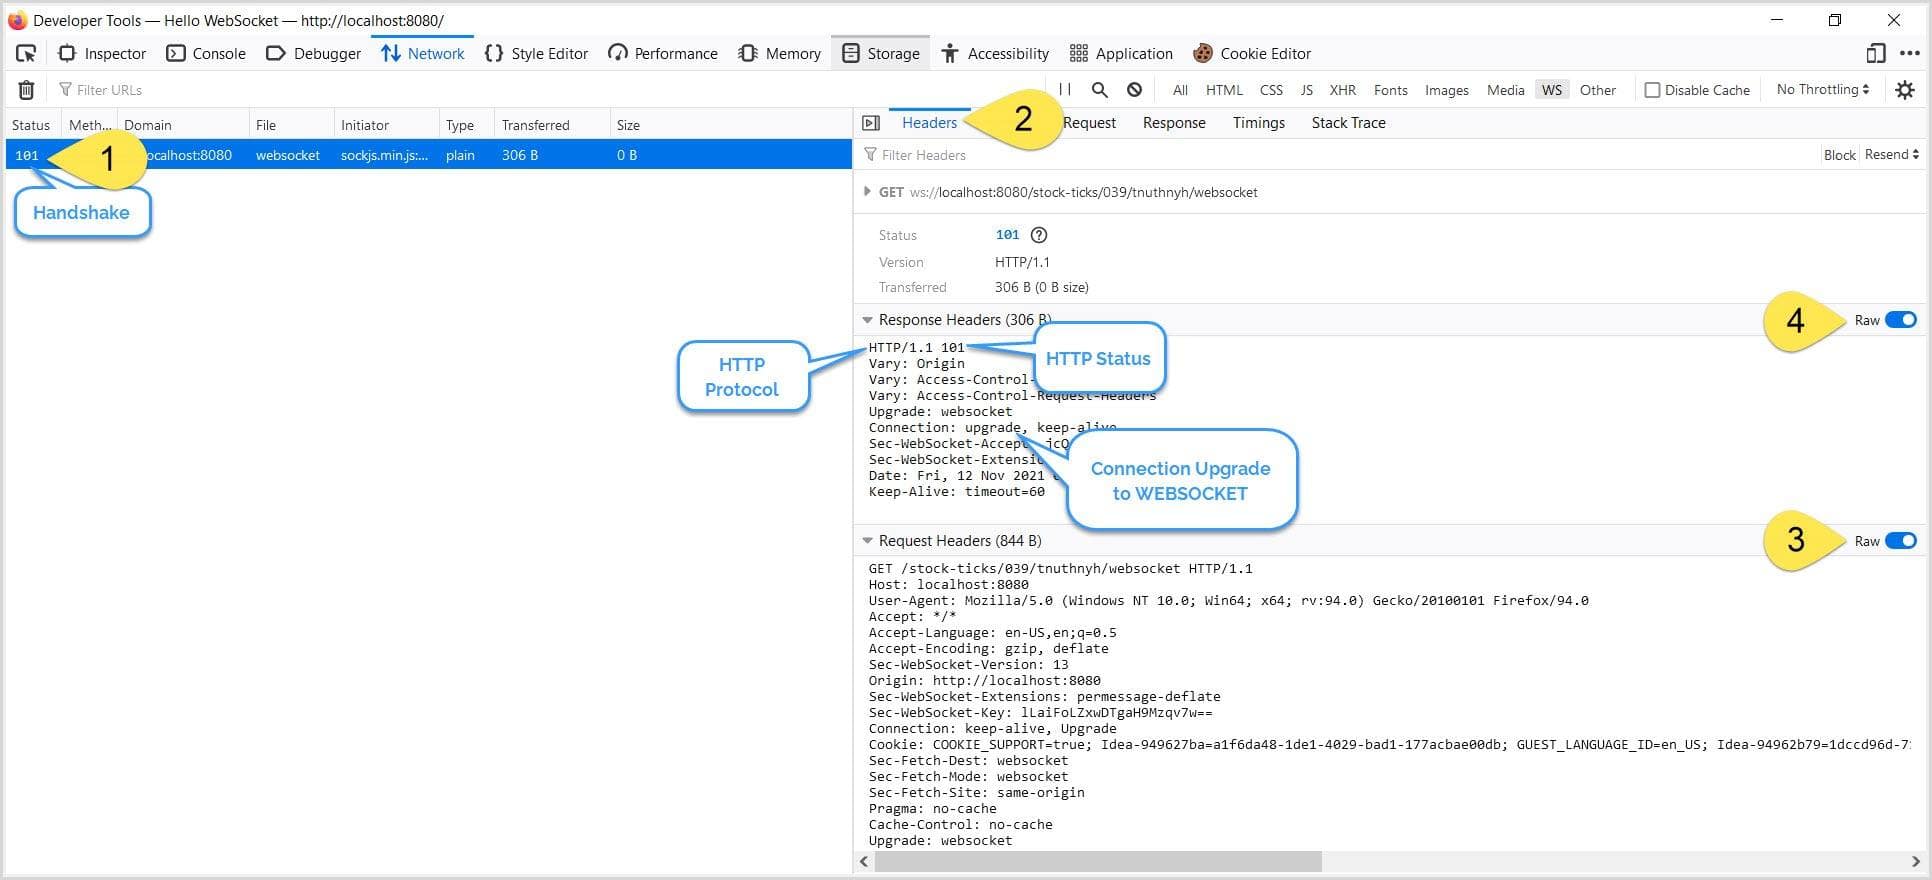
Under the Headers tab, we see request and response headers with protocol upgrades and other WebSocket headers.
3.2. Message Exchange
Subsequently, after the handshake, the message exchange begins. Click on the Response tab to view the message exchange:
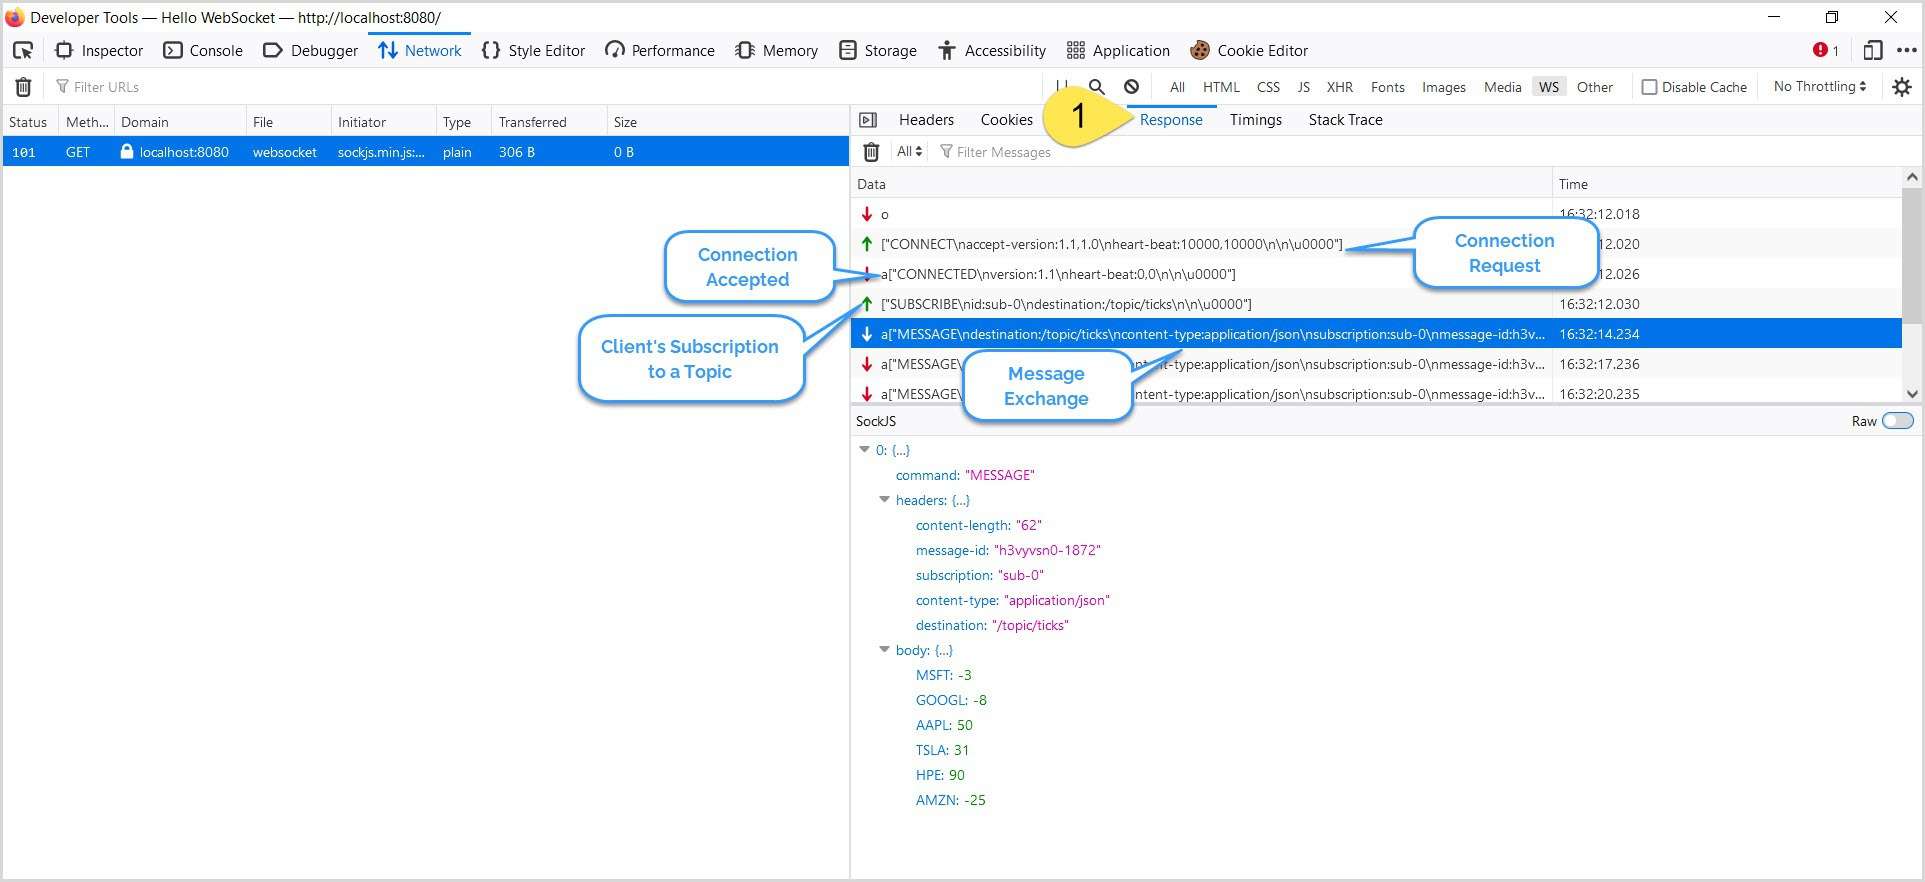
In the Response pane, a ![]() shows a client request and a
shows a client request and a ![]()
![]() represents the server response.
represents the server response.
3.3. Connection Termination
In WebSockets, either a client or a server can close the connection.
First, let’s emulate client-side connection termination. Click on the Disconnect button on the HTML page and view the Response tab:
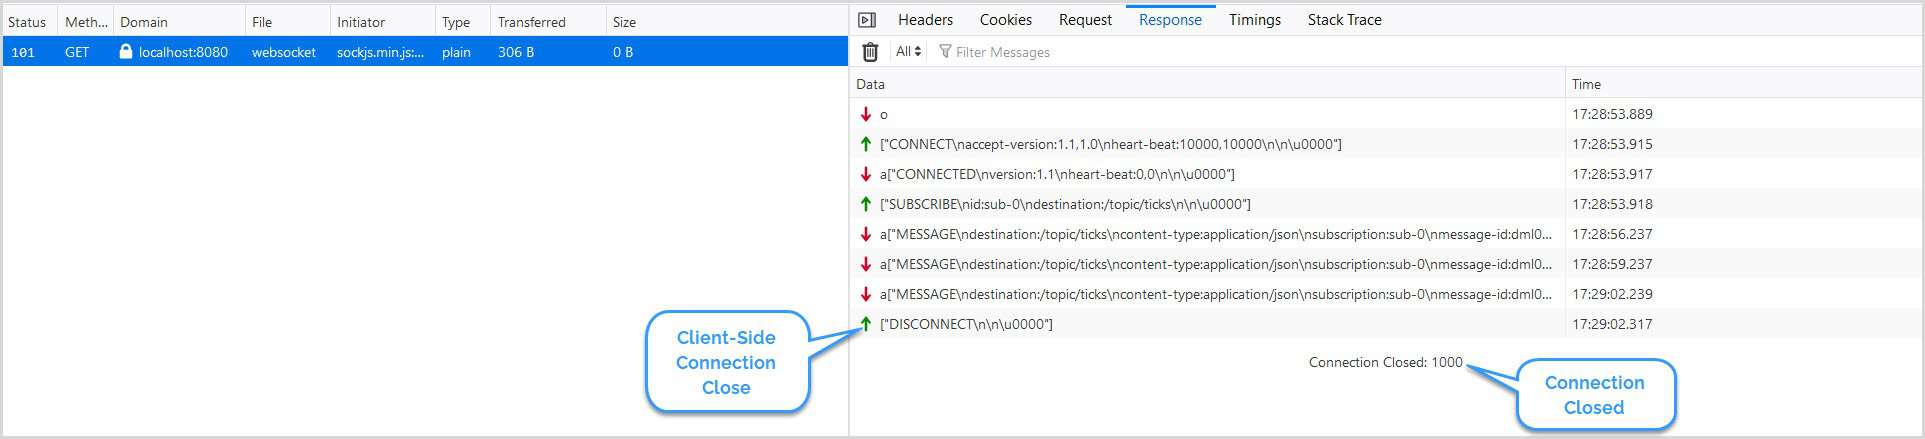
Here, we’ll see a connection termination request from the client.
Next, let’s shut down the server to emulate server-side connection closure. The connection closes as the server is not reachable:
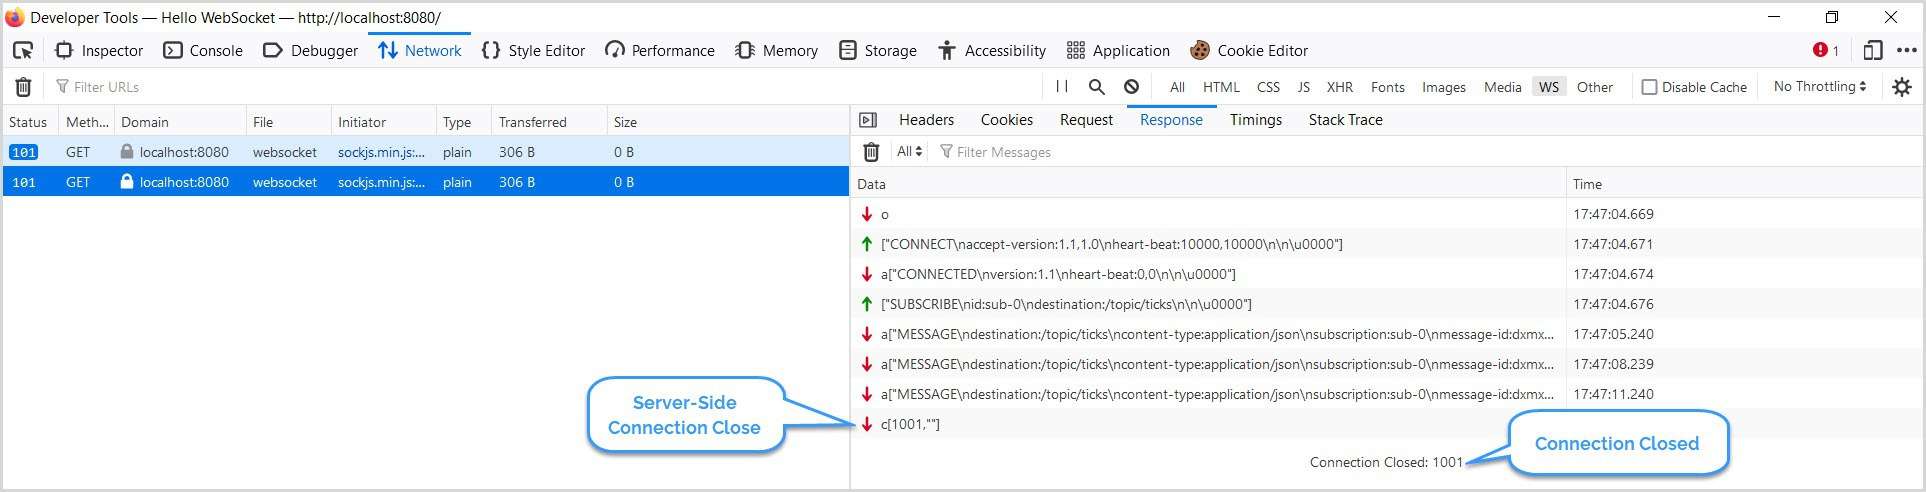
RFC6455 – The WebSocket Protocol specifies:
- 1000 – A normal closure
- 1001 – A server is down, or the user has navigated away from the page
4. Google Chrome
Google Chrome has a WebSocket inspector, a part of developer tools, that is similar to Firefox. We can activate the WebSocket inspector in a couple of ways:
- Windows and Linux: Ctrl + Shift + I or Ctrl + Shift + J or F12 or Application Menu → More Tools → Developer Tools
- macOS: Cmd + Opt + I
Next, click on the Network → WS panel to open the WebSocket pane:

4.1. Handshake
Now, open the URL http://localhost:8080 in Chrome and click on the request in the developer tools:
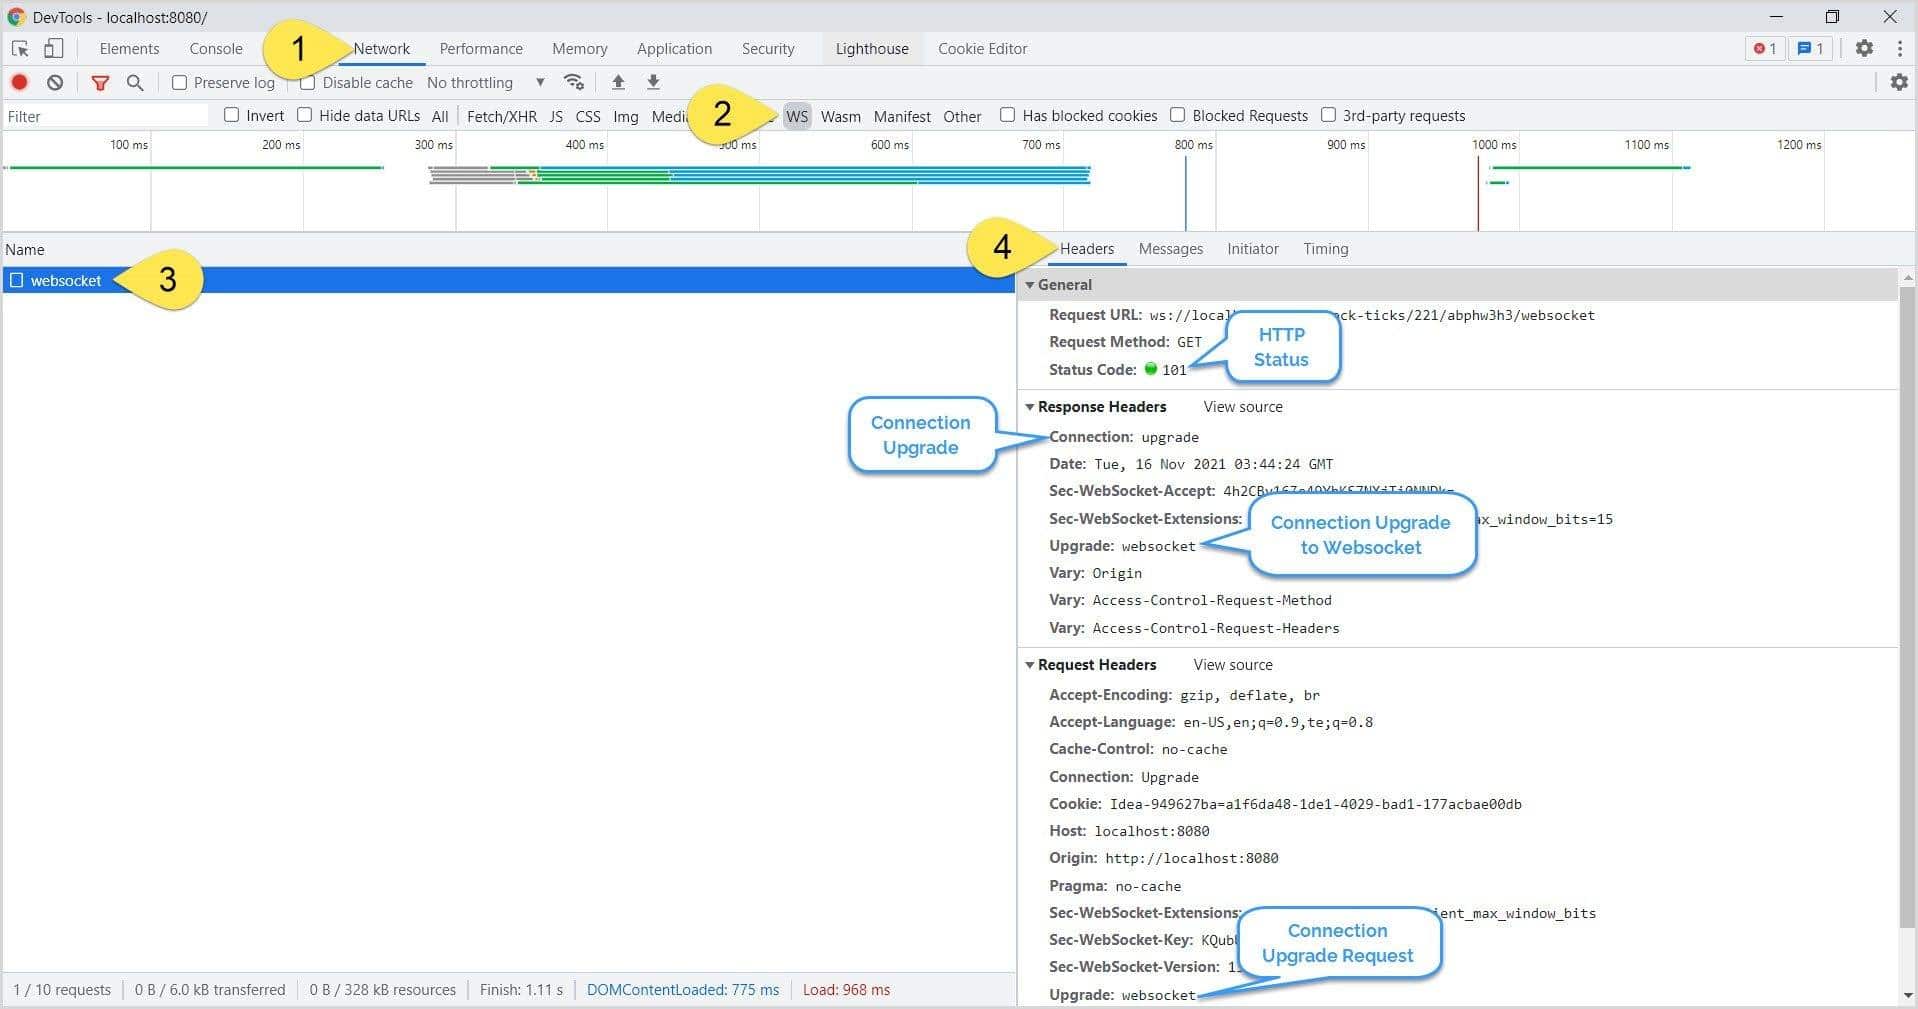
Under the Headers tab, we notice all the WebSocket headers, including the handshake.
4.2. Message Exchange
Next, let’s check the message exchange between the client and the server. On the developer tools, click on the Messages tab:
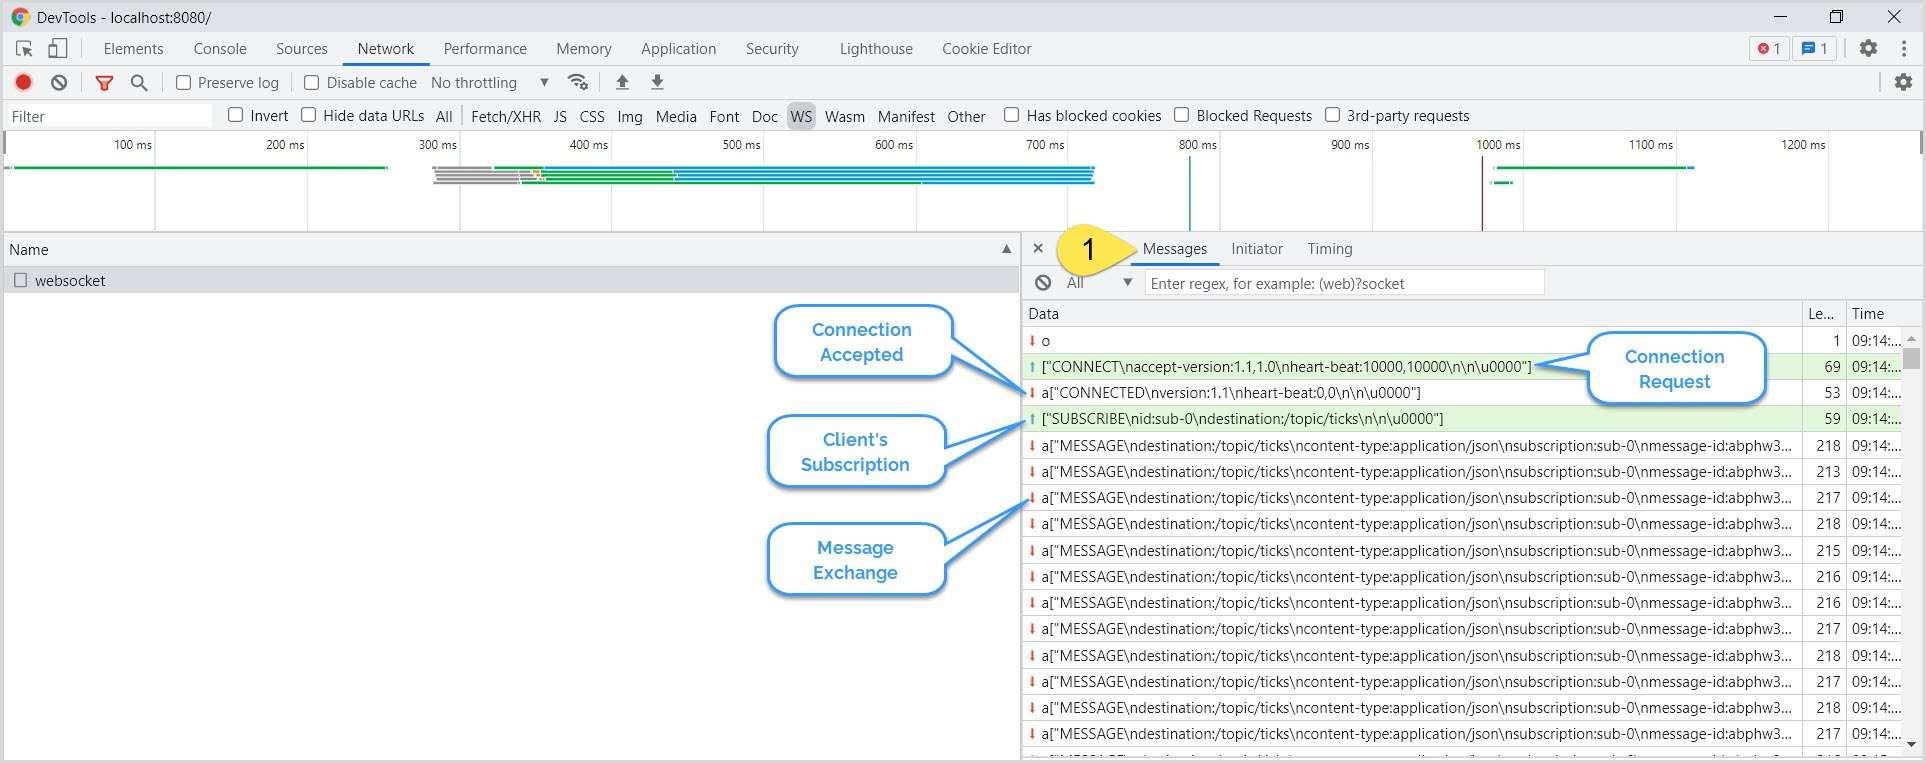
Like in Firefox, we can view the message exchange, including the CONNECT request, SUBSCRIBE request, and MESSAGE exchange.
4.3. Connection Termination
Finally, we’ll debug both the client-side and server-side connection termination. But, first, let’s close the client-side connection:
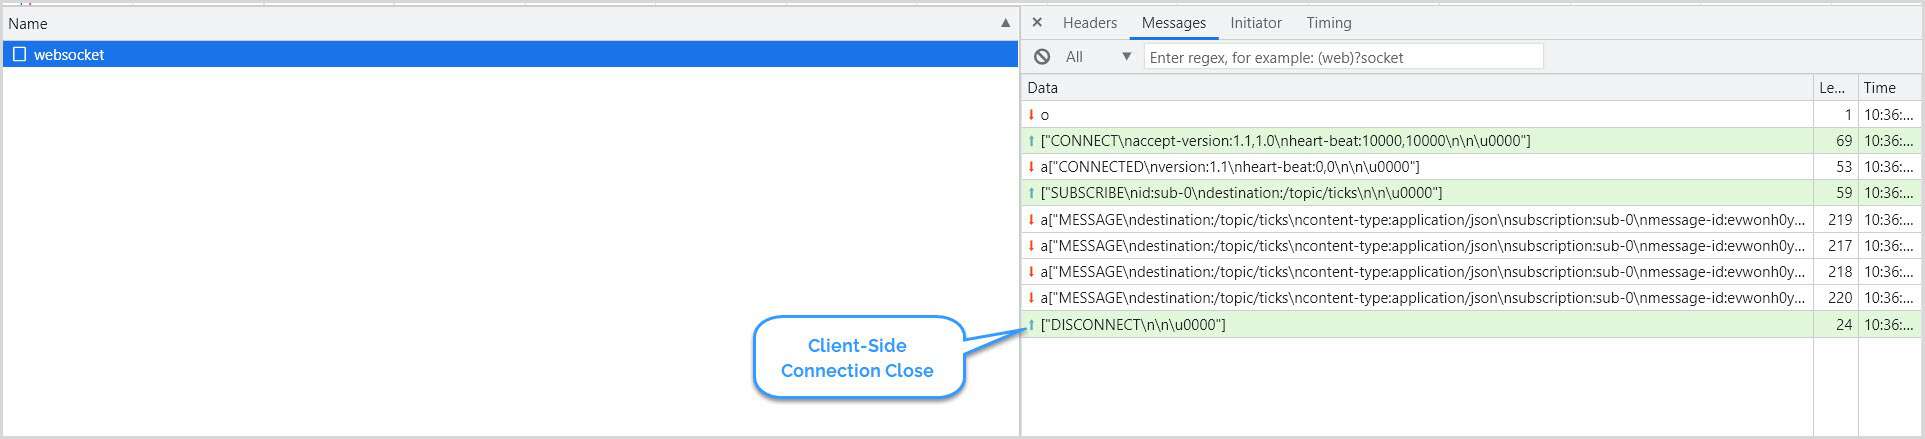
We can see a graceful connection termination between the client and the server. Next, let’s emulate a server terminating the connection:
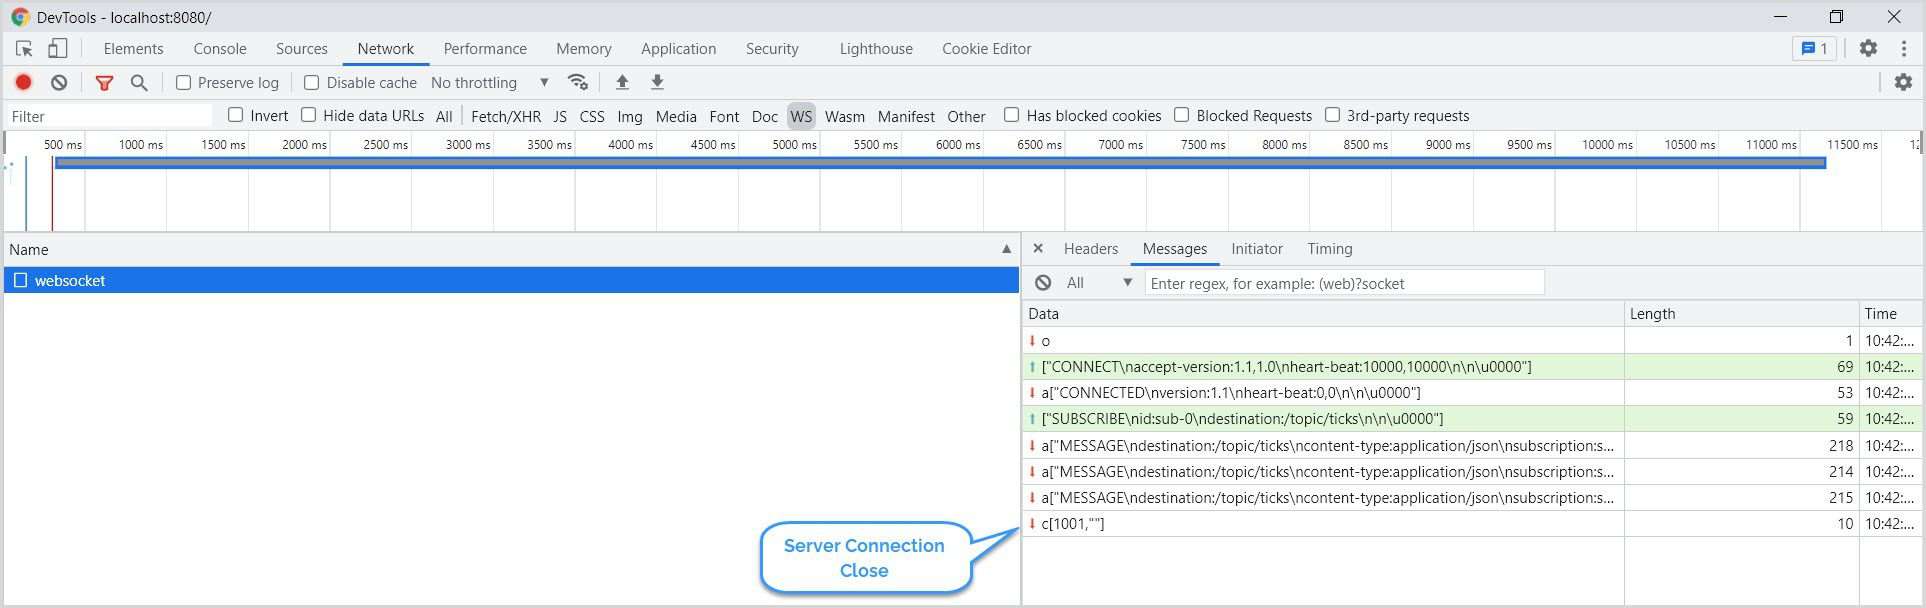
A successful connection termination ends the message exchange between the client and the server.
5. Wireshark
Wireshark is the most popular, extensive, and widely-used network protocol sniffing tool. So next, let’s see how to sniff and analyze the WebSocket traffic using Wireshark.
5.1. Capturing the Traffic
Unlike other tools, we have to capture the traffic for Wireshark and then analyze it. So, let’s begin with capturing the traffic.
In Windows, when we open Wireshark, it displays all the available network interfaces with live network traffic. Therefore, selecting the correct network interface to capture the network packets is essential.
Typically, the network interface will be a loopback adapter if the WebSocket server runs as localhost (127.0.0.1):
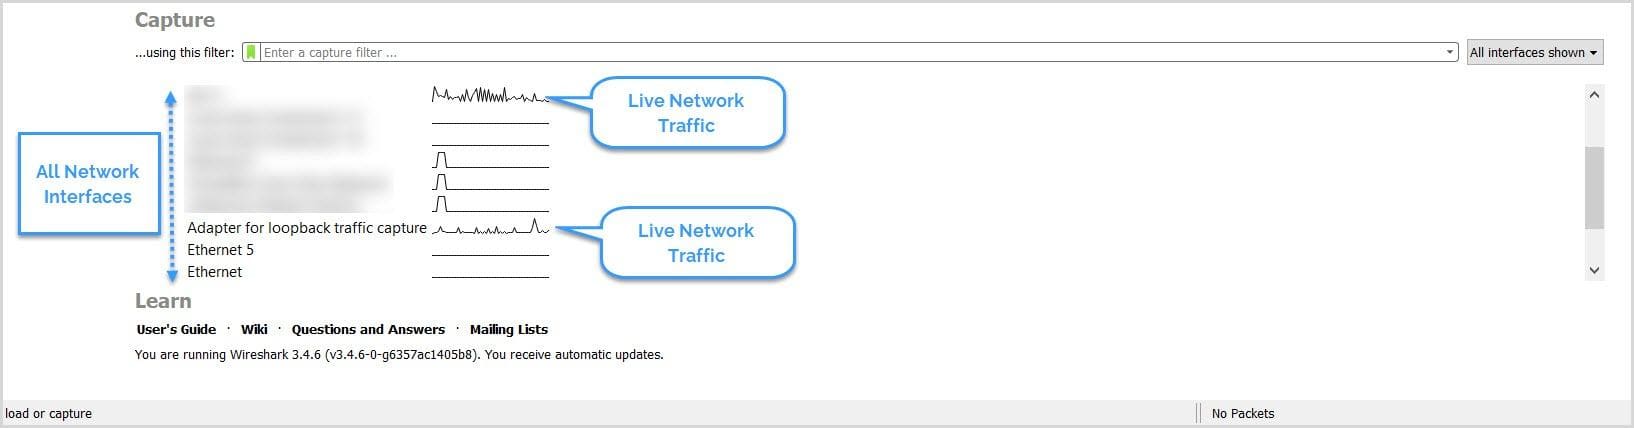
Next, to start capturing the packets, double-click on the interface. Once the correct interface is selected, we can further filter the packets based on the protocol.
In Linux, use the tcpdump command to capture the network traffic. For example, open a shell terminal and use this command to generate a packet capture file, websocket.pcap:
tcpdump -w websocket.pcap -s 2500 -vv -i loThen, use Wireshark to open the websocket.pcap file.
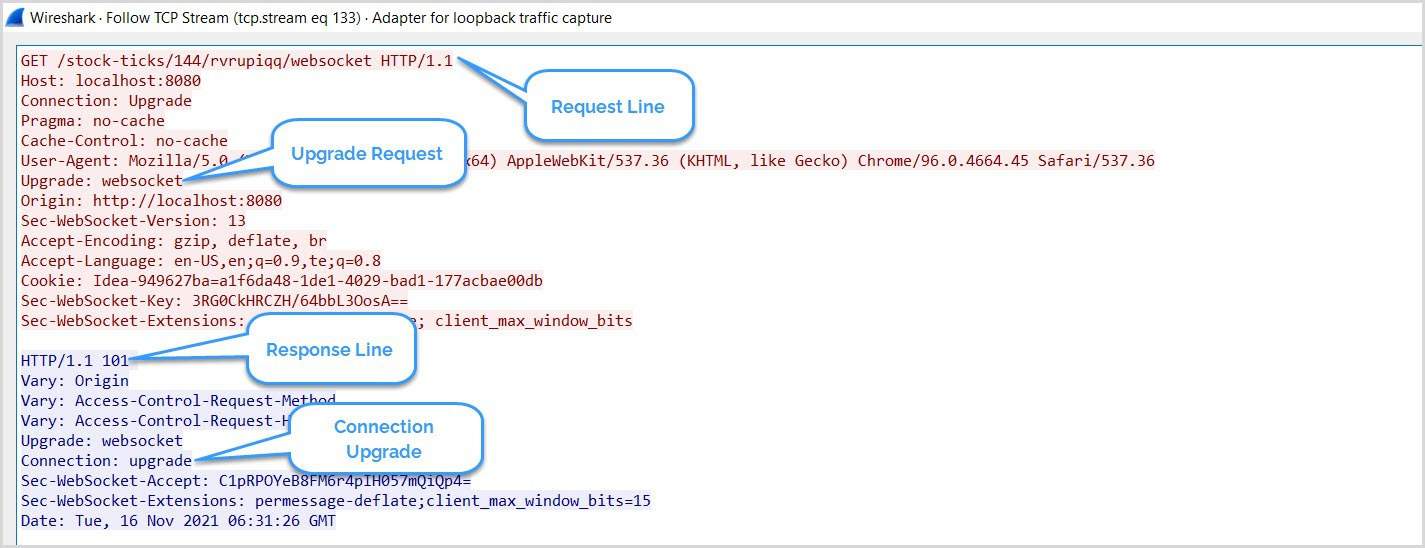
5.2. Handshake
Let’s try to analyze the network packets captured so far. First, since the initial handshake is on HTTP protocol, let’s filter the packets for http protocol:
Next, to get a detailed view of the handshake, right-click on the packet → Follow → TCP Stream:
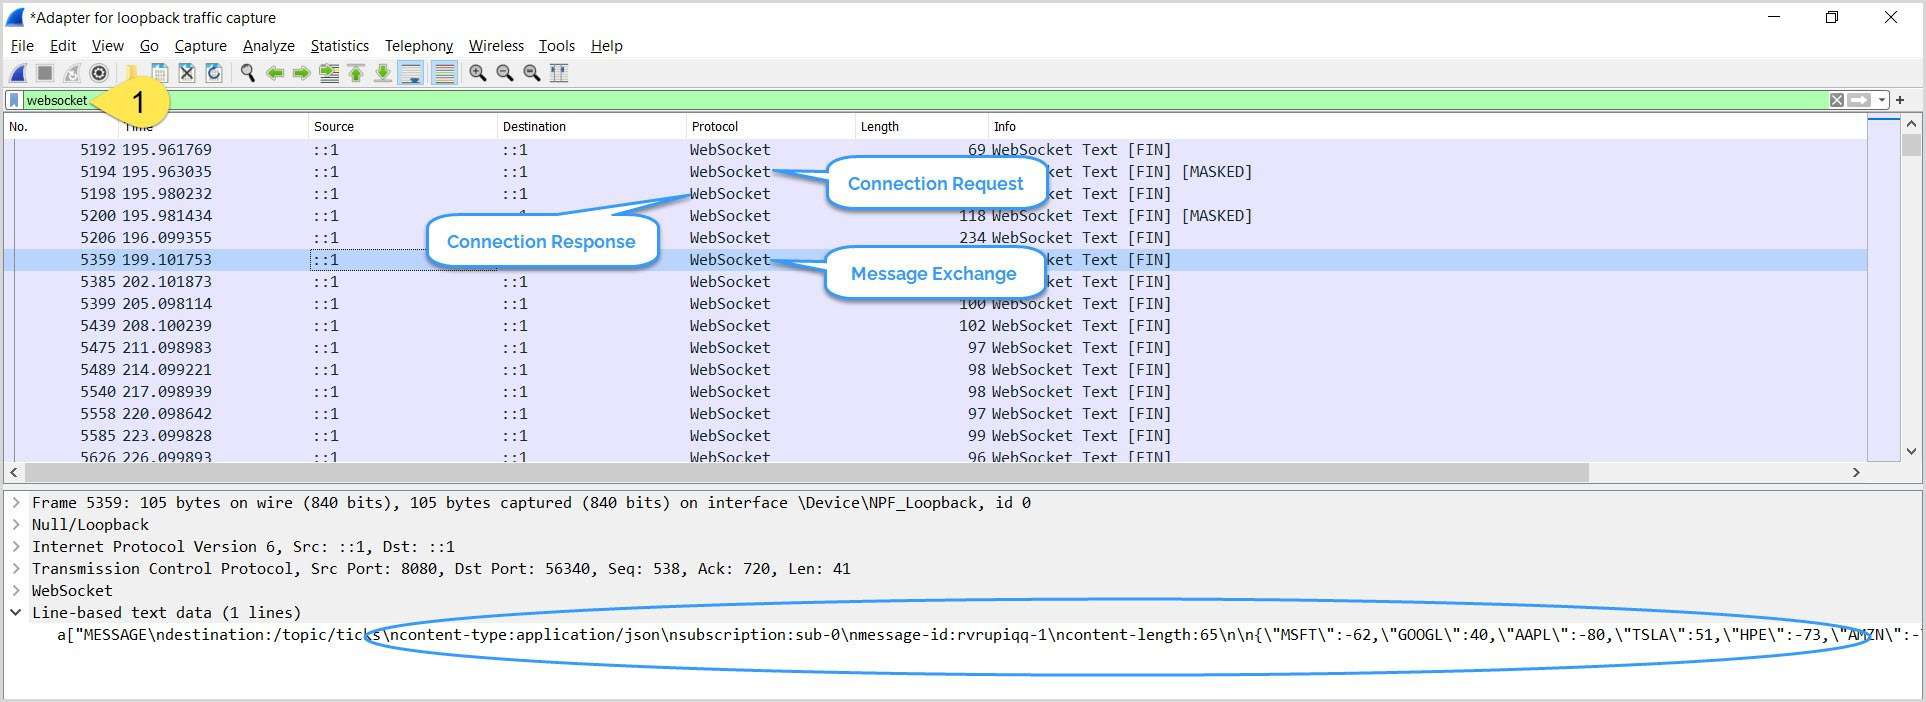
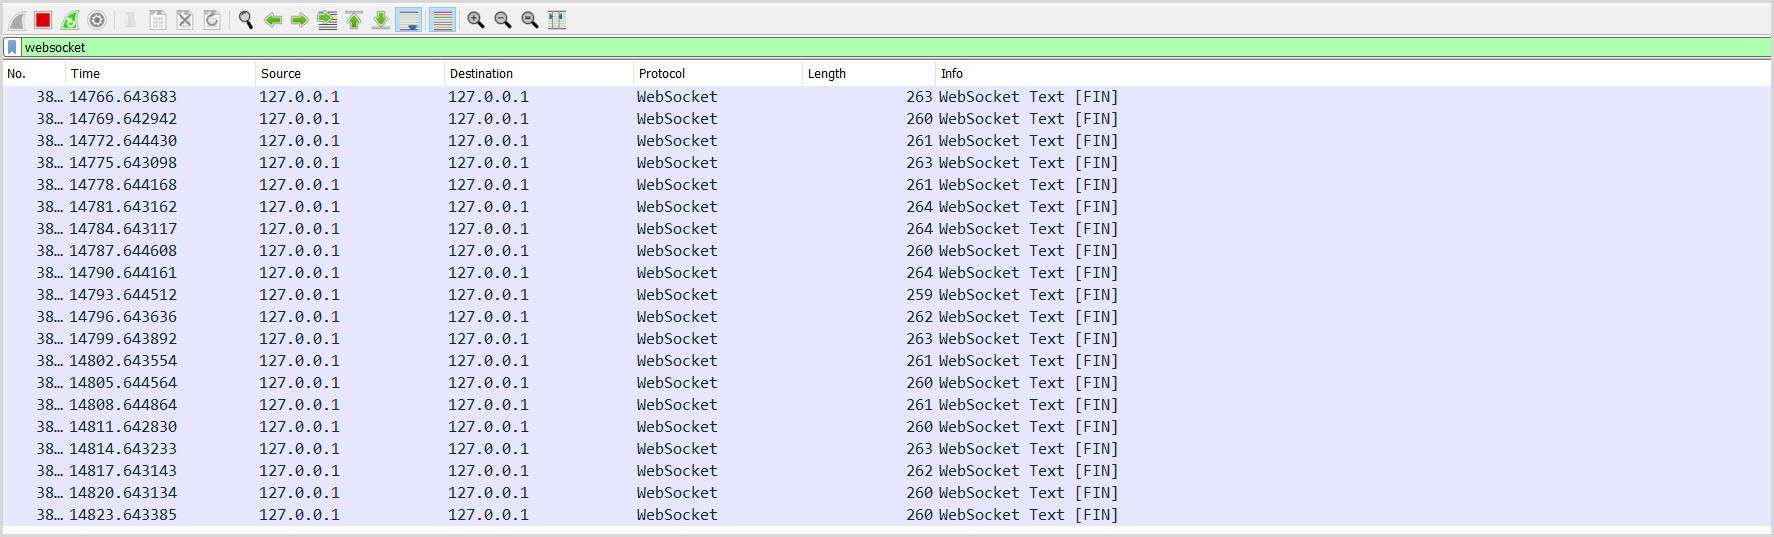
5.3. Message Exchange
Recall that, after the initial handshake, the client and the server communicate via the websocket protocol. So, let’s filter the packets for websocket. The remaining packets shown reveal the connection and message exchange:
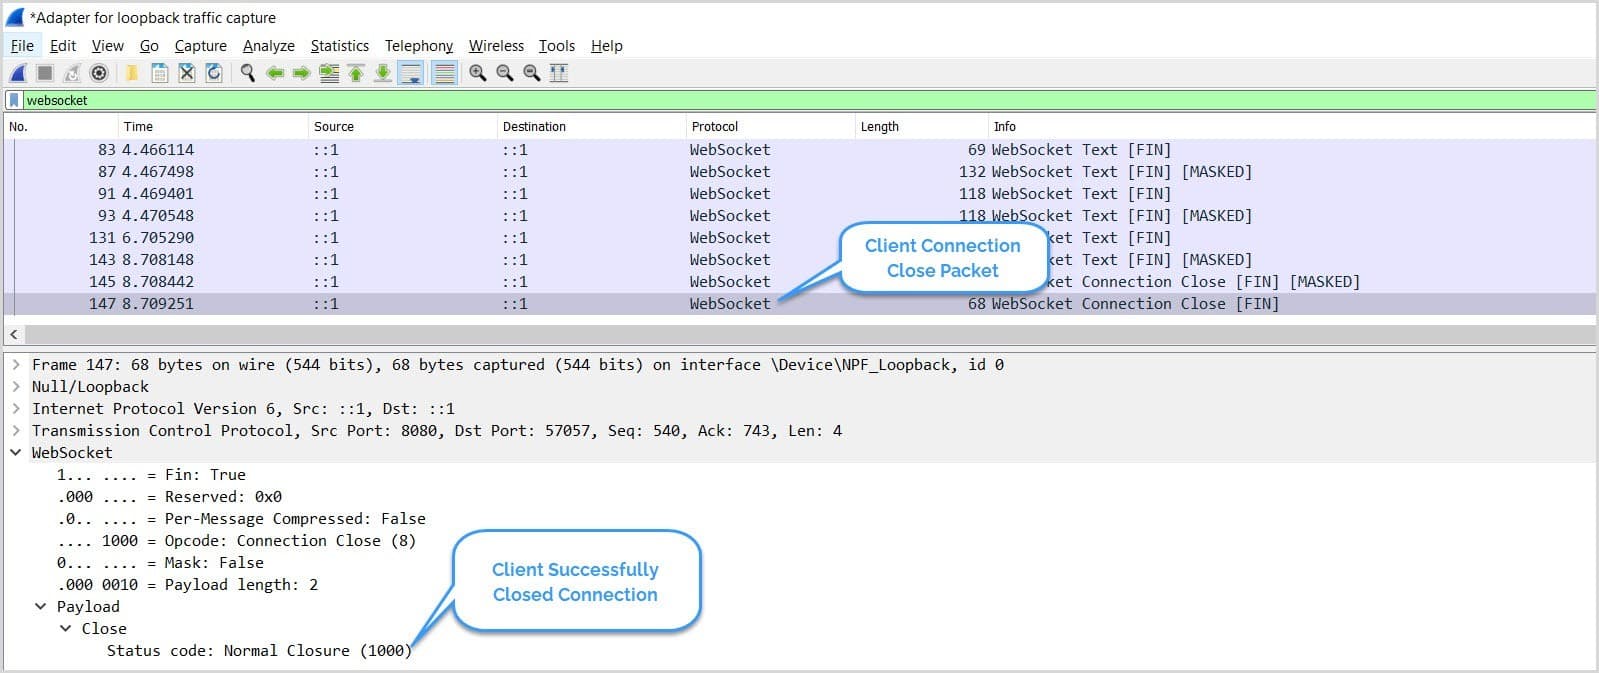
5.4. Connection Termination
First, let’s debug client-side connection termination. Start the Wireshark capture and click the Disconnect button on the HTML page and check the network packets:
Similarly, let’s emulate server-side connection termination. First, start the packet capture and then shutdown the WebSocket server:

6. Postman
As of date, Postman‘s support for WebSockets is still in Beta. However, we can still use it for debugging our WebSockets:
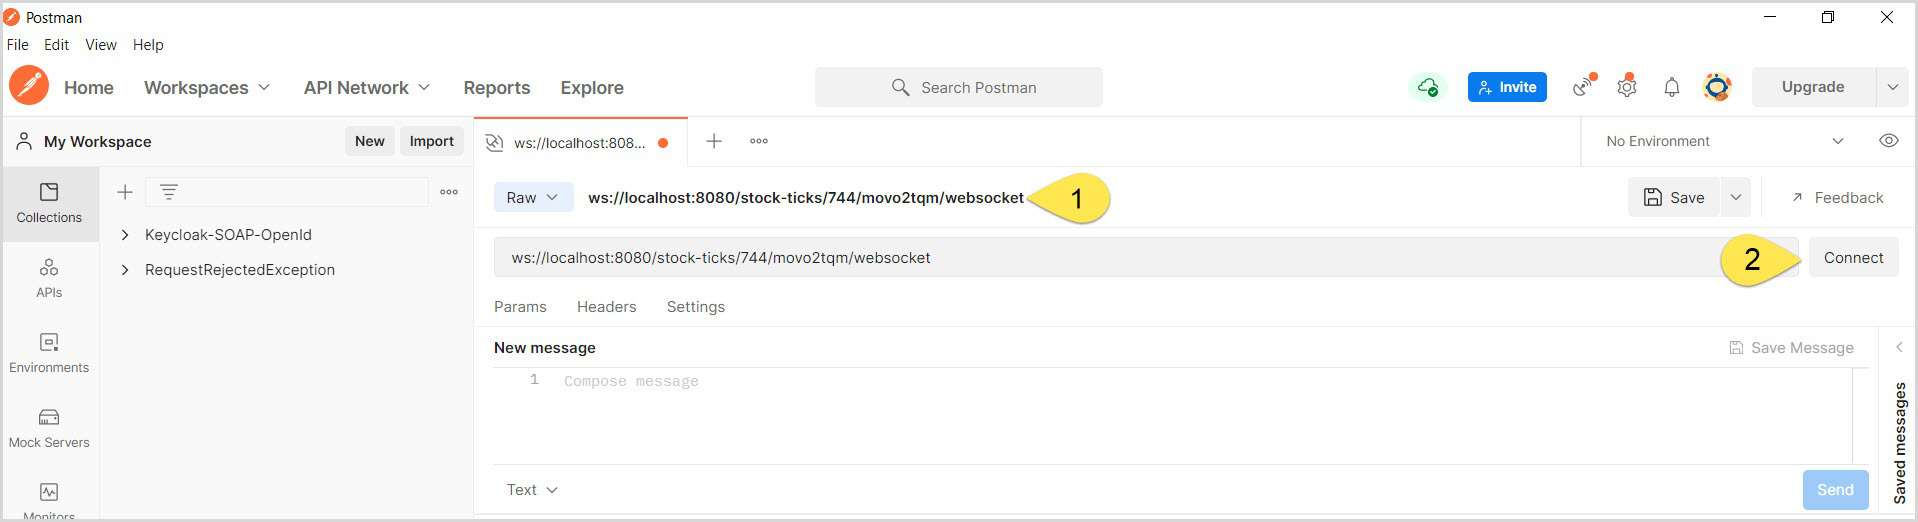
Open Postman and press Ctrl + N or New → WebSocket Request:

Next, in the Enter Server URL textbox, enter the WebSocket URL and click on Connect:
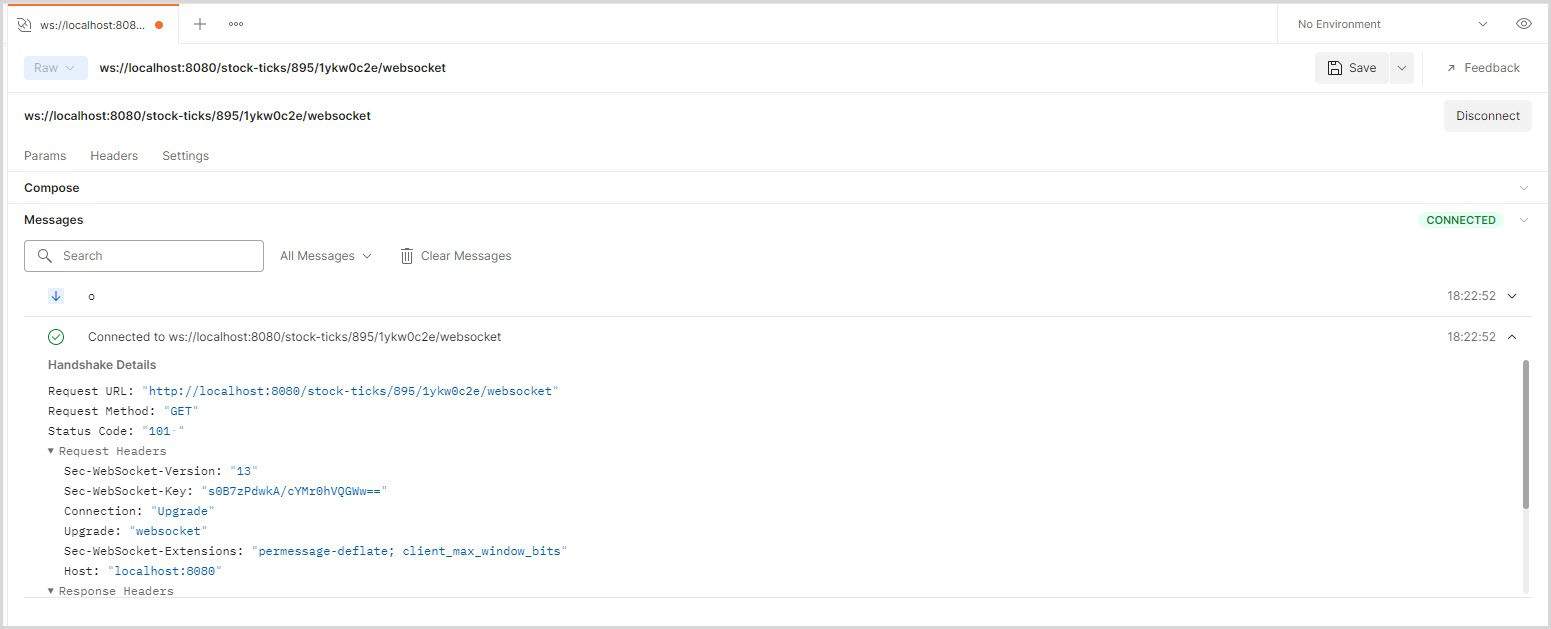
6.1. Handshake
Once the connection is successful, on the Messages section, click on the connection request to view the handshake details:
6.2. Message Exchange
Now, let’s check the message exchange between the client and server:
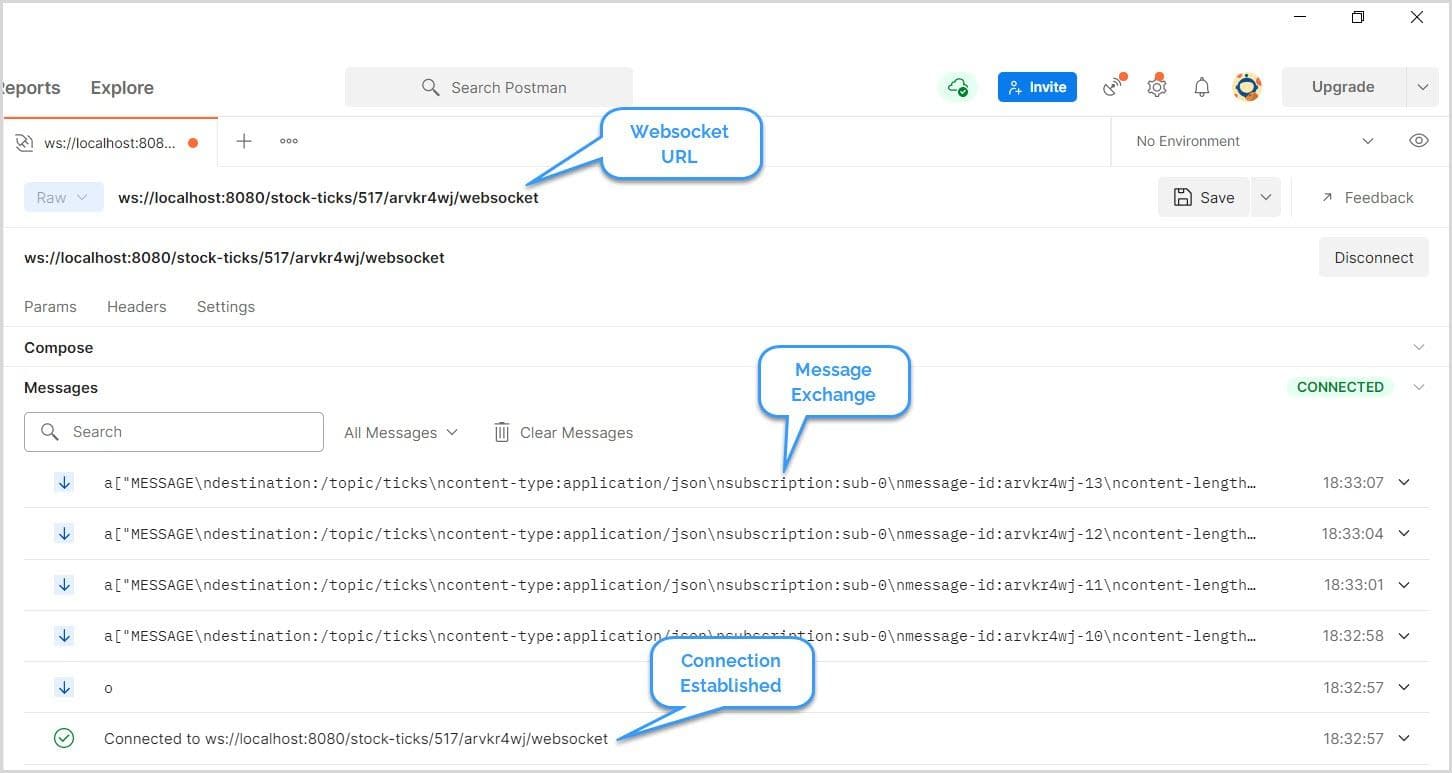
Once the client subscribes to the topic, we can see message flow between the client and the server.
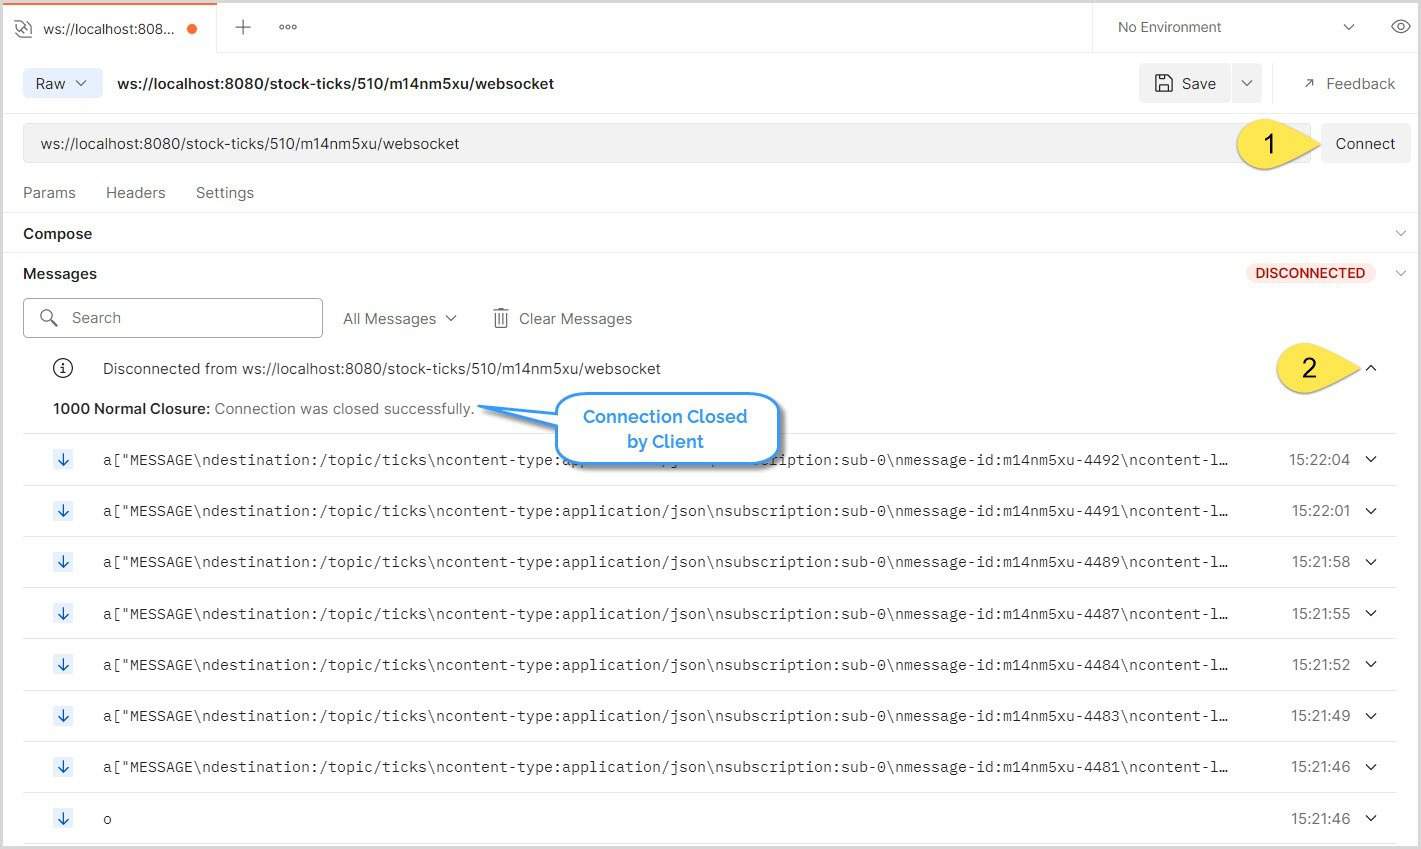
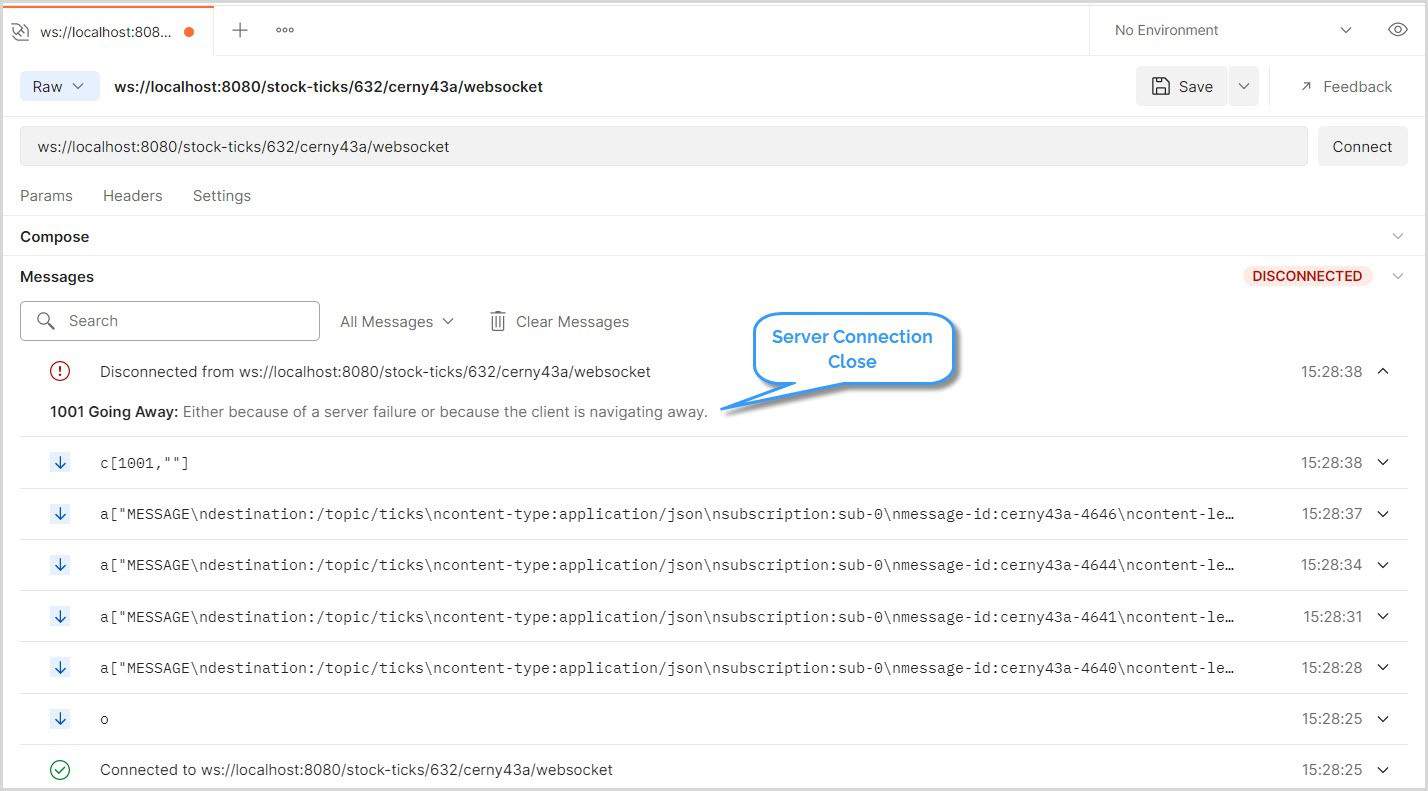
6.3. Connection Termination
Further, let’s see how to debug connection termination, both by the client and server. First, click the Disconnect button in Postman to close the connection from the client-side:
Similarly, to check the server connection termination, shut down the server:
7. Spring WebSocket Client
Finally, let’s debug WebSockets using a Spring-based Java client:
WebSocketClient client = new StandardWebSocketClient();
WebSocketStompClient stompClient = new WebSocketStompClient(client);
stompClient.setMessageConverter(new MappingJackson2MessageConverter());
StompSessionHandler sessionHandler = new StompClientSessionHandler();
stompClient.connect(URL, sessionHandler);
This creates a WebSocket client and then registers a STOMP client session handler.
Next, let’s define a handler that extends the StompSessionHandlerAdapter. Intentionally, the StompSessionHandlerAdapter class does not provide implementations except for the method getPayloadType. Hence, let’s give a meaningful implementation to these methods:
public class StompClientSessionHandler extends StompSessionHandlerAdapter {

    @Override
    public void afterConnected(StompSession session, StompHeaders connectedHeaders) {
        session.subscribe("/topic/ticks", this);
    }

    // other methods ...
}
Next, when we run this client, we get logs similar to:
16:35:49.135 [WebSocketClient-AsyncIO-8] INFO StompClientSessionHandler - Subscribed to topic: /topic/ticks
16:35:50.291 [WebSocketClient-AsyncIO-8] INFO StompClientSessionHandler - Payload -> {MSFT=17, GOOGL=48, AAPL=54, TSLA=73, HPE=89, AMZN=-5}
In the logs, we can see the connection and the message exchange. Moreover, while the client is up and running, we can use Wireshark to sniff the WebSocket packets:
8. Conclusion
In this tutorial, we learned how to debug WebSockets using some of the most popular and widely-used tools. As the usage and popularity of WebSockets are increasing by the day, we can expect the debug tools to increase in number and become more advanced.


