

Yes, we're now running our only Summer Sale. All Courses are 30% off until 20th July, 2026:
Learn through the super-clean Baeldung Pro experience:
>> Membership and Baeldung Pro.
No ads, dark-mode and 6 months free of IntelliJ Idea Ultimate to start with.
1. Introduction
Capturing the network traffic of a process is an important task for system administrators and developers who need to monitor and analyze the information to identify security vulnerabilities or diagnose performance issues. Network traffic refers to the data transmitted over a network. Capturing such data for a specific process can help identify which network connections are being used, how much data is being transmitted, and what type of data is being sent or received by that particular process.
In this tutorial, we’ll explore various ways to capture the network traffic of a process in Linux.
2. Creating the Network Process
For a better comparison, we’ll use the same process across all examples. So, we’ll keep a process running in the background.
Thus, we’ll use wget to download a file from the Internet:
$ wget --limit-rate=5K https://speed.hetzner.de/1GB.bin > /dev/null 2>&1 &
 [2] 46022
Here, to keep running the process for a while, we decreased our download rate to 5KB/S. Moreover, we used > /dev/null 2>&1 & at the end of our command to background the process. Afterward, we can see the process ID (PID) 46022 in the result.
wget supports the HTTP, HTTPS, and FTP protocols. In this case, we used HTTPS in our URL, so we expect our protocol to be HTTPS and our external port to be 443.
3. Using strace
strace is a command-line tool that we can use to trace system calls and signals of a process. We can use strace to capture network-related system calls made by a single process.
First, let’s install strace via yum:
$ yum install -y straceNow, we can start our tracing:
$ strace -p 46022 -e trace=network
strace: Process 46022 attached
restart_syscall(<... resuming interrupted read ...>) = 0
ioctl(0, TIOCGPGRP, [46022])            = 0
getpgrp()                               = 46022
write(2, "\r", 1)                       = 1
ioctl(0, TIOCGPGRP, [46022])            = 0
getpgrp()                               = 46022
write(2, "1GB.bin                 4%[     "..., 84) = 84
clock_nanosleep(CLOCK_REALTIME, 0, {tv_sec=0, tv_nsec=986873000}, NULL) = 0
ioctl(0, TIOCGPGRP, [46022])            = 0
getpgrp()                               = 46022
write(2, "\r", 1)                       = 1
ioctl(0, TIOCGPGRP, [46022])            = 0
getpgrp()                               = 46022
...
In this case, we used the -p option to specify the PID of the process to trace. Moreover, we used -e to determine the type of system calls. The output displays a list of system calls made by the process, such as restart_syscall, ioctl, getpgrp, write, and clock_nanosleep.
These system calls provide information about the process’s network activities, including data read and written to sockets, network interface configuration, and other relevant network-related events.
4. Using lurk
By using lurk, we can trace system calls of a process in a colorized and formatted output.
First, we download lurk via curl:
$ curl -L -o /tmp/lurk.tar.gz "https://github.com/JakWai01/lurk/releases/latest/download/lurk-x86_64-unknown-linux-gnu.tar.gz"Then, we’ll extract the downloaded file via tar:
$ tar -xzf /tmp/lurk.tar.gzNow, we can start our capturing process:
$ lurk -p 46022
[46022] clock_nanosleep(0, 0, 0x5e6c5e20, NULL) = -516
[46022] restart_syscall(NULL) = 0
[46022] ioctl(0, 21519, 0x5e6c5dc4) = 0
[46022] getpgrp(NULL) = 0xb3c6
[46022] write(2, "\r", 1) = 1
[46022] ioctl(0, 21519, 0x5e6c5dc4) = 0
[46022] getpgrp(NULL) = 0xb3c6
[46022] write(2, "1GB.bin 4%[ "..., 84) = 84
[46022] write(4, "", 1024) = 1024
[46022] fcntl(3, 3) = 2
[46022] fcntl(3, 4) = 0
...
In this example, we used -p to attach the process. The result of lurk is the same as strace, but colorized and formatted.
5. Using netstat
netstat is a tool that displays network-related information, such as network connections and routing tables. We can also use netstat to display network connections of a specific process.
netstat is part of the net-tools package. Let’s install the package first:
$ yum install -y net-toolsThen, we can check the connection of our process:
$ netstat -taucp | grep 46022
tcp     3345      1448 localhost.localdo:46940 nbg1-speed.hetzne:https ESTABLISHED 46022/wget
tcp     3345      7242 localhost.localdo:46940 nbg1-speed.hetzne:https ESTABLISHED 46022/wget
tcp     4452      1448 localhost.localdo:46940 nbg1-speed.hetzne:https ESTABLISHED 46022/wget
tcp     4452      1237 localhost.localdo:46940 nbg1-speed.hetzne:https ESTABLISHED 46022/wget
In this example, we’ve used several options:
- t – display TCP connections
- a – display information about all connections (both listening and non-listening)
- u – display UDP connections
- c – print every second continuously
- p – display the process ID associated with each connection
Here, we used grep to filter connections associated with PID 46022. From the output, we can see all the connections are ESTABLISHED and that the program is identified as wget. This means that our process is downloading files from the Internet. Moreover, we can see that the protocol is TCP, and the local port numbers are 3345 and 4452. Additionally, 46940 is a dynamically assigned port number used by the remote server to communicate with the local client.
6. Using tcpdump
tcpdump is a command-line tool used to capture network packets. tcpdump can’t capture a single process separately. Hence, we need to find the IP address or port which is used by the process. After that, we can monitor the network traffic by filtering for them.
First, let’s use yum to install ss:
$ yum install -y ssThen, we can find the associated connection by PID:
$ ss -nap | grep 46022
tcp   ESTAB  3886   0     10.211.55.3:45008     88.198.248.254:443    users:(("wget",pid=46022,fd=3))
In this example, we used several options:
- n – show exact bandwidth values
- a – display both listening and non-listening sockets
- p – show process using socket
Finally, we can capture using the destination IP:
$ tcpdump dst 88.198.248.254
dropped privs to tcpdump
tcpdump: verbose output suppressed, use -v[v]... for full protocol decode
listening on enp0s5, link-type EN10MB (Ethernet), snapshot length 262144 bytes
18:19:23.992339 IP centos-linux.shared.45008 > nbg1-speed.hetzner.com.https: Flags [.], ack 1425654930, win 2920, length 0
18:19:23.993213 IP centos-linux.shared.45008 > nbg1-speed.hetzner.com.https: Flags [.], ack 1461, win 2920, length 0
18:19:23.993408 IP centos-linux.shared.45008 > nbg1-speed.hetzner.com.https: Flags [.], ack 2921, win 2920, length 0
18:19:23.993907 IP centos-linux.shared.45008 > nbg1-speed.hetzner.com.https: Flags [.], ack 5841, win 2920, length 0
18:19:23.994360 IP centos-linux.shared.45008 > nbg1-speed.hetzner.com.https: Flags [.], ack 8761, win 2920, length 0
18:19:23.994857 IP centos-linux.shared.45008 > nbg1-speed.hetzner.com.https: Flags [.], ack 11681, win 2920, length 0
18:19:23.995268 IP centos-linux.shared.45008 > nbg1-speed.hetzner.com.https: Flags [.], ack 14601, win 2920, length 0
18:19:24.036411 IP centos-linux.shared.45008 > nbg1-speed.hetzner.com.https: Flags [.], ack 17521, win 0, length 0
...
8 packets captured
8 packets received by filter
0 packets dropped by kernel
In this case, we used the dst option to specify our destination IP address. tcpdump is capturing network traffic on interface enp0s5 with a filter of only capturing packets with a destination IP address of 88.198.248.254. Importantly, this might not be enough to isolate the traffic from a single process, but further filtering can help with that.
Each line displays the packet’s source, destination, and various flags such as acknowledgment and window size. The last line indicates that 8 packets were captured, 8 packets were received by the filter, and 0 packets were dropped by the kernel. This suggests that the filtering criteria effectively captured all relevant packets and no packets were lost due to insufficient buffer space.
7. Using Isolated Network Namespace and Wireshark
To achieve our goal, we can also create an isolated network namespace. In it, we run our specified process. Afterward, wireshark or another network tool like tcpdump can be used to capture network traffic.
Notably, this way isn’t available in all kernels.
7.1. Create Network Namespace
Linux network namespace is a Linux kernel feature that allows us to create an isolated virtual environment of the network.
First, we’ll create a network namespace via the ip command:
$ sudo ip netns add myNameSpaceThis network namespace can have its own IP addresses, network interfaces, and routing tables.
7.2. Create Network Namespace Virtual Network Interfaces
We’ll create vEthA and vEthB as our virtual network interfaces:
$ sudo ip link add vEthA type veth peer name vEthBWe used the type option to specify veth (virtual ethernet).
Now, we’ll change the active network namespace of vEthA:
$ sudo ip link set vEthA netns myNameSpaceWe moved vEthA to our network namespace.
7.3. Configuring IP Addresses
Firstly, let’s set up vEthA as a network interface:
$ sudo ip netns exec myNameSpace ifconfig vEthA up 192.168.11.1 netmask 255.255.255.0Here, we’ve assigned an IP address to vEthA.
Secondly, we’ll set up and assign an IP address to vEthB:
$ sudo ifconfig vEthB up 192.168.11.254 netmask 255.255.255.0Thirdly, we’ll configure the gateway IP address in our network namespace:
$ sudo ip netns exec myNameSpace route add default gw 192.168.11.254 dev vEthAIn this case, we’ve set a default gateway 192.168.11.254 for vEthA.
7.4. Configuring Routes
At this point, we ensure ip_forward is active:
$ echo 1 > /proc/sys/net/ipv4/ip_forwardThen, we’ll create a NAT rule with iptables to forward all the traffic of our network namespace to a physical network interface:
$ sudo iptables -t nat -A POSTROUTING -s 192.168.11.0/24 -o enp0s5 -j SNAT --to-source 10.211.55.3Here, enp0s5 is our physical network interface and 10.211.55.3 is our physical device IP.
7.5. Leveraging Isolated Namespace
Now, we can run our process in the network namespace:
$ sudo ip netns exec myNameSpace myprocessThen, we’ll capture the network traffic of our process in wireshark:
$ sudo ip netns exec myNameSpace wiresharkAfterward, we can see the user interface of wireshark:
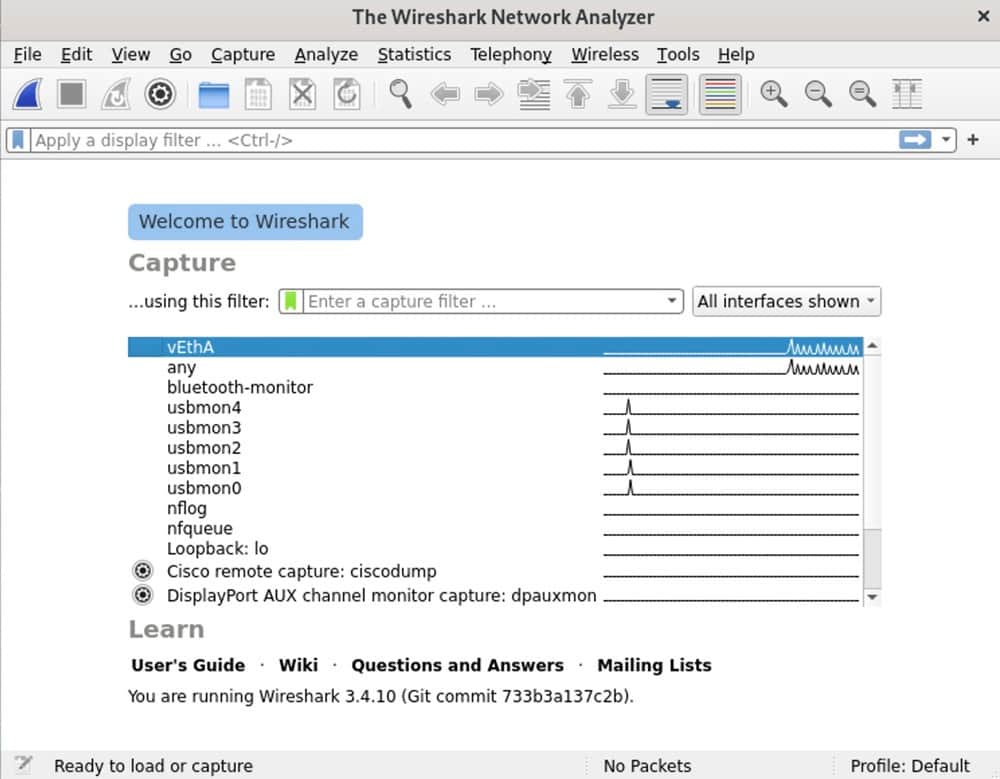
As a result, we can see that vEthA is in our interface list.
Afterward, we’ll select vEthA to check the captured packets details:
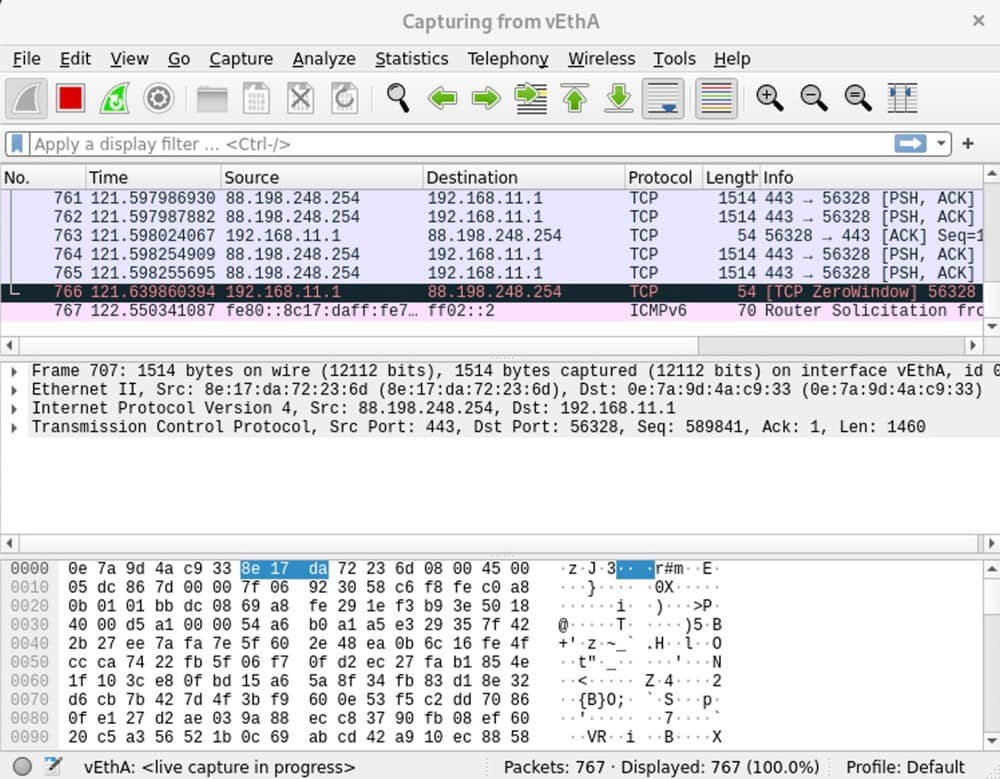
Finally, we are capturing network packets of our process which are isolated in our network namespace. We can see a list of captured packets containing information about the communication between our system and the remote server. Moreover, the TCP protocol is used to transmit the data.
Additionally, each packet displays its source and destination IP addresses and port numbers, along with other header fields that provide information about the packet’s type, size, and timing.
8. Conclusion
In this article, we explored the ways to capture the network traffic of a process in Linux.
We began by discovering how strace and lurk can record the system calls and signals of a process. Next, we delved into netstat, which provides information about network connections. Then, we explored tcpdump, a tool that enables us to capture and analyze network packets. Finally, we discussed utilizing an isolated network namespace and wireshark in our virtual environment.