

Learn through the super-clean Baeldung Pro experience:
>> Membership and Baeldung Pro.
No ads, dark-mode and 6 months free of IntelliJ Idea Ultimate to start with.
Learn through the super-clean Baeldung Pro experience:
>> Membership and Baeldung Pro.
No ads, dark-mode and 6 months free of IntelliJ Idea Ultimate to start with.
In this tutorial, we’ll learn how to compare two algorithms empirically to identify their advantages and disadvantages. We’ll go through different steps in this approach and the metrics we should consider. We’ll also discuss different statistical methodologies to help us identify the best algorithm for a given task.
When we compare two algorithms, just comparing their computational complexity isn’t enough and may not be feasible. Thus, sometimes, we have to make this comparison differently, namely, empirically, which can provide us with more insights into the inner workings of the algorithms and their behavior.
Choosing appropriate performance metrics is critical for accurately evaluating algorithms. These metrics should align with the algorithm’s objectives, operating environment, and hardware constraints. Typical metrics include time and space complexity, hardware utilization, accuracy, precision, recall, and F1 score.
Selecting the wrong metrics can lead to misleading results, even with flawless execution of subsequent steps. Let’s consider an algorithm for ID verifications:
| Comparing Image Recognition Algorithms | ||
|---|---|---|
| Speed | Accuracy | |
| Algorithm A | Fast | Inaccurate |
| Algorithm B | Slow | Accurate |
Suppose we made an incorrect assumption and prioritized the speed of an algorithm. The algorithm we would choose would work faster but produce more incorrect results, which could have dramatic effects. Thus, selecting performance metrics is not just a preliminary step but a foundation of the entire evaluation.
Measurements involve designing tests to check the variations of data. This helps to highlight the differences in the algorithms. Also, by creating good tests, we can capture the edge cases and provide more insights into the performance of an algorithm.
The simplest tests are based on the data’s complexity and size. Let’s design the tests to determine which sorting algorithm performs better under various data conditions:
| Comparative Testing of Quick Sort and Merge Sort | ||
|---|---|---|
| Test | Purpose | Expectation |
| Randomly Ordered Data | Evaluating the average-case performance. | Algorithms should perform well but with different time complexities |
| Partially Sorted Data | Assessing the adaptiveness. | Quick Sort might show better performance due to its adaptive nature. |
| Completely Sorted Data and Reverse-Sorted Data | Testing the worst-case scenario for Quick Sort. | Quick Sort may perform poorly, revealing its vulnerability in specific scenarios. |
| Stochastic Analysis | Assessing the performance under randomness (e.g., random pivot selection in Quick Sort). | To understand the average behavior under stochastic conditions. |
These tests would show the algorithms’ behavior under varying conditions and reveal their weaknesses and strengths in specific scenarios. Additionally, the tests would provide a more holistic view than just comparing the asymptotic time complexities, which might lead to incorrect results. This would help to select the correct algorithm based on the typical data conditions it will encounter.
The number of tests and their types should be based on our goals and the nature of the algorithms. Thus, all the tests should be picked and designed explicitly for each case.
In the data collection step, focus on methods of capturing, storing, and refining data. Let’s consider a recommendation algorithm for suggesting movies and shows. In this step, we can consider the following information:
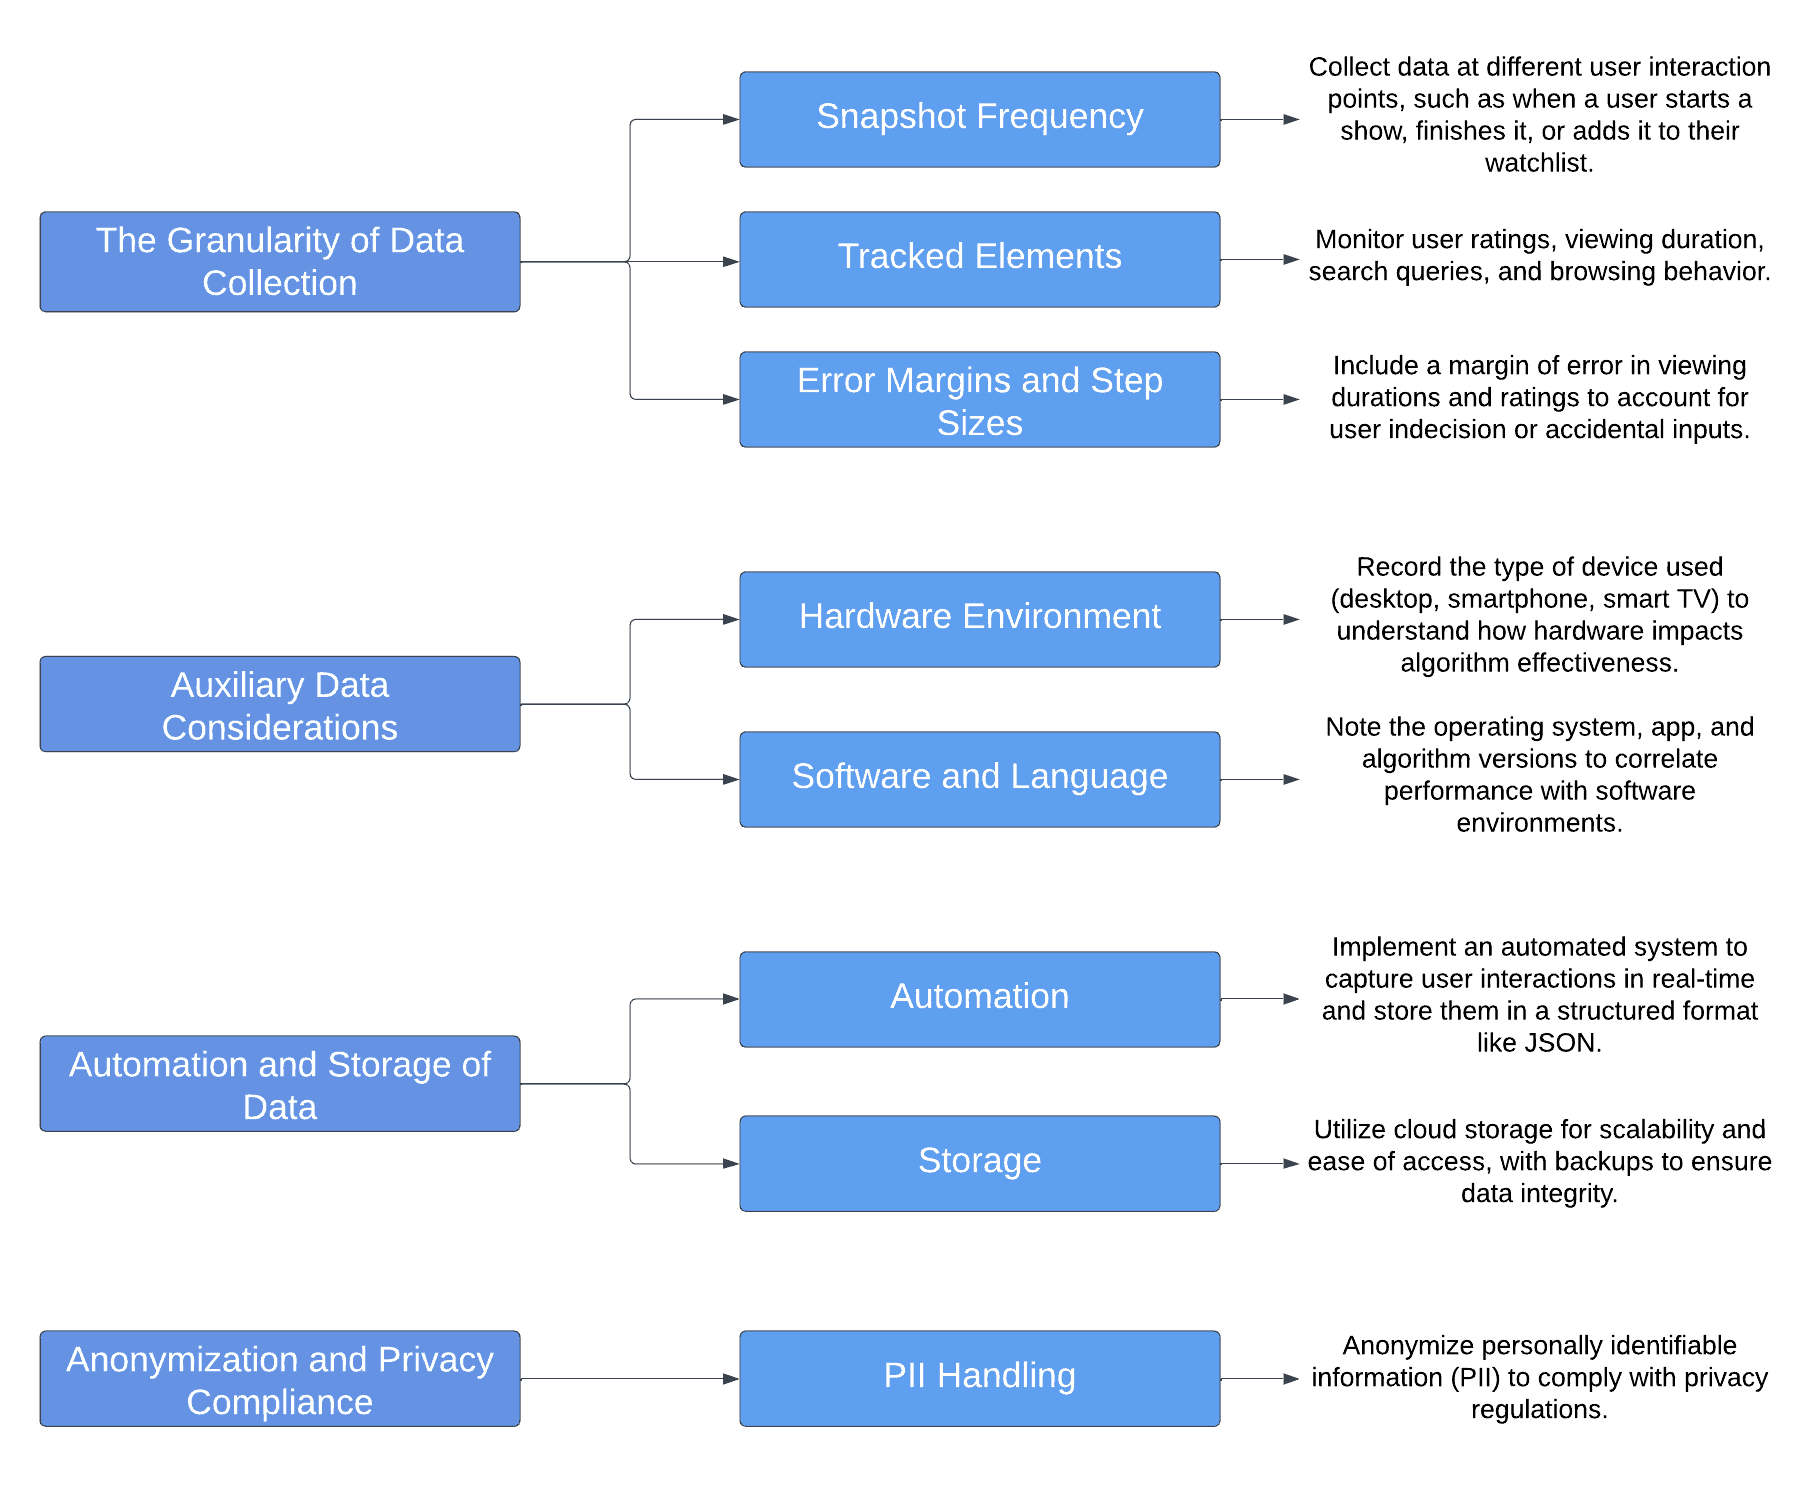
The evaluation can more accurately determine the algorithm’s effectiveness by capturing a wide range of data points. At the same time, by picking only important information, we won’t bog down with massive datasets that would be hard to analyze. Also, understanding how different environments affect performance helps optimize the algorithm for user conditions. Additionally, ensuring anonymization and privacy compliance is crucial for ethical algorithm development, particularly in user-centric services.
Data analysis involves selecting appropriate statistical methods to extract insights about algorithm performance. The choice of methods, such as descriptive statistics or regression analysis, depends on the algorithm’s purpose and the nature of the data:
After getting all the information, we can analyze the data. This step doesn’t have any restrictions regarding methods we can use. Still, we should pick the most reasonable statistical tests that would provide us with more information about the researched algorithms:
| Algorithm | Objective | Analytical Approach | Example Metrics |
|---|---|---|---|
| File Compression | Compare the speed and efficiency. | Descriptive statistics that summarize key performance metrics such as compression ratio, time taken to compress, and decompression speed. | Average compression ratio, standard deviation of compression time, and range of decompression speeds across different file types. |
| Sorting Algorithms | Identifying the best-performing algorithm on various data. | Comparative tests (like ANOVA or t-tests) to check for statistically significant differences in performance. | Mean sorting time for large datasets, variance in performance for different data states (random, partially sorted, reverse sorted). |
| Machine Learning Algorithms for Price Prediction | Evaluating the accuracy of machine learning models. | Regression analysis to assess the predictive accuracy of different models. | R-squared values for different models, comparison of predicted versus actual prices, and error distribution. |
| Time Series Analysis for Stock Price Prediction | Analyzing the performance in predicting stock market trends. | Implementing time series analysis methods, such as ARIMA or LSTM neural networks, to evaluate prediction accuracy over time. | Root mean square error (RMSE) of predictions, comparative analysis of predicted and actual stock prices over different time frames. |
This step is crucial for ensuring analysis validity and making equitable comparisons between algorithms. Choosing the proper statistical method ensures the validity and reliability of the analysis.
Also, employing the right analytical tools helps make fair and effective comparisons between algorithms, highlighting their strengths and weaknesses in various scenarios. Different algorithms require analysis methods specific to their function and application to derive meaningful insights.
Documentation is more than just collecting data. It’s about interpreting it carefully according to the goals and standards. This phase goes beyond simply gathering numbers. The aim is to turn these numbers into meaningful information.
During this stage, we must examine how the algorithm works, focusing on its effectiveness, accuracy, and performance in different situations. The analysis looks at more than just data. It tries to understand how the algorithm behaves in various real-world scenarios.
This step is critical in turning data into valuable insights. It shows what each algorithm does well and where it struggles, giving a clear picture of its performance. This detailed analysis helps improve the algorithms and decide how to use them best. It helps in choosing the suitable algorithm for the right job.
The documentation serves as a blueprint, allowing other researchers to replicate the study under similar conditions, verifying and building upon the findings. This emphasis on replicability is crucial to the reliability of the research, enhancing its value and ensuring that the conclusions can be confidently applied in similar contexts.
The reporting serves as a crucial bridge between the technical depths of the research and its broader applications. The detailed findings in the research process should be distilled into an accessible and coherent narrative. The aim is to communicate the results to a diverse audience that includes stakeholders, policymakers, and potentially interested members of the general public.
The report’s content is less about the granular details of the research and more about its results and significance. It typically includes a summary of the research objectives, a high-level overview of the methodologies used, and a focused presentation of the key findings. Charts, graphs, and infographics are often used to present data in a visually engaging and easily digestible format.
Notably, the report discusses the practical implications of these findings, offering insights into how the research might inform future technology development, policy decisions, or other applications. The report also highlights any limitations or caveats in the research, ensuring a balanced and realistic interpretation of the results. The report’s conclusion often suggests areas for future research, acknowledging that technology and methodologies continually evolve.
In this article, we explored how to empirically compare two algorithms, looking beyond computational complexity to understand their real-world performance. Key steps included choosing relevant performance metrics, designing targeted tests, and collecting comprehensive data.
The empirical approach provides a comprehensive understanding of an algorithm’s performance in practical scenarios, helping select the most suitable algorithm for specific tasks. The process enhances the reliability of research and informs future technological developments and policy decisions.