

Yes, we're now running our only Summer Sale. All Courses are 30% off until 20th July, 2026:
Learn through the super-clean Baeldung Pro experience:
>> Membership and Baeldung Pro.
No ads, dark-mode and 6 months free of IntelliJ Idea Ultimate to start with.
1. Introduction
Autoregressive models play a major role in time series examination because they offer a solid method for understanding and forecasting sequential data. Autoregressive models capture a variable’s intrinsic dependence on its historical values, emulating the common sense idea that the past shapes the present.
In this tutorial, we’ll delve into the theory, applications, and practical concerns of autoregressive models, from understanding the fundamental concepts behind autoregression to navigating the complexities of estimation of parameters and model validation.
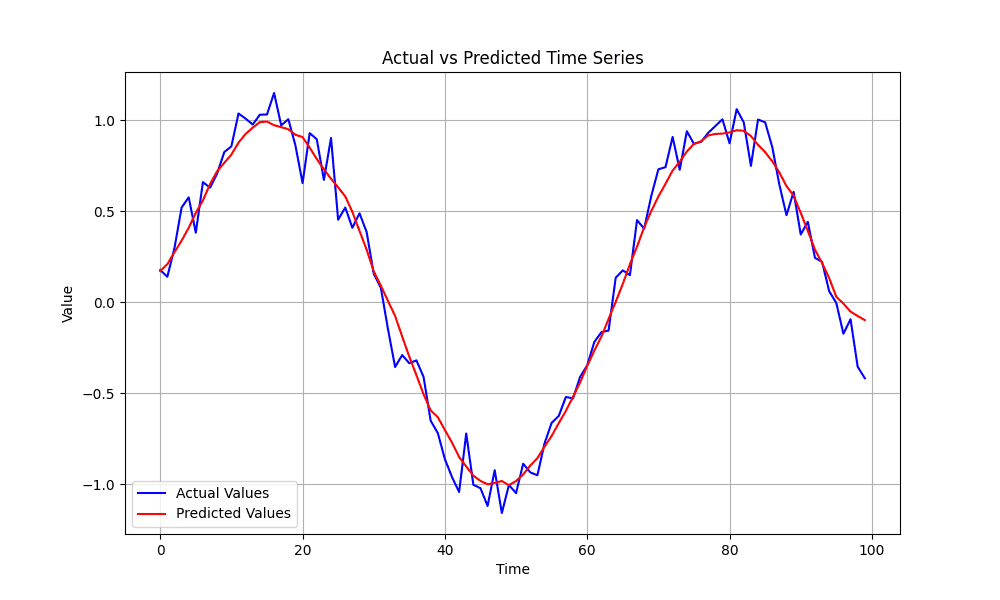
2. The Autoregressive Model
Autoregression originated with Yule‘s (1927) pioneering work, followed by Box and Jenkins‘ (1970) important contributions to creating ARIMA models. Since then, autoregressive models have expanded and varied, including different extensions and modifications to accommodate the complexity of real-world data.
At its heart, an autoregressive model forecasts a variable’s future value based on its previous values, assuming that these past values consist of useful prediction characteristics. This predictive technique is consistent with the fundamental concept of temporal consistency, which holds that patterns observed in the past are expected to remain in the future, yet given some uncertainty.
Autoregressive models give a systematic technique for modeling the temporal dynamics found in time series data, which is ordered historically. They are widely used in a variety of industries, including finance, economics, meteorology, and engineering.
3. Mathematical Approach
At its essence, an autoregressive model of order  , denoted as
  , expresses the current value
  of a variable
  , as a linear combination of its past values, while taking into consideration a certain error
  :
:

In the equation above,  denote the weights of the past values
  respectively. Also,
  represents the error term at the time
  .
.
The autoregressive model’s order specifies how many lagged terms are included. Higher order captures more complicated temporal connections, but it also raises the model’s complexity and presents a risk of overfitting.
Moreover,  parameters are often calculated from available data using a variety of estimation approaches, including Ordinary Least Squares (OLS) and Maximum Likelihood Estimation (MLE). These estimate approaches strive to identify parameter values that minimize the difference between actual values and model predictions:
A crucial aspect of an autoregressive models is the stationarity, which implies that the statistical aspects of the time series stay constant throughout time. This characteristic can be tested via statistical tests or visual inspection of the data.
4. Parameter Estimation
Autoregressive models are based on various assumptions and constraints to assure their validity and efficacy in capturing temporal interdependence in time series data. If these requirements are not met, estimations may be skewed, projections may be inaccurate, or conclusions may be incorrect.
Through verification of the criteria and underlying assumptions, we may construct robust autoregressive models that accurately represent the dynamics seen in time series data.
4.1. Stationary
Stationary means that its probabilistic features, such as mean, variance, and autocovariance, are constant throughout time. If the data shows patterns or seasonality, techniques like differencing can be used to create stationarity.
4.2. Linearity
Autoregressive models are based on the premise of linearity, which means that linear equations may effectively represent the connection between a variable’s current value and its previous values.
4.3. Independence
Autoregressive models presume that the error terms (residuals) are independently and identically distributed (i.i.d.). This assumption guarantees that the residuals show no regular trends or correlations, suggesting that the model has captured all accessible facts within the data. Breach of this hypothesis may imply inaccurate model description or absence of variables.
4.4.
When there is enough data, autoregressive models work well, especially when computing features for models with greater orders. Additional information is available for parameter estimation and validation with a larger sample size, which lowers the possibility of overfitting and enhances the prediction ability of the model.
5. Parameter Estimation
Parameter estimation is a crucial phase in creating autoregressive models, in which the values of the model parameters that most effectively suit the observed data are determined.
5.1.
Ordinary Least Squares (OLS) is one of the most used methods for determining an autoregressive model’s parameters. Mathematically, this technique focuses on minimizing the sum of squared differences between the predicted and the observed values.
Although this approach is simple and computationally effective, it might be susceptible to the phenomenon of heteros and outliers.
5.2. Maximum Likelihood Estimation
Maximum Likelihood Estimation (MLE) is another technique widely used for parameter estimation, mostly in cases in which the error term follows a certain probability distribution, such as the Gaussian distribution. MLE provides resilience against heteroscedasticity and non-normality, although it may require more computer power.
5.3. Method of Moments
The moments’ approach is a traditional estimate technique that compares the sample characteristics of the data (such as the mean and variance) to their theoretical equivalents obtained from the autoregressive model. The model’s parameters may be calculated using the solution of these moment equations.
5.4. Robust Estimation Methods
Robust estimation approaches like robust regression or M-estimation may be used when the data contradicts the assumptions of conventional estimation methods. In the event of data anomalies, these techniques can yield more accurate parameter estimations and are less susceptible to extreme findings.
5.5. Cross-Validation
Cross-validation is a widely used method in machine learning. Cross-validation yields an unbiased evaluation of the model’s capacity to generalize to new data by dividing the data into training and validation sets and fitting the model repeatedly on various subsets.
6. Model Selection and Validation
To ensure that the chosen model effectively represents the underlying temporal relationships in the data and generalizes well to unseen observations, model selection and validation are crucial processes.
6.1. Order Selection
The number of historical values of the variable included in the model is represented by the order of an autoregressive model . It is essential to find the optimal sequence in order to achieve a balance between prediction accuracy and model complexity.
First, we can use the Akaike Information Criterion (AIC). AIC penalizes the model’s complexity to avoid overfitting, providing a trade-off between model fit and complexity.
On the other hand, we can use the Bayesian Information Criterion (BIC). Similar to AIC, BIC penalizes model complexity but imposes a stronger penalty for additional parameters, favoring simpler models.
Finally, we can use cross-validation techniques, such as k-fold cross-validation or time series cross-validation, to partition the data into training and validation sets to evaluate the model’s performance for different orders.
6.2. Model Validation
Validating the autoregressive model is crucial to ensuring its generalizability and dependability after the model’s order has been chosen.
- a small amount of the data is utilized for training the model, while another holdout set that was not used for training is used for evaluating it
- Residual Analysis – A model’s sufficiency is evaluated by looking at residuals, which are the distance between the observed values and the values predicted by the model. Diagnostic graphs, such as residual histograms or correlation plots, can be employed for identifying trends or systematic mistakes in the residuals
- Forecast Evaluation – The accuracy of the forecasts may be measured using metrics like Mean Absolute Error (MAE), Mean Squared Error (MSE), or forecast skill ratings
7. Practical Applications
Autoregressive models are used in various fields, including financial forecasting, weather prediction, signal processing, and economic forecasting.
Financial analysts and economists use ARIMA models to forecast stock prices or inflation rates based on past performance, while meteorologists use ARIMA models to forecast weather conditions.
Signal processing applications use ARIMA models to filter noise, extract meaningful features, and enhance signal quality.
Engineers use AR models to analyze ECG signals for early diagnosis of heart rhythm abnormalities.
8. Main Challenges
Autoregressive models are useful for analyzing time series data but may come with several challenges.
A common issue may arise due to the assumption of stationary time series, leading to biased parameter estimates and unreliable forecasts. Also, as the model captures more temporal dependencies, the complexity increases, and the model becomes more sensitive to overfitting.
Moreover, outliers and anomalies in data must be carefully considered as they may affect performance. Therefore, high-quality data with minimal missing values and consistent temporal resolution is required for accurate model estimation and prediction.
Another drawback may occur with the assumption of linearity that may not be adequate for real-world data, necessitating nonlinear autoregressive models or machine learning techniques.
9. Conclusion
In this article, we discussed models that are vital tools for studying time series data and generating predictions in various fields, including finance, economics, meteorology, and signal processing. Despite their usefulness, their challenges must be considered and addressed to produce trustworthy findings and significant insights.