

Mocking is an essential part of unit testing, and the Mockito library makes it easy to write clean and intuitive unit tests for your Java code.
Get started with mocking and improve your application tests using our Mockito guide:
Handling concurrency in an application can be a tricky process with many potential pitfalls. A solid grasp of the fundamentals will go a long way to help minimize these issues.
Get started with understanding multi-threaded applications with our Java Concurrency guide:
Spring 5 added support for reactive programming with the Spring WebFlux module, which has been improved upon ever since. Get started with the Reactor project basics and reactive programming in Spring Boot:
Since its introduction in Java 8, the Stream API has become a staple of Java development. The basic operations like iterating, filtering, mapping sequences of elements are deceptively simple to use.
But these can also be overused and fall into some common pitfalls.
To get a better understanding on how Streams work and how to combine them with other language features, check out our guide to Java Streams:
Explore Spring Boot 3 and Spring 6 in-depth through building a full REST API with the framework:
Yes, Spring Security can be complex, from the more advanced functionality within the Core to the deep OAuth support in the framework.
I built the security material as two full courses - Core and OAuth, to get practical with these more complex scenarios. We explore when and how to use each feature and code through it on the backing project.
You can explore the course here:
Spring Data JPA is a great way to handle the complexity of JPA with the powerful simplicity of Spring Boot.
Get started with Spring Data JPA through the guided reference course:
Refactor Java code safely — and automatically — with OpenRewrite.
Refactoring big codebases by hand is slow, risky, and easy to put off. That’s where OpenRewrite comes in. The open-source framework for large-scale, automated code transformations helps teams modernize safely and consistently.
Each month, the creators and maintainers of OpenRewrite at Moderne run live, hands-on training sessions — one for newcomers and one for experienced users. You’ll see how recipes work, how to apply them across projects, and how to modernize code with confidence.
Join the next session, bring your questions, and learn how to automate the kind of work that usually eats your sprint time.
1. Overview
Clustering is an umbrella term for a class of unsupervised algorithms to discover groups of things, people, or ideas that are closely related to each other.
In this apparently simple one-liner definition, we saw a few buzzwords. What exactly is clustering? What is an unsupervised algorithm?
In this tutorial, we’re going to, first, shed some lights on these concepts. Then, we’ll see how they can manifest themselves in Java.
2. Unsupervised Algorithms
Before we use most learning algorithms, we should somehow feed some sample data to them and allow the algorithm to learn from those data. In Machine Learning terminology, we call that sample dataset training data. Also, the whole process is known as the training process.
Anyway, we can classify learning algorithms based on the amount of supervision they need during the training process. The two main types of learning algorithms in this category are:
- Supervised Learning: In supervised algorithms, the training data should include the actual solution for each point. For example, if we’re about to train our spam filtering algorithm, we feed both the sample emails and their label, i.e. spam or not-spam, to the algorithm. Mathematically speaking, we’re going to infer the f(x) from a training set including both xs and ys.
- Unsupervised Learning: When there are no labels in training data, then the algorithm is an unsupervised one. For example, we have plenty of data about musicians and we’re going discover groups of similar musicians in the data.
3. Clustering
Clustering is an unsupervised algorithm to discover groups of similar things, ideas, or people. Unlike supervised algorithms, we’re not training clustering algorithms with examples of known labels. Instead, clustering tries to find structures within a training set where no point of the data is the label.
3.1. K-Means Clustering
K-Means is a clustering algorithm with one fundamental property: the number of clusters is defined in advance. In addition to K-Means, there are other types of clustering algorithms like Hierarchical Clustering, Affinity Propagation, or Spectral Clustering.
3.2. How K-Means Works
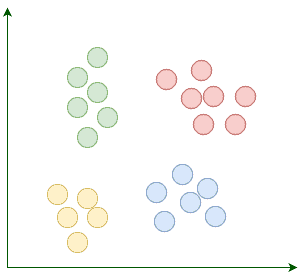
Suppose our goal is to find a few similar groups in a dataset like:
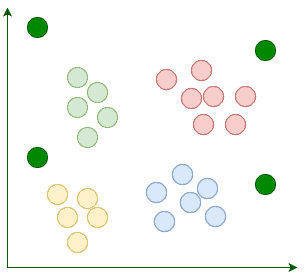
K-Means begins with k randomly placed centroids. Centroids, as their name suggests, are the center points of the clusters. For example, here we’re adding four random centroids:
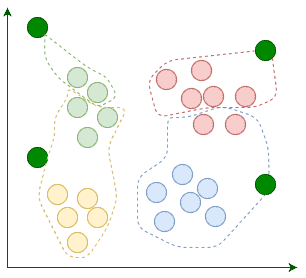
Then we assign each existing data point to its nearest centroid:
After the assignment, we move the centroids to the average location of points assigned to it. Remember, centroids are supposed to be the center points of clusters:
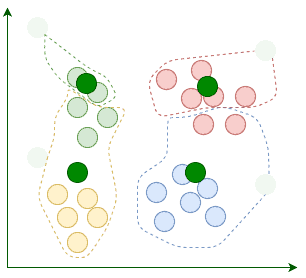
The current iteration concludes each time we’re done relocating the centroids. We repeat these iterations until the assignment between multiple consecutive iterations stops changing:
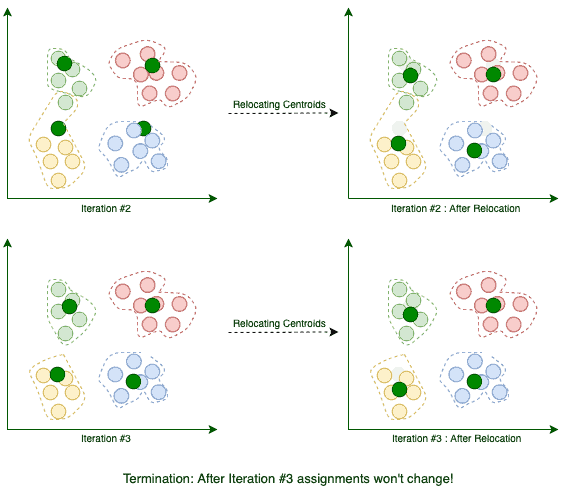
When the algorithm terminates, those four clusters are found as expected. Now that we know how K-Means works, let’s implement it in Java.
3.3. Feature Representation
When modeling different training datasets, we need a data structure to represent model attributes and their corresponding values. For example, a musician can have a genre attribute with a value like Rock. We usually use the term feature to refer to the combination of an attribute and its value.
To prepare a dataset for a particular learning algorithm, we usually use a common set of numerical attributes that can be used to compare different items. For example, if we let our users tag each artist with a genre, then at the end of the day, we can count how many times each artist is tagged with a specific genre:
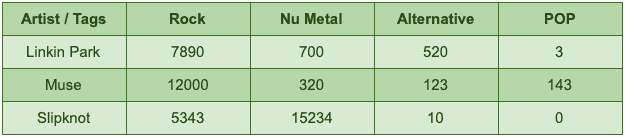
The feature vector for an artist like Linkin Park is [rock -> 7890, nu-metal -> 700, alternative -> 520, pop -> 3]. So if we could find a way to represent attributes as numerical values, then we can simply compare two different items, e.g. artists, by comparing their corresponding vector entries.
Since numeric vectors are such versatile data structures, we’re going to represent features using them. Here’s how we implement feature vectors in Java:
public class Record {
    private final String description;
    private final Map<String, Double> features;

    // constructor, getter, toString, equals and hashcode
}
3.4. Finding Similar Items
In each iteration of K-Means, we need a way to find the nearest centroid to each item in the dataset. One of the simplest ways to calculate the distance between two feature vectors is to use Euclidean Distance. The Euclidean distance between two vectors like [p1, q1] and [p2, q2] is equal to:
Let’s implement this function in Java. First, the abstraction:
public interface Distance {
    double calculate(Map<String, Double> f1, Map<String, Double> f2);
}
In addition to Euclidean distance, there are other approaches to compute the distance or similarity between different items like the Pearson Correlation Coefficient. This abstraction makes it easy to switch between different distance metrics.
Let’s see the implementation for Euclidean distance:
public class EuclideanDistance implements Distance {

    @Override
    public double calculate(Map<String, Double> f1, Map<String, Double> f2) {
        double sum = 0;
        for (String key : f1.keySet()) {
            Double v1 = f1.get(key);
            Double v2 = f2.get(key);

            if (v1 != null && v2 != null) {
                sum += Math.pow(v1 - v2, 2);
            }
        }

        return Math.sqrt(sum);
    }
}
First, we calculate the sum of squared differences between corresponding entries. Then, by applying the sqrt function, we compute the actual Euclidean distance.
3.5. Centroid Representation
Centroids are in the same space as normal features, so we can represent them similar to features:
public class Centroid {

    private final Map<String, Double> coordinates;

    // constructors, getter, toString, equals and hashcode
}
Now that we have a few necessary abstractions in place, it’s time to write our K-Means implementation. Here’s a quick look at our method signature:
public class KMeans {

    private static final Random random = new Random();

    public static Map<Centroid, List<Record>> fit(List<Record> records,
      int k,
      Distance distance,
      int maxIterations) {
        // omitted
    }
}
Let’s break down this method signature:
- The dataset is a set of feature vectors. Since each feature vector is a Record, then the dataset type is List<Record>
- The k parameter determines the number of clusters, which we should provide in advance
- distance encapsulates the way we’re going to calculate the difference between two features
- K-Means terminates when the assignment stops changing for a few consecutive iterations. In addition to this termination condition, we can place an upper bound for the number of iterations, too. The maxIterations argument determines that upper bound
- When K-Means terminates, each centroid should have a few assigned features, hence we’re using a Map<Centroid, List<Record>> as the return type. Basically, each map entry corresponds to a cluster
3.6. Centroid Generation
The first step is to generate k randomly placed centroids.
Although each centroid can contain totally random coordinates, it’s a good practice to generate random coordinates between the minimum and maximum possible values for each attribute. Generating random centroids without considering the range of possible values would cause the algorithm to converge more slowly.
First, we should compute the minimum and maximum value for each attribute, and then, generate the random values between each pair of them:
private static List<Centroid> randomCentroids(List<Record> records, int k) {
    List<Centroid> centroids = new ArrayList<>();
    Map<String, Double> maxs = new HashMap<>();
    Map<String, Double> mins = new HashMap<>();

    for (Record record : records) {
        record.getFeatures().forEach((key, value) -> {
            // compares the value with the current max and choose the bigger value between them
            maxs.compute(key, (k1, max) -> max == null || value > max ? value : max);

            // compare the value with the current min and choose the smaller value between them
            mins.compute(key, (k1, min) -> min == null || value < min ? value : min);
        });
    }

    Set<String> attributes = records.stream()
      .flatMap(e -> e.getFeatures().keySet().stream())
      .collect(toSet());
    for (int i = 0; i < k; i++) {
        Map<String, Double> coordinates = new HashMap<>();
        for (String attribute : attributes) {
            double max = maxs.get(attribute);
            double min = mins.get(attribute);
            coordinates.put(attribute, random.nextDouble() * (max - min) + min);
        }

        centroids.add(new Centroid(coordinates));
    }

    return centroids;
}
Now, we can assign each record to one of these random centroids.
3.7. Assignment
First off, given a Record, we should find the centroid nearest to it:
private static Centroid nearestCentroid(Record record, List<Centroid> centroids, Distance distance) {
    double minimumDistance = Double.MAX_VALUE;
    Centroid nearest = null;

    for (Centroid centroid : centroids) {
        double currentDistance = distance.calculate(record.getFeatures(), centroid.getCoordinates());

        if (currentDistance < minimumDistance) {
            minimumDistance = currentDistance;
            nearest = centroid;
        }
    }

    return nearest;
}
Each record belongs to its nearest centroid cluster:
private static void assignToCluster(Map<Centroid, List<Record>> clusters,
  Record record,
  Centroid centroid) {
    clusters.compute(centroid, (key, list) -> {
        if (list == null) {
            list = new ArrayList<>();
        }

        list.add(record);
        return list;
    });
}
3.8. Centroid Relocation
If, after one iteration, a centroid does not contain any assignments, then we won’t relocate it. Otherwise, we should relocate the centroid coordinate for each attribute to the average location of all assigned records:
private static Centroid average(Centroid centroid, List<Record> records) {
    if (records == null || records.isEmpty()) {
        return centroid;
    }

    Map<String, Double> average = centroid.getCoordinates();
    records.stream().flatMap(e -> e.getFeatures().keySet().stream())
      .forEach(k -> average.put(k, 0.0));

    for (Record record : records) {
        record.getFeatures().forEach(
          (k, v) -> average.compute(k, (k1, currentValue) -> v + currentValue)
        );
    }

    average.forEach((k, v) -> average.put(k, v / records.size()));

    return new Centroid(average);
}
Since we can relocate a single centroid, now it’s possible to implement the relocateCentroids method:
private static List<Centroid> relocateCentroids(Map<Centroid, List<Record>> clusters) {
    return clusters.entrySet().stream().map(e -> average(e.getKey(), e.getValue())).collect(toList());
}
This simple one-liner iterates through all centroids, relocates them, and returns the new centroids.
3.9. Putting It All Together
In each iteration, after assigning all records to their nearest centroid, first, we should compare the current assignments with the last iteration.
If the assignments were identical, then the algorithm terminates. Otherwise, before jumping to the next iteration, we should relocate the centroids:
public static Map<Centroid, List<Record>> fit(List<Record> records,
  int k,
  Distance distance,
  int maxIterations) {

    List<Centroid> centroids = randomCentroids(records, k);
    Map<Centroid, List<Record>> clusters = new HashMap<>();
    Map<Centroid, List<Record>> lastState = new HashMap<>();

    // iterate for a pre-defined number of times
    for (int i = 0; i < maxIterations; i++) {
        boolean isLastIteration = i == maxIterations - 1;

        // in each iteration we should find the nearest centroid for each record
        for (Record record : records) {
            Centroid centroid = nearestCentroid(record, centroids, distance);
            assignToCluster(clusters, record, centroid);
        }

        // if the assignments do not change, then the algorithm terminates
        boolean shouldTerminate = isLastIteration || clusters.equals(lastState);
        lastState = clusters;
        if (shouldTerminate) {
            break;
        }

        // at the end of each iteration we should relocate the centroids
        centroids = relocateCentroids(clusters);
        clusters = new HashMap<>();
    }

    return lastState;
}
4. Example: Discovering Similar Artists on Last.fm
Last.fm builds a detailed profile of each user’s musical taste by recording details of what the user listens to. In this section, we’re going to find clusters of similar artists. To build a dataset appropriate for this task, we’ll use three APIs from Last.fm:
- API to get a collection of top artists on Last.fm.
- Another API to find popular tags. Each user can tag an artist with something, e.g. rock. So, Last.fm maintains a database of those tags and their frequencies.
- And an API to get the top tags for an artist, ordered by popularity. Since there are many such tags, we’ll only keep those tags that are among the top global tags.
4.1. Last.fm’s API
To use these APIs, we should get an API Key from Last.fm and send it in every HTTP request. We’re going to use the following Retrofit service for calling those APIs:
public interface LastFmService {

    @GET("/2.0/?method=chart.gettopartists&format=json&limit=50")
    Call<Artists> topArtists(@Query("page") int page);

    @GET("/2.0/?method=artist.gettoptags&format=json&limit=20&autocorrect=1")
    Call<Tags> topTagsFor(@Query("artist") String artist);

    @GET("/2.0/?method=chart.gettoptags&format=json&limit=100")
    Call<TopTags> topTags();

    // A few DTOs and one interceptor
}
So, let’s find the most popular artists on Last.fm:
// setting up the Retrofit service

private static List<String> getTop100Artists() throws IOException {
    List<String> artists = new ArrayList<>();
    // Fetching the first two pages, each containing 50 records.
    for (int i = 1; i <= 2; i++) {
        artists.addAll(lastFm.topArtists(i).execute().body().all());
    }

    return artists;
}
Similarly, we can fetch the top tags:
private static Set<String> getTop100Tags() throws IOException {
    return lastFm.topTags().execute().body().all();
}
Finally, we can build a dataset of artists along with their tag frequencies:
private static List<Record> datasetWithTaggedArtists(List<String> artists,
  Set<String> topTags) throws IOException {
    List<Record> records = new ArrayList<>();
    for (String artist : artists) {
        Map<String, Double> tags = lastFm.topTagsFor(artist).execute().body().all();

        // Only keep popular tags.
        tags.entrySet().removeIf(e -> !topTags.contains(e.getKey()));

        records.add(new Record(artist, tags));
    }

    return records;
}
4.2. Forming Artist Clusters
Now, we can feed the prepared dataset to our K-Means implementation:
List<String> artists = getTop100Artists();
Set<String> topTags = getTop100Tags();
List<Record> records = datasetWithTaggedArtists(artists, topTags);

Map<Centroid, List<Record>> clusters = KMeans.fit(records, 7, new EuclideanDistance(), 1000);
// Printing the cluster configuration
clusters.forEach((key, value) -> {
    System.out.println("-------------------------- CLUSTER ----------------------------");

    // Sorting the coordinates to see the most significant tags first.
    System.out.println(sortedCentroid(key));
    String members = String.join(", ", value.stream().map(Record::getDescription).collect(toSet()));
    System.out.print(members);

    System.out.println();
    System.out.println();
});
If we run this code, then it would visualize the clusters as text output:
------------------------------ CLUSTER -----------------------------------
Centroid {classic rock=65.58333333333333, rock=64.41666666666667, british=20.333333333333332, ... }
David Bowie, Led Zeppelin, Pink Floyd, System of a Down, Queen, blink-182, The Rolling Stones, Metallica,
Fleetwood Mac, The Beatles, Elton John, The Clash

------------------------------ CLUSTER -----------------------------------
Centroid {Hip-Hop=97.21428571428571, rap=64.85714285714286, hip hop=29.285714285714285, ... }
Kanye West, Post Malone, Childish Gambino, Lil Nas X, A$AP Rocky, Lizzo, xxxtentacion,
Travi$ Scott, Tyler, the Creator, Eminem, Frank Ocean, Kendrick Lamar, Nicki Minaj, Drake

------------------------------ CLUSTER -----------------------------------
Centroid {indie rock=54.0, rock=52.0, Psychedelic Rock=51.0, psychedelic=47.0, ... }
Tame Impala, The Black Keys

------------------------------ CLUSTER -----------------------------------
Centroid {pop=81.96428571428571, female vocalists=41.285714285714285, indie=22.785714285714285, ... }
Ed Sheeran, Taylor Swift, Rihanna, Miley Cyrus, Billie Eilish, Lorde, Ellie Goulding, Bruno Mars,
Katy Perry, Khalid, Ariana Grande, Bon Iver, Dua Lipa, Beyoncé, Sia, P!nk, Sam Smith, Shawn Mendes,
Mark Ronson, Michael Jackson, Halsey, Lana Del Rey, Carly Rae Jepsen, Britney Spears, Madonna,
Adele, Lady Gaga, Jonas Brothers

------------------------------ CLUSTER -----------------------------------
Centroid {indie=95.23076923076923, alternative=70.61538461538461, indie rock=64.46153846153847, ... }
Twenty One Pilots, The Smiths, Florence + the Machine, Two Door Cinema Club, The 1975, Imagine Dragons,
The Killers, Vampire Weekend, Foster the People, The Strokes, Cage the Elephant, Arcade Fire,
Arctic Monkeys

------------------------------ CLUSTER -----------------------------------
Centroid {electronic=91.6923076923077, House=39.46153846153846, dance=38.0, ... }
Charli XCX, The Weeknd, Daft Punk, Calvin Harris, MGMT, Martin Garrix, Depeche Mode, The Chainsmokers,
Avicii, Kygo, Marshmello, David Guetta, Major Lazer

------------------------------ CLUSTER -----------------------------------
Centroid {rock=87.38888888888889, alternative=72.11111111111111, alternative rock=49.16666666, ... }
Weezer, The White Stripes, Nirvana, Foo Fighters, Maroon 5, Oasis, Panic! at the Disco, Gorillaz,
Green Day, The Cure, Fall Out Boy, OneRepublic, Paramore, Coldplay, Radiohead, Linkin Park,
Red Hot Chili Peppers, Muse
Since centroid coordinations are sorted by the average tag frequency, we can easily spot the dominant genre in each cluster. For example, the last cluster is a cluster of a good old rock-bands, or the second one is filled with rap stars.
Although this clustering makes sense, for the most part, it’s not perfect since the data is merely collected from user behavior.
5. Visualization
A few moments ago, our algorithm visualized the cluster of artists in a terminal-friendly way. If we convert our cluster configuration to JSON and feed it to D3.js, then with a few lines of JavaScript, we’ll have a nice human-friendly Radial Tidy-Tree:
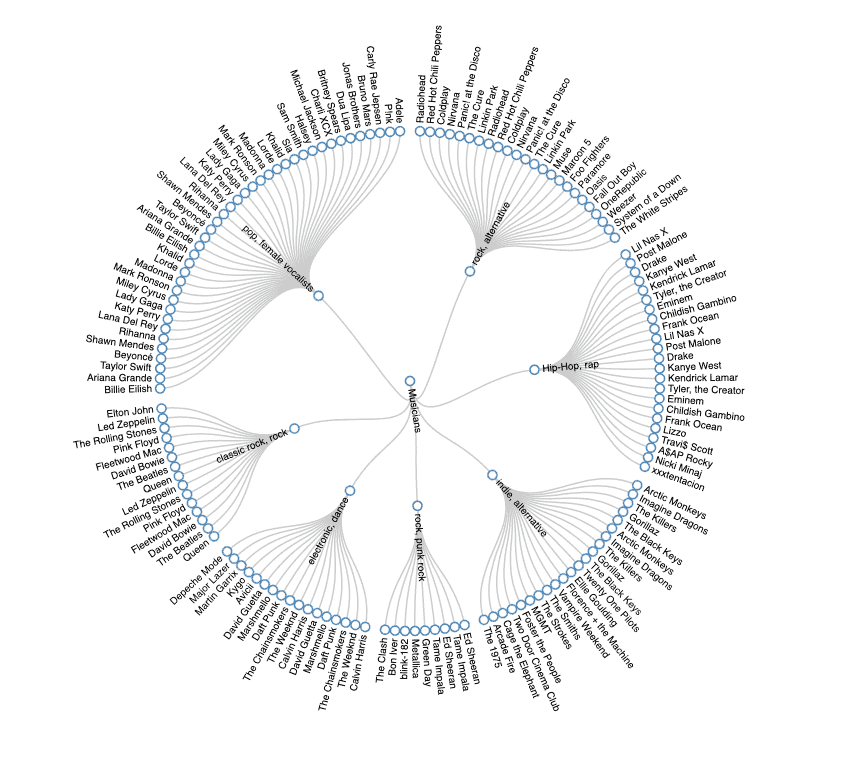
We have to convert our Map<Centroid, List<Record>> to a JSON with a similar schema like this d3.js example.
6. Number of Clusters
One of the fundamental properties of K-Means is the fact that we should define the number of clusters in advance. So far, we used a static value for k, but determining this value can be a challenging problem. There are two common ways to calculate the number of clusters:
- Domain Knowledge
- Mathematical Heuristics
If we’re lucky enough that we know so much about the domain, then we might be able to simply guess the right number. Otherwise, we can apply a few heuristics like Elbow Method or Silhouette Method to get a sense on the number of clusters.
Before going any further, we should know that these heuristics, although useful, are just heuristics and may not provide clear-cut answers.
6.1. Elbow Method
To use the elbow method, we should first calculate the difference between each cluster centroid and all its members. As we group more unrelated members in a cluster, the distance between the centroid and its members goes up, hence the cluster quality decreases.
One way to perform this distance calculation is to use the Sum of Squared Errors. Sum of squared errors or SSE is equal to the sum of squared differences between a centroid and all its members:
public static double sse(Map<Centroid, List<Record>> clustered, Distance distance) {
    double sum = 0;
    for (Map.Entry<Centroid, List<Record>> entry : clustered.entrySet()) {
        Centroid centroid = entry.getKey();
        for (Record record : entry.getValue()) {
            double d = distance.calculate(centroid.getCoordinates(), record.getFeatures());
            sum += Math.pow(d, 2);
        }
    }

    return sum;
}
Then, we can run the K-Means algorithm for different values of k and calculate the SSE for each of them:
List<Record> records = // the dataset;
Distance distance = new EuclideanDistance();
List<Double> sumOfSquaredErrors = new ArrayList<>();
for (int k = 2; k <= 16; k++) {
    Map<Centroid, List<Record>> clusters = KMeans.fit(records, k, distance, 1000);
    double sse = Errors.sse(clusters, distance);
    sumOfSquaredErrors.add(sse);
}
At the end of the day, it’s possible to find an appropriate k by plotting the number of clusters against the SSE:
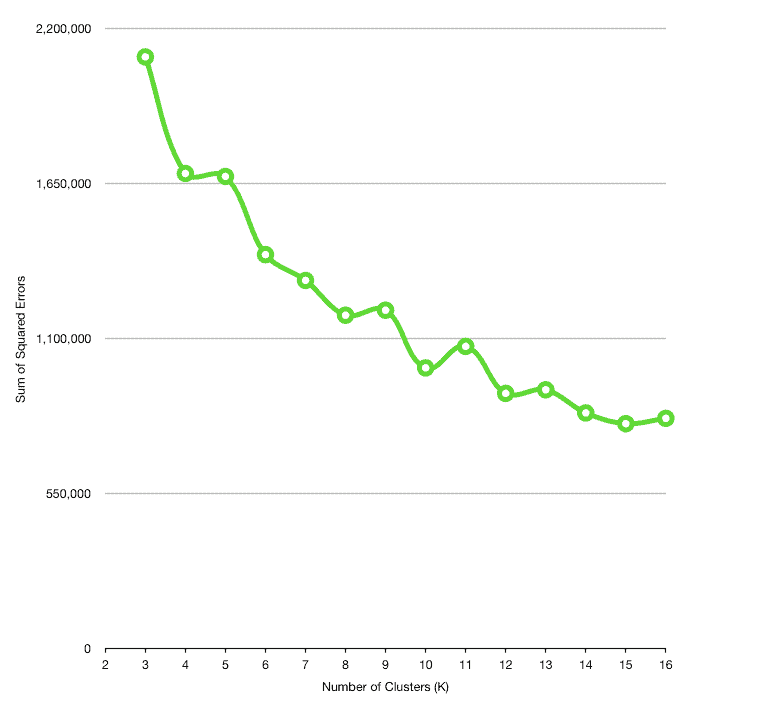
Usually, as the number of clusters increases, the distance between cluster members decreases. However, we can’t choose any arbitrary large values for k, since having multiple clusters with just one member defeats the whole purpose of clustering.
The idea behind the elbow method is to find an appropriate value for k in a way that the SSE decreases dramatically around that value. For example, k=9 can be a good candidate here.
7. Conclusion
In this tutorial, first, we covered a few important concepts in Machine Learning. Then we got aquatinted with the mechanics of the K-Means clustering algorithm. Finally, we wrote a simple implementation for K-Means, tested our algorithm with a real-world dataset from Last.fm, and visualized the clustering result in a nice graphical way.


