

Yes, we're now running our only Summer Sale. All Courses are 30% off until 20th July, 2026:
Real-Life Examples of Supervised Learning and Unsupervised Learning
Last updated: February 13, 2025
Learn through the super-clean Baeldung Pro experience:
>> Membership and Baeldung Pro.
No ads, dark-mode and 6 months free of IntelliJ Idea Ultimate to start with.
1. Intro
We use Machine Learning (ML) algorithms to solve problems that can’t be solved using traditional programming methods and paradigms, that is, problems that are hard to mathematically define such as to classify an email as spam or not.
With the rising interest in the field, we should take into account the fact that different areas and subfields are constantly progressing. For this reason, if we plan to work or develop a project we should know the basic categories that we have regarding the ML approach, more specifically how the data is used in the model and how the model is supposed to learn features from this data.
In this tutorial, we’ll discuss some real-life examples of supervised and unsupervised learning.
2. Definitions
In supervised learning, we aim to train a model to be capable of mapping an input to output after learning some features, acquiring a generalization ability to correctly classify never-seen samples of data.
First, let’s consider a simple example, in which we have different dog images and our objective is to correctly classify to which breed that dog belongs. Our input  for both the training and testing phase will be an image of a dog and the output
  will be one label containing to which breed that dog belongs:
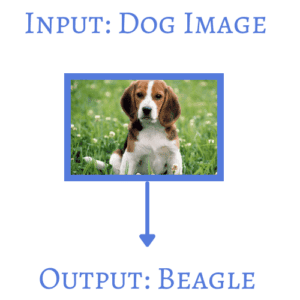
In this way, a supervisor provides the correct value or label for the output and we’re able to evaluate our model.
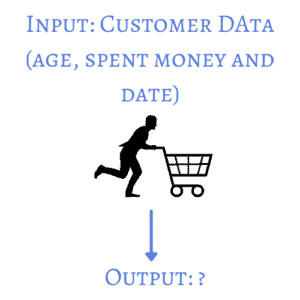
But sometimes we don’t know what is the output, as we only have the input data and we can’t define an output label for each input sample. Let’s suppose we’re working for a company that sells clothes and we have data from previous customers: how much they spent, their ages and the day that they bought the product.
Our task is to find a pattern or relationship between the variables in order to provide the company with useful information so they can create marketing strategies, decide on which type of client they should focus on to maximize the profits or which customer segment they can put more effort to expand in the market.
In this case, the output will not be a label since we can’t model our needs in this way. Instead, our program should be able to group the customers accordingly to what makes them similar or unique. This grouping will be conducted from the features learned during the training phase, and in this case, we have an unsupervised learning approach since there is no supervisor to provide labels for the inputs to map them to the output:
3. Supervised Learning
To further explain and illustrate some examples, let’s consider two main applications for supervised learning: classification and regression.
We should highlight that although we’re discussing two different scenarios, what defines a model as supervised is the fact that we always provide a label for the output, which is true for both cases. In this way, we’re using a model with feedback as we have a reference to check how the model is performing, we call this reference ground truth.
3.1. Regression
Sometimes our model should provide as output a numerical value, and in this case, we have a regression problem.
If we consider as the first example a dataset in which the input is the collection of several attributes of different cars such as manufacture year, brand, mileage, engine power, and the output is the price of the vehicle.
To keep it simple, let’s consider only the manufacture year of the car, then we train the model to learn the weight parameters  and
and  to fit the points and to build our model:
(1) 
Since we’re considering only one feature, the price, our problem can be easily visualized in a 2D-plot:
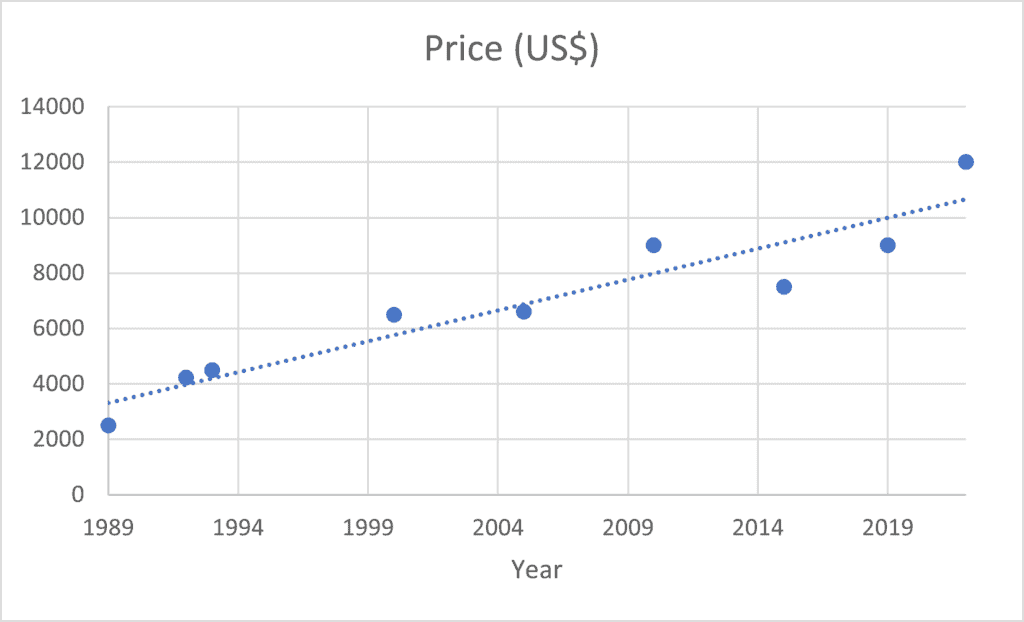
But if use the linear model shown in Equation 1, we might be preventing our model to acquire a better generalization ability and for this reason, we can use more complex models such as high-order polynomials or even nonlinear functions when we consider more input variables (brand, mileage).
Another example of regression was conducted in order to define the influence of the temperature variation in the sales of iced products for a company that works in this field. This helped the company to modify its production depending on any timeframe (month, week, or day).
This is an example of a real-life example of a regression that prevented a company to produce more or fewer products than the amount they will probably sell.
But once again, for both examples we had a well-defined and known pair input/output, first the features of the car/price of the car, then the temperature/sales of iced products.
3.2. Classification
In some cases we won’t have a numerical value as output, instead, we’ll have several classes and usually, one of them should be correctly assigned to each input sample.
To start simple, let’s consider that we have only two classes. The goal of our model now is to define the discriminant that will separate the input samples into these classes, which is a type of supervised learning problem that we call classification:
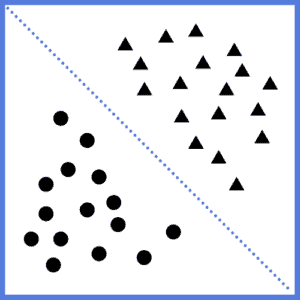
At the beginning of this article, we used as an example a dog breed classifier, which fits exactly into the category we’re discussing now. Our model will try to infer a rule that associates specific features from the dogs to a specific breed. If our model learned robust features, it will be able to predict to which breed a dog that was never used in the training phase belongs.
4. Unsupervised Learning
When we don’t have labels for the inputs, our model should be able to find patterns and regularities in the input that are unknown for us, humans. We need to estimate which associations occur more often than others and how they are related.
In this article, we’ll focus on two categories of unsupervised learning: clustering and association.
4.1. Clustering
In this type of approach, our model will try to find natural clusters (groups) in uncategorized data. If similarities are found, we’ll have different clusters grouping related input samples.
There are different types of clustering, such as exclusive, agglomeration, probabilistic and overlapping. For the sake of simplicity, in this article, we’ll discuss the K-means clustering, which is a type of exclusive method, since one input sample can only belong to one cluster.
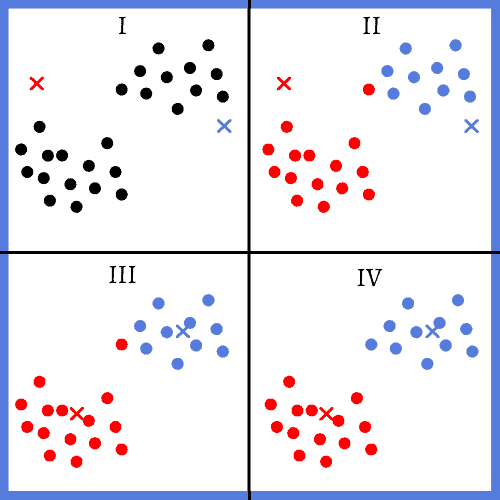
In the K-means algorithm, we first need to define the number of clusters  that we’ll have. This can be done arbitrarily or using well-established methods. The main idea of this approach is that we:
- randomly initialize centroids for each cluster
- then assign each input sample to the closest centroid
- after that we move all the centroids to the mean of the input samples that were assigned
- finally, we assign each input sample to the closest centroid again
We do this iteratively until we reach a defined number of iterations of if the centroids stop changing:
We can implement this algorithm to solve the problem that we used as an example at the beginning of this article: customer segmentation. In this way, we can group everyone that buys at a store accordingly to their purchasing behaviour.
As the last example, we can analyze a streaming service that wants to improve the suggestion system for its viewers.
If we have useful data from the customers such as time spent watching movies, movies genres, and which unique tv shows they watched, we can use clustering methods to group them so we can find out who is worth receiving more attention in marketing campaigns.
4.2. Association
In some applications, we might want to find if a feature or variable is strongly related to another, considering a large dataset. In ML we have the association rule learning: an association rule defines a connection  , in which is the antecedent and is the consequent of the rule.
The most common use scenario of this algorithm is the basket analysis, where we want to find out if a person who buys a product is inclined to also buy the product .
There are three measures that are usually calculated in association rules. The first is the confidence, which is the traditional conditional probability  . We want the value as close to one as possible and larger than
  to be able to conclude that the rule is strong enough.
It is also relevant to consider the support of the rule since even with a stronger support rule, we must know if the number of customers is significantly large:
(2) 
(3) 
Other applications for the association rule include: trying to suggest a movie considering that a viewer watched a TV Show , developing and testing artificial proteins by using association rules to connect amino acids from natural proteins.
5. Conclusion
From the various examples that we discussed, the takeaway from this article should be the clear difference between supervised and unsupervised learning, since the fact that the dataset that we’re using has labels and the goal we aim to achieve is a label or a group will define which algorithm and strategy to implement.