

Yes, we're now running our only Summer Sale. All Courses are 30% off until 20th July, 2026:
Find Out the Total Physical Memory (RAM) on Linux
Last updated: March 25, 2025
Learn through the super-clean Baeldung Pro experience:
>> Membership and Baeldung Pro.
No ads, dark-mode and 6 months free of IntelliJ Idea Ultimate to start with.
1. Overview
Sometimes, we might need to check for total memory size on a server running Linux or we might need to use memory stats in shell scripts. Fortunately, we have access to numerous tools that we can use to check for total physical memory. In this tutorial, we’re going to take different approaches to serve that purpose by using several useful commands and tools.
2. free Command
free is the simplest of all the commands we’ll see. It’s used to print the physical and swap memory usage — by default, it prints to standard output. The free command is one of the widely used commands to quickly check for RAM stats because it’s available on most Linux distributions. We can simply type the free command on our terminal without any flags:
$ free total used free shared buff/cache available
Mem: 8021048 1320432 5689744 335556 1010872 6121932
Swap: 0 0 0As we can, the size of the physical memory is printed in bytes. However, we can easily print the output in a human-readable format using the -h or –human flag:
$ free -h total used free shared buff/cache available
Mem: 7.6Gi 1.3Gi 5.4Gi 318Mi 985Mi 5.8Gi
Swap: 0B 0B 0BAs can be seen in the output above, we have a total of 7.6 GiB of RAM. Moreover, there are lots of other options that can be used to print the output in the format we like such as –kilo, –mega, –Giga, and so on. One more interesting option is the -s option:
$ free -h -s 5The -s flag stands for seconds, so free will print the RAM usage every 5 seconds in this example. It’s especially useful if we want to monitor the RAM usage at a specified interval. We can easily terminate the process with Ctrl + C keyboard shortcut.
3. vmstat Command
Like the free command, vmstat (virtual memory statistics) is also available on most Linux distributions. By default, when we type the vmstat command, it will print the free, buffered, and cached memory alongside swap, CPU, IO, and system information:
$ vmstat -w--procs-- -----------------------memory---------------------- ---swap-- -----io---- -system-- --------cpu--------
r b swpd free buff cache si so bi bo in cs us sy id wa st
1 0 0 5352900 56816 1053708 0 0 162 73 328 1087 18 4 78 0 0
The -w or –wide flag prints the output in a wide readable format. Since we’re interested in total RAM size, we’re going to add the -s or –stats flag:
$ vmstat -s 8021048 K total memory
1564516 K used memory
305336 K active memory
1962636 K inactive memory
5391588 K free memory
58224 K buffer memory
1006720 K swap cache
0 K total swap
0 K used swap
0 K free swap
76393 non-nice user cpu ticks
5 nice user cpu ticks
14122 system cpu ticks
337834 idle cpu ticks
1790 IO-wait cpu ticks
1463 IRQ cpu ticks
614 softirq cpu ticks
0 stolen cpu ticks
617253 pages paged in
310410 pages paged out
0 pages swapped in
0 pages swapped out
1426200 interrupts
4722588 CPU context switches
1625563254 boot time
1949 forks
The first entry in the output is total physical RAM. Sometimes, we don’t need all the info, so we can use grep to extract only the desired entry:
$ vmstat -s | grep -i 'total memory' | sed 's/ *//'8021048 K total memory
4. top Command
top is basically a command-line task manager with a real-time output. It’s used to check the running processes in a clean table layout. It also shows us the CPU, RAM, and system information in general. We can fire it up by simply running the top command:
$ toptop - 15:18:13 up 57 min, 1 user, load average: 3.40, 3.26, 2.04
Tasks: 138 total, 1 running, 137 sleeping, 0 stopped, 0 zombie
%Cpu(s): 17.2 us, 3.6 sy, 0.0 ni, 77.5 id, 0.3 wa, 0.9 hi, 0.5 si, 0.0 st
MiB Mem : 7833.1 total, 4665.9 free, 1782.3 used, 1384.8 buff/cache
top - 15:18:49 up 57 min, 1 user, load average: 2.61, 3.08, 2.03
Tasks: 138 total, 1 running, 137 sleeping, 0 stopped, 0 zombie
top - 15:18:58 up 58 min, 1 user, load average: 2.45, 3.02, 2.02
MiB Swap: 0.0 total, 0.0 free, 0.0 used. 5324.5 avail Mem
At the top, we can see the memory information beside the Mem field and observe that we have a total of 7833 MiB of total RAM.
5. dmidecode Utility
dmidecode is a helper tool that prints information about hardware components – such as hardware specifications, serial numbers, and BIOS versions – in a human-readable format. The hardware information is extracted from the DMI table. We can also use it to find interesting information about our system such as the maximum supported memory.
5.1. Installing dmidecode
dmidecode is not installed on some Linux distributions by default, so we’re going to install it first. We can install dmidecode directly from our distribution repository using a package manager.
For Ubuntu-based distributions, we can install the package through apt:
# apt install dmidecodeFor RHEL, Fedora, and CentOS, we can use yum:
# yum install dmidecodeOn Arch-based distributions, simply use pacman:
# pacman -Sy dmidecode5.2. Using dmidecode
Once the installation is complete, we can run the dmidecode command from our terminal:
# dmidecodeWe need to have root privileges to run dmidecode. Once we run the command, we’ll be able to see detailed hardware information. It contains a lot of information related to our hardware components, but we’re only interested in our total memory size.
Fortunately, we can feed the –type option to the command for different components such as BIOS, memory, processor, temperatures, and so on. The –type option expects a number for DMI types.
In our case, we want to look at the memory DMI type, which can be accessed with the assigned numbers 5, 6, 16, 17, 18, 19, 20, 21, and 22. However, we’re interested in the number 19, which will print the RAM devices that are currently attached to the slots on our motherboard:
# dmidecode --type 19# dmidecode 3.3
Getting SMBIOS data from sysfs.
SMBIOS 3.0.0 present.
Handle 0x0049, DMI type 19, 31 bytes
Memory Array Mapped Address
Starting Address: 0x00000000000
Ending Address: 0x001FFFFFFFF
Range Size: 8 GB
Physical Array Handle: 0x0044
Partition Width: 1As we can see, we only have a single RAM device with 8 GB of total size installed in one of the RAM slots.
6. /proc/meminfo Virtual File
The /proc directory is a special type of directory that contains virtual files. These virtual files are a way to take a peek at the Linux kernel, processes, and configurations. These files don’t actually exist on the disk and take no space, but they’re created when they are read. Access to some of the files requires root access.
There’s a special virtual file named meminfo, inside the /proc directory, that can be read with commands like cat and less. The meminfo file contains information about our physical memory size among other useful information. Let’s read the /proc/meminfo file using cat:
$ cat /proc/meminfoIn the example above, we’ve used the cat command, which is a useful utility that can read from a file or standard input. Once the command is executed, it will read /proc/meminfo and present us with a long output regarding our physical memory. We’re only interested in the total RAM size, which appears in the top three lines of the output:
$ cat /proc/meminfo | head -n 3MemTotal: 8021048 kB
MemFree: 4542960 kB
MemAvailable: 5155668 kB
We printed only the lines that we’re interested in by using the head command. The -n argument provided to the head command is used to specify the number of lines to read. The sizes are printed in kilobytes and should give us an idea of what our total, free, and available physical memory is.
Let’s suppose we’re writing a Bash script where we need to process the physical RAM size. We can achieve that by reading the /proc/meminfo file first and then grep the total memory size:
#!/bin/bash

total_ram () {
  local totalram=$(cat /proc/meminfo | grep -i 'memtotal' | grep -o '[[:digit:]]*')
  echo $totalram
}

ram_size=$(total_ram)
echo "Total RAM: $ram_size kB"
Now, let’s save the script and make it executable:
$ chmod +755 totalram.sh
$ ./totalram.sh
Total RAM: 8021048 kB
7. Using GUI Task Managers
There are a variety of GUI task managers that we can use to check for CPU, RAM, and network usage in addition to managing processes. Let’s take a quick look at the most popular ones for Linux.
7.1. GNOME System Monitor
GNOME System Monitor is the default task manager that ships with the GNOME desktop environment. However, if we’re running a different desktop environment, we can easily look for the gnome-system-monitor package on our distribution package repository. Once it’s installed, we can launch it from the command line:
$ gnome-system-monitor
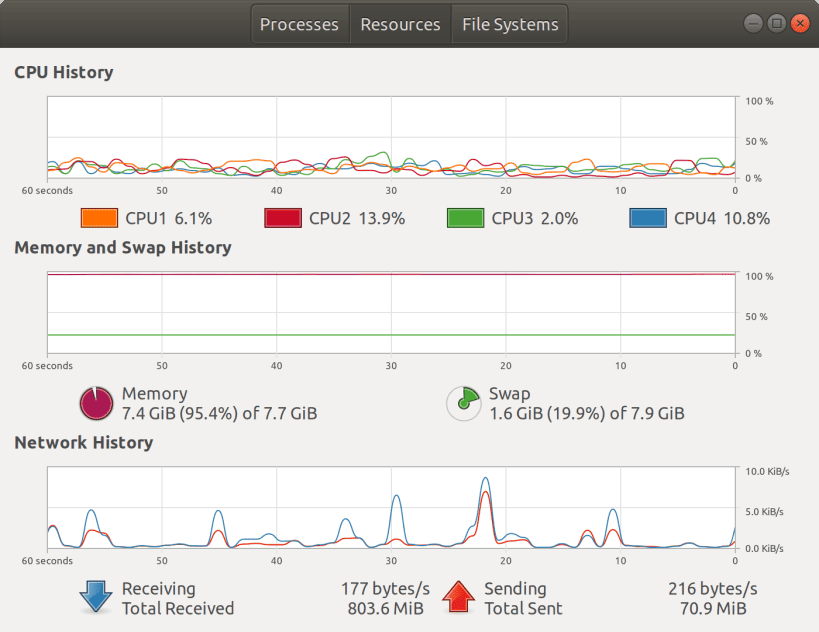
Upon navigating to the Resources tab, we can see our total memory size among other stats.
7.2. KSysGuard
KSysGuard is the default task manager developed by the KDE community and comes with KDE by default. Similarly, if we’re using a different desktop environment, we can easily install it on our system by looking for the ksysguard package in the package repository. We can launch it with the ksysguard command once it’s installed:
$ ksysguard
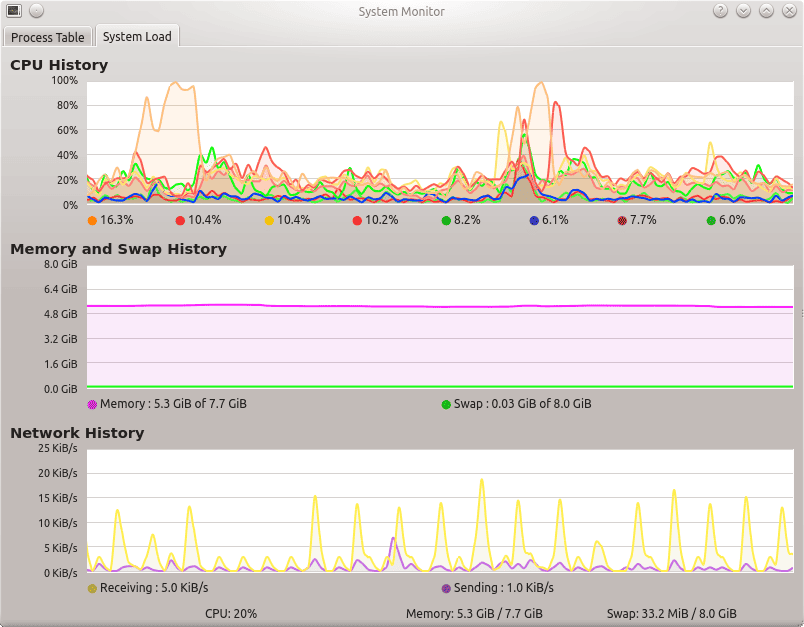
Once ksysguard starts, we can head to the System Load tab and see our memory information along with a nice graph.
8. Conclusion
In this article, we looked at different commands and tools that can help us find out the physical memory size of our Linux system.
We covered the minimal free command and its alternative vmstat command. Then we used the top command to find out various system information. We also looked at the dmidecode utility and how we can extract the physical memory information from the DMI table.
Afterward, we learned what the /proc directory is and how we can read the /proc/meminfo file to check for total RAM size and use it in a bash script. Finally, we learned about a couple of graphical task managers and how we can use them to check for RAM usage and stats.