

Learn through the super-clean Baeldung Pro experience:
>> Membership and Baeldung Pro.
No ads, dark-mode and 6 months free of IntelliJ Idea Ultimate to start with.
Last updated: March 18, 2024
Learn through the super-clean Baeldung Pro experience:
>> Membership and Baeldung Pro.
No ads, dark-mode and 6 months free of IntelliJ Idea Ultimate to start with.
Linux provides a wide range of tools to monitor the current system load. Such tools can determine how many processes are active and whether the system has adequate resources. However, there might be instances when the output of different monitoring tools is contradictory.
In this tutorial, we’ll examine specific scenarios in which the load average metric, CPU utilization, and active processes fail to align.
Some monitoring tools refresh their output at intervals greater than one second. Others provide an instant snapshot of the system’s active processes. As a result, these monitoring tools may fail to capture short-lived processes.
To demonstrate a scenario of short-lived processes, we’ll create a shell script that prints a message to /dev/null in the background:
$ echo "echo 'Hello' > /dev/null &" > echoer.sh
$ chmod u+rwx echoer.sh
Thus, we saved the script under the echoer.sh file and used chmod to make it executable.
Next, let’s execute the script 100000 times:
$ for i in {1..100000}; do ./echoer.sh; doneAs a result, we’re creating many short-lived processes that we’ll try to track using well-known monitoring commands.
Now that we have a script that creates thousands of processes, let’s open another terminal session and run the top command with the -u option to return only the processes of a designated user:
$ top -u $USER
top - 20:21:19 up 7 days,  5:59,  2 users,  load average: 1.01, 0.77, 0.71
Tasks: 104 total,   2 running, 102 sleeping,   0 stopped,   0 zombie
%Cpu(s): 30.2 us, 69.4 sy,  0.0 ni,  0.0 id,  0.3 wa,  0.0 hi,  0.0 si,  0.0 st
MiB Mem :    638.2 total,    192.4 free,    262.7 used,    183.1 buff/cache
MiB Swap:      0.0 total,      0.0 free,      0.0 used.    175.5 avail Mem

    PID USER      PR  NI    VIRT    RES    SHR S  %CPU  %MEM     TIME+ COMMAND
 226805 ubuntu    20   0   37524  33392   3204 S   1.3   5.1  10:57.99 bash
   7901 ubuntu    20   0   37384  30688    640 R   0.7   4.7   0:00.02 bash
   7683 ubuntu    20   0   10920   3932   3216 R   0.0   0.6   0:00.00 top
...
Here, we observe that the CPU utilization is about 100%. Specifically, the CPU is reported to spend 30.2% of its time running user processes and 69.4% of its time running system processes.
Furthermore, the load average is 1.01. Load average is the number of jobs waiting in the run queue to execute or being in the uninterruptible sleep state. Also, the load average is calculated over one, five, and fifteen minutes, hence the three numbers printed. Consequently, 1.01 indicates that the CPU was busy, so one process waited to run at the last minute.
Nevertheless, no process seems to contribute significantly to CPU consumption, despite our high-load process repetition. Furthermore, top didn’t print any process running the echo command.
The ps command prints a snapshot of the active processes to the standard output:
$ ps ux
USER         PID %CPU %MEM    VSZ   RSS TTY      STAT START   TIME COMMAND
ubuntu       902  0.0  0.6  17084  4276 ?        Ss   11:15   0:00 /lib/systemd/systemd --user
ubuntu       903  0.0  0.5 104128  4040 ?        S    11:15   0:00 (sd-pam)
ubuntu      1038  0.0  0.6  17212  4276 ?        S    11:15   0:00 sshd: ubuntu@pts/1
ubuntu      1039  0.0  0.7   9232  4844 pts/1    Ss   11:15   0:00 -bash
ubuntu     75100  0.0  1.1  17176  7856 ?        S    11:45   0:00 sshd: ubuntu@pts/0
ubuntu     75101  0.6  4.8  37348 33448 pts/0    Ss   11:45   0:20 -bash
ubuntu    188916  0.0  4.5  37348 31392 pts/0    R+   12:39   0:00 -bash
ubuntu    188917  0.0  0.4  10460  3372 pts/1    R+   12:39   0:00 ps ux
As we can see, the ps command didn’t capture the short-lived processes that we’re creating with the echoer.sh script. Furthermore, the CPU usage information printed doesn’t point to any processes that cause the CPU load.
The atop command is a useful tool that can show which processes are responsible for the load indicated even if they’re terminated: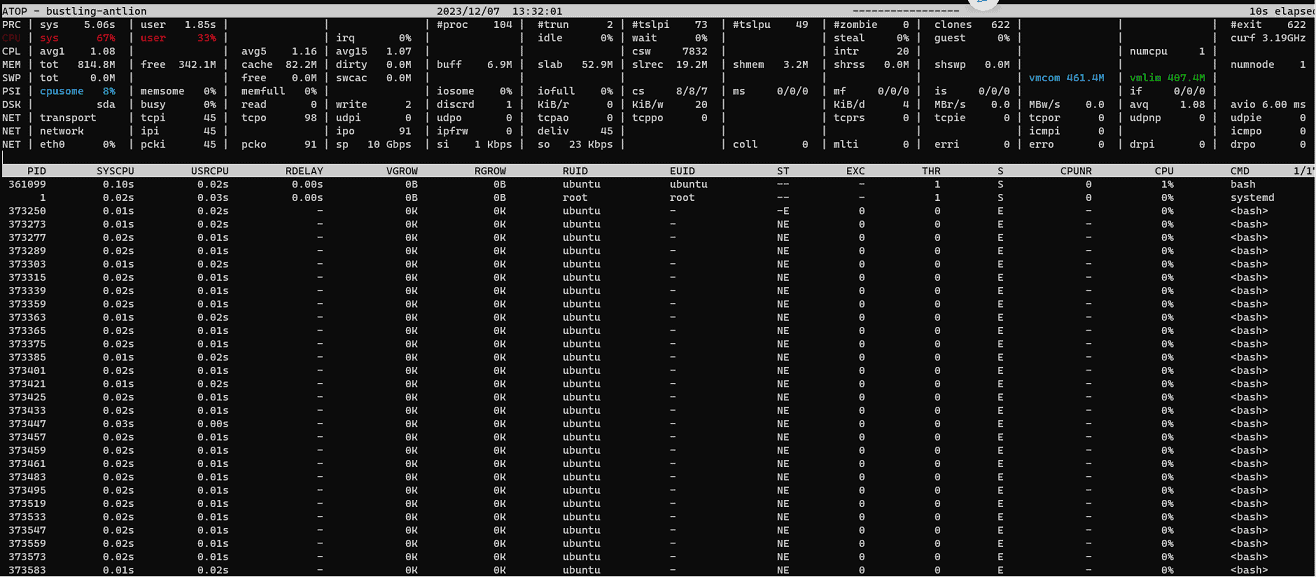
Indeed, we can see that atop has detected that there’s a high CPU load, which is highlighted using a red font. Most importantly, it prints the numerous short-lived processes that we’re creating with the echoer script.
In contrast to top and ps, atop uses the system’s process accounting records to track processes even if they’re terminated.
Another way to detect short-lived processes is to use the accounting utilities of the acct package. These tools log every command executed on a Linux system.
First, we install the acct package:
$ sudo apt install acctThen, we activate logging:
$ sudo accton on
Turning on process accounting, file set to the default '/var/log/account/pacct'.
Finally, we can use the dump-act command to view the commands executed:
$ sudo dump-acct /var/log/account/pacct | tail -n 8
bash            |v3|     1.00|     3.00|     6.00|  1000|  1000| 37352.00|     0.00|  684566|  449465| F   |       0|pts/0   |Thu Dec  7 14:30:16 2023
bash            |v3|     0.00|     0.00|     0.00|  1000|  1000| 37352.00|     0.00|  684567|       1| F   |       0|pts/0   |Thu Dec  7 14:30:16 2023
bash            |v3|     1.00|     2.00|     6.00|  1000|  1000| 37352.00|     0.00|  684568|  449465| F   |       0|pts/0   |Thu Dec  7 14:30:16 2023
bash            |v3|     0.00|     0.00|     0.00|  1000|  1000| 37352.00|     0.00|  684569|       1| F   |       0|pts/0   |Thu Dec  7 14:30:16 2023
bash            |v3|     1.00|     3.00|     7.00|  1000|  1000| 37352.00|     0.00|  684570|  449465| F   |       0|pts/0   |Thu Dec  7 14:30:16 2023
bash            |v3|     0.00|     0.00|     0.00|  1000|  1000| 37352.00|     0.00|  684571|       1| F   |       0|pts/0   |Thu Dec  7 14:30:16 2023
bash            |v3|     3.00|     2.00|     6.00|  1000|  1000| 37352.00|     0.00|  684572|  449465| F   |       0|pts/0   |Thu Dec  7 14:30:16 2023
bash            |v3|     0.00|     0.00|     1.00|  1000|  1000| 37352.00|     0.00|  684573|       1| F   |       0|pts/0   |Thu Dec  7 14:30:16 2023
Indeed, the dump-acct command printed a log with the commands that the system has executed. In addition, we used the tail command to print the last eight records of the log. As we can see, numerous bash commands are printed. These are the short-lived processes that we generate with the echoer script.
Thus, accounting utilities can effectively capture short-lived processes. Nevertheless, we should be aware that activating the logging of the accounting utilities can produce large log files, so we should be cautious.
Another case of invisible high load may occur when we have many processes in the uninterruptible sleep state.
Specifically, the load average of most tools counts both runnable processes and processes in the uninterruptible sleep state. As a result, too many processes in the uninterruptible sleep state can raise the load average metric while CPU consumption stays at low levels.
To simulate this case, we’ll write a small C program that uses the vfork() function. In contrast to the well-known fork() function, vfork() suspends the parent process until the child process exits.
Let’s create a C source file with the name vfork.c:
$ cat vfork.c
#include <unistd.h>
#include <stdlib.h>

int main(int argc, char *argv[]) {
    vfork();
    sleep(120);
    exit(0);
}
Here, we expect that after calling vfork(), the parent process will be suspended and should wait for the child process to exit.
Next, let’s compile and run vfork() in the background inside a for loop to create many processes in the uninterruptible sleep state:
$ gcc -o vfork vfork.c
$ for i in {1..20}; do ./vfork & done;
[1] 881819
[2] 881820
...
As expected, we created 20 background jobs.
Next, let’s run top to check the system’s load average and CPU utilization:
top - 15:56:16 up  4:41,  2 users,  load average: 11.43, 6.44, 3.11
Tasks: 140 total,   1 running, 139 sleeping,   0 stopped,   0 zombie
%Cpu(s):  0.3 us,  0.0 sy,  0.0 ni, 99.7 id,  0.0 wa,  0.0 hi,  0.0 si,  0.0 st
MiB Mem :    656.0 total,    151.4 free,    288.6 used,    216.1 buff/cache
MiB Swap:      0.0 total,      0.0 free,      0.0 used.    153.3 avail Mem

    PID USER      PR  NI    VIRT    RES    SHR S  %CPU  %MEM     TIME+ COMMAND
 ...
 881868 ubuntu    20   0    2640    976    888 D   0.0   0.1   0:00.00 vfork
 881869 ubuntu    20   0    2640    956    868 D   0.0   0.1   0:00.00 vfork
 881870 ubuntu    20   0    2640    968    876 D   0.0   0.1   0:00.00 vfork
 881871 ubuntu    20   0    2640    948    856 D   0.0   0.1   0:00.00 vfork
 881872 ubuntu    20   0    2640    992    900 D   0.0   0.1   0:00.00 vfork
 ...
As we can see, the 1-minute load average reached the 11.43 value. This means that an average of 11 processes are waiting to be executed. On the other hand, the CPU is idle, as indicated by the 99.7 value of the idle time metric. Furthermore, we can see a lot of active processes in the D state, which is the uninterruptible sleep state.
Most monitoring tools use the /proc folder to get information about active processes. Interestingly, we can hide a process from monitoring tools if we mount another filesystem to the /proc/<pid> directory of the process. As a result, despite the increase in CPU utilization and load average metrics, we won’t see the processes that utilize the CPU.
To simulate this case, let’s run the cat command to copy bytes from /dev/random to /dev/null:
$ cat /dev/random > /dev/nullNext, let’s run ps to get the PID of the cat command and verify the command heavily utilizes the CPU:
$ ps ux | grep cat
ubuntu    881961 99.1  0.3   6328  2164 pts/0    R+   16:21   0:16 cat /dev/random
As we can see in the second column, the PID is 881961. In addition, the third column displays the CPU usage, where we can see that this process consumes 99.1% of the CPU.
Next, let’s create a filesystem in a file with the name myfs.img:
$ truncate --size=100M myfs.img
$ sudo mkfs.ext4 myfs.img
mke2fs 1.46.5 (30-Dec-2021)
Discarding device blocks: done
Creating filesystem with 25600 4k blocks and 25600 inodes

Allocating group tables: done
Writing inode tables: done
Creating journal (1024 blocks): done
Writing superblocks and filesystem accounting information: done
Indeed, we created the myfs.img file with a size of 100M using the truncate command. Next, we created an ext4 filesystem within this file.
Now, we’re ready to mount the filesystem that we created to the /proc/881961 directory:
$ sudo mount myfs.img /proc/881961Next, let’s again run the ps command to see if the 881961 process is reported:
$ ps ux | grep catAs we expected, now ps doesn’t find the 881961 process.
Finally, let’s also run top to check the system’s load average and the CPU utilization metrics:
top - 16:31:02 up 1 day,  5:16,  1 user,  load average: 1.05, 0.38, 0.14
Tasks: 103 total,   1 running, 102 sleeping,   0 stopped,   0 zombie
%Cpu(s):  0.0 us,100.0 sy,  0.0 ni,  0.0 id,  0.0 wa,  0.0 hi,  0.0 si,  0.0 st
...
Indeed, the load average is 1.05, and CPU utilization is 100.0.
In this article, we examined three cases of hidden load on a Linux system:
Finally, we used monitoring tools like ps, top, atop, and acct to see how they handle our scenario.