

Learn through the super-clean Baeldung Pro experience:
>> Membership and Baeldung Pro.
No ads, dark-mode and 6 months free of IntelliJ Idea Ultimate to start with.
Learn through the super-clean Baeldung Pro experience:
>> Membership and Baeldung Pro.
No ads, dark-mode and 6 months free of IntelliJ Idea Ultimate to start with.
In this article, we’ll learn about process states in Linux. Particularly, we’ll learn about each of the five different states of a Linux process during the various parts of the lifecycle. Furthermore, we’ll also look into different tools we can use to read the state of each process in our system.
In Linux, a process is an instance of executing a program or command. While these processes exist, they’ll be in one of the five possible states:
To visualize the lifecycle of the process, we can model it in a finite-state machine:
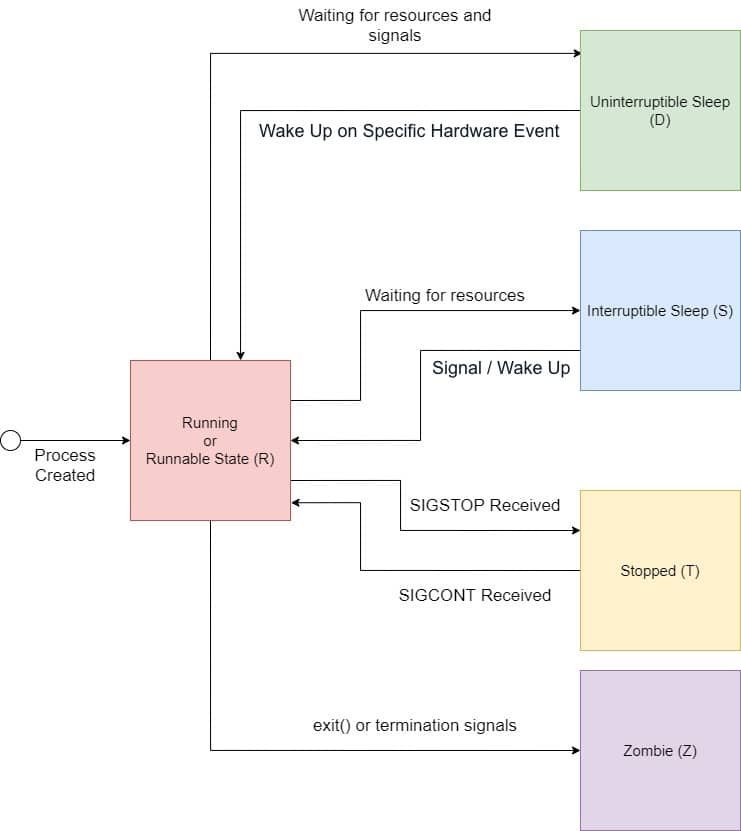
For any Linux process, their starting point is the moment they are created. For example, a parent process can initiate a child process using the fork() system call. Once it starts, the process goes into the running or runnable state. While the process is running, it could come into a code path that requires it to wait for particular resources or signals before proceeding. While waiting for the resources, the process would voluntarily give up the CPU cycles by going into one of the two sleeping states.
Additionally, we could suspend a running process and put it into the stopped state. Usually, this is done by sending the SIGSTOP signal to the process. A process in this state will continue to exist until it is killed or resumed with SIGCONT. Finally, the process completes its lifecycle when it’s terminated and placed into a zombie state until its parent process clears it off the process table.
When a new process is started, it’ll be placed into the running or runnable state. In the running state, the process takes up a CPU core to execute its code and logic. However, the thread scheduling algorithm might force a running process to give up its execution right. This is to ensure each process can have a fair share of CPU resources. In this case, the process will be placed into a run queue, and its state is now a runnable state waiting for its turn to execute.
Although the running and runnable states are distinct, they are collectively grouped into a single state denoted by the character R.
During process execution, it might come across a portion of its code where it needs to request external resources. Mainly, the request for these resources is IO-based such as to read a file from disk or make a network request. Since the process couldn’t proceed without the resources, it would stall and do nothing. In events like these, they should give up their CPU cycles to other tasks that are ready to run, and hence they go into a sleeping state.
There are two different sleeping states: the uninterruptible sleeping state (D) waits for the resources to be available before it moves into a runnable state and doesn’t react to any signals.
Let’s imagine a process that reads data from a network-mounted storage system, like an NFS (Network File System) or a SAN (Storage Area Network). If the network is slow or experiencing issues, the read operation might take significant time. During this time, the process is effectively blocked, waiting for the network read operation to complete. It enters the D state. The process cannot be interrupted or killed in this state because it’s waiting on a hardware condition (in this case, the network response). This is essential to ensure data integrity and consistency. Once the network I/O operation completes (either successfully or with an error), the process will move out of the D state and continue its execution or handle any errors that occurred.
On the other hand, interruptible sleeping state (S) is the interruptible sleeping state (s) that will react to signals and the availability of resources. A process enters the S state, or Interruptible Sleep, when it waits for an event or condition that is not directly related to an I/O operation.
For example, when a process waits for user input, let us consider a command-line application running in a terminal, like a text editor or a shell. When this application waits for the user to type a command or input text, it doesn’t need to use the CPU. To efficiently manage system resources, the process goes into the S (Interruptible Sleep) state while it waits. In this state, the process is not executing any code; instead, it’s waiting for an event (in this case, user input) to occur. Since it’s in Interruptible Sleep, the process can be woken up by signals, like a signal indicating that the user has pressed a key. Once the user provides input, the process wakes up, moves back into the R (Running) state, processes the input, and continues its operation.
From a running or runnable state, we could put a process into the stopped state (T) using the SIGSTOP or SIGTSTP signals. The difference between both signals is that we send the SIGSTOP is programmatic, such as running kill -STOP {pid}. Additionally, the process cannot ignore this signal and will go into the stopped state. On the other hand, we send the SIGTSTP signal using the keyboard CTRL + Z. Unlike SIGSTOP, the process can optionally ignore this signal and continue to execute upon receiving SIGTSTP.
While in this state, we could bring back the process into a running or runnable state by sending the SIGCONT signal.
When a process has completed its execution or is terminated, it’ll send the SIGCHLD signal to the parent process and go into the zombie state. The zombie process, also known as a defunct process, will remain in this state until the parent process clears it off from the process table. To clear the terminated child process off the process table, the parent process must read the exit value of the child process using the wait() or waitpid() system calls.
There are multiple ways to check the state of a process is in Linux. For example, we can use command-line tools like ps and top to check the state of processes. Alternatively, we can consult the pseudo status file for a particular PID.
To display process state using ps, let’s run the ps command to include a column that tells us the state of the process:
$ ps a
    PID TTY      STAT   TIME COMMAND
   2234 tty2     Ssl+   0:00 /usr/lib/gdm3/gdm-x-session --run-script env GNOME_SHELL_SESSION_MODE=ubuntu /usr/bin/gnome-session --systemd --session=ubuntu
   2237 tty2     Rl+    0:07 /usr/lib/xorg/Xorg vt2 -displayfd 3 -auth /run/user/1000/gdm/Xauthority -background none -noreset -keeptty -verbose 3
   2287 tty2     Sl+    0:00 /usr/libexec/gnome-session-binary --systemd --systemd --session=ubuntu
   2982 pts/0    Ss     0:00 bash
   3467 pts/0    R+     0:00 ps a
The first letter of the value under the STAT column indicates the state that the process is in. For example, the process with PID 2234 is currently in an interruptible sleeping state, as denoted by the character S. Besides that, we can also observe that process 2237 is currently in the running or runnable state.
Additionally, we can see that there are additional characters besides each of the state characters. These characters indicate several attributes of the state of the process. For example, the lower capital letter s means the process is the session leader. For a comprehensive list of the meaning of each of the characters, we can find it on the official man page.
In Linux, the top command-line tool displays the process details in a real-time fashion. It shows different aspects of the system, such as memory and CPU usage of individual processes. To see the process state, let’s run top in the terminal:
Tasks: 183 total,   1 running, 182 sleeping,   0 stopped,   0 zombie
%Cpu(s):  0.7 us,  1.1 sy,  0.0 ni, 97.1 id,  0.4 wa,  0.0 hi,  0.7 si,  0.0 st
MiB Mem :   3936.4 total,   1925.0 free,    850.6 used,   1160.8 buff/cache
MiB Swap:   2048.0 total,   2048.0 free,      0.0 used.   2834.2 avail Mem

    PID USER  PR  NI    VIRT    RES    SHR S  %CPU  %MEM     TIME+ COMMAND
   2237 bob   20   0  252252  81740  49204 S   2.3   2.0   0:09.37 Xorg
   2519 bob   20   0 3428664 375256 125080 S   2.0   9.3   0:19.57 gnome-shell
   2909 bob   20   0  966852  49944  37308 S   1.0   1.2   0:02.28 gnome-terminal-
      1 root  20   0  103500  13312   8620 S   0.7   0.3   0:04.44 systemd
   3588 bob   20   0   20600   3936   3380 R   0.3   0.1   0:00.01 top
      2 root  20   0       0      0      0 S   0.0   0.0   0:00.00 kthreadd
      3 root   0 -20       0      0      0 I   0.0   0.0   0:00.00 rcu_gp
At the bottom section of the output of the top command, we can find the S column, which shows the state of each process. Contrary to the ps command, the top command displays the state of each process without additional process attributes.
The /proc pseudo filesystem contains all the information about the processes in our system. Hence, we could directly read the state of a process through this pseudo filesystem. The downside of this approach is we’ll first need to know the PID of the process before we can read its state.
To obtain the state of a process, we can extract the value from its pseudo status file under /proc/{pid}/status. For example, we can get the state of the process with PID 2519 by reading the file /proc/2519/status:
$ cat /proc/2519/status | grep State
State: S (sleeping)In this tutorial, we’ve looked at the lifecycle of a Linux process. Furthermore, we’ve learned how we can model a Linux process lifecycle as a finite state machine. Then, we’ve looked at the five different states as a Linux process undergoes the entire lifecycle. Finally, we ended the article with demonstrations on getting the Linux process state using various tools such as ps, top, and the /proc pseudo-file.