Determine the Execution Time of JUnit Tests
Last updated: January 8, 2024


Mocking is an essential part of unit testing, and the Mockito library makes it easy to write clean and intuitive unit tests for your Java code.
Get started with mocking and improve your application tests using our Mockito guide:
Handling concurrency in an application can be a tricky process with many potential pitfalls. A solid grasp of the fundamentals will go a long way to help minimize these issues.
Get started with understanding multi-threaded applications with our Java Concurrency guide:
Spring 5 added support for reactive programming with the Spring WebFlux module, which has been improved upon ever since. Get started with the Reactor project basics and reactive programming in Spring Boot:
Since its introduction in Java 8, the Stream API has become a staple of Java development. The basic operations like iterating, filtering, mapping sequences of elements are deceptively simple to use.
But these can also be overused and fall into some common pitfalls.
To get a better understanding on how Streams work and how to combine them with other language features, check out our guide to Java Streams:
Explore Spring Boot 3 and Spring 6 in-depth through building a full REST API with the framework:
Yes, Spring Security can be complex, from the more advanced functionality within the Core to the deep OAuth support in the framework.
I built the security material as two full courses - Core and OAuth, to get practical with these more complex scenarios. We explore when and how to use each feature and code through it on the backing project.
You can explore the course here:
Spring Data JPA is a great way to handle the complexity of JPA with the powerful simplicity of Spring Boot.
Get started with Spring Data JPA through the guided reference course:
Refactor Java code safely — and automatically — with OpenRewrite.
Refactoring big codebases by hand is slow, risky, and easy to put off. That’s where OpenRewrite comes in. The open-source framework for large-scale, automated code transformations helps teams modernize safely and consistently.
Each month, the creators and maintainers of OpenRewrite at Moderne run live, hands-on training sessions — one for newcomers and one for experienced users. You’ll see how recipes work, how to apply them across projects, and how to modernize code with confidence.
Join the next session, bring your questions, and learn how to automate the kind of work that usually eats your sprint time.
1. Overview
Our builds often run a lot of automated test cases for our project. These include unit and integration tests. If the execution of the test suite takes a long time, we may wish to optimize our test code or track down tests that are taking too long.
In this tutorial, we’ll learn a few ways to determine the execution time of our test cases and test suites.
2. JUnit Examples
To demonstrate reporting execution times, let’s use some example test cases from different layers of the test pyramid. We’ll simulate the test case duration with Thread.sleep().
We’ll implement our examples in JUnit 5. However, the equivalent tools and techniques also apply to test cases written with JUnit 4.
First, here’s a trivial unit test:
@Test
void someUnitTest() {

    assertTrue(doSomething());
}
Second, let’s have an integration test that takes more time to execute:
@Test
void someIntegrationTest() throws Exception {

    Thread.sleep(5000);
    assertTrue(doSomething());
}
Finally, we can simulate a slow end-to-end user scenario:
@Test
void someEndToEndTest() throws Exception {

    Thread.sleep(10000);
    assertTrue(doSomething());
}
In the rest of the article, we’ll execute these test cases and determine their execution times.
3. IDE JUnit Runner
The quickest way to find the execution time of a JUnit test is to use our IDE. Since most IDEs come with embedded JUnit runner, they execute and report the test results.
The two most popular IDEs, IntelliJ and Eclipse, have embedded JUnit runners.
2.1. IntelliJ JUnit Runner
IntelliJ allows us to execute JUnit test cases with the help of run/debug configurations. Once we execute the tests, the runner shows the test status along with the execution time:
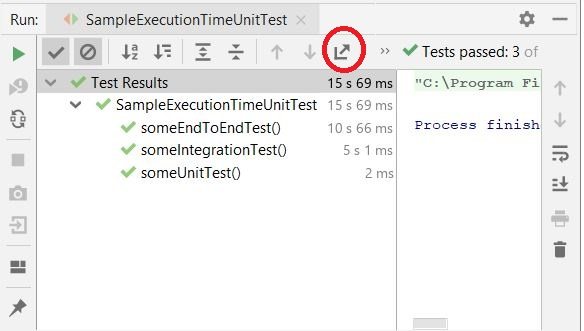
Since we executed all three of our example test cases, we can see the total execution time as well as the time taken by each test case.
We may also need to save such reports for future reference. IntelliJ allows us to export this report in either HTML or XML format. The export report function is highlighted on the toolbar in the screenshot above.
2.2. Eclipse JUnit Runner
Eclipse also provides an embedded JUnit runner. We can execute and find out the execution time of a single test case or an entire test suite in the test results window:
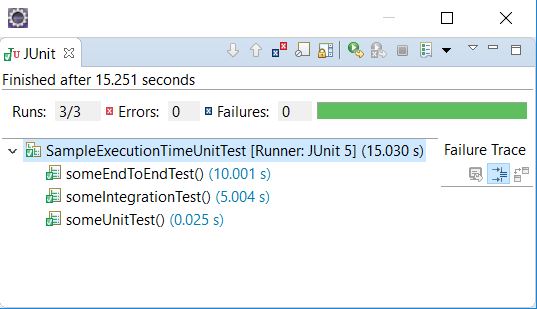
But, in contrast to the IntelliJ test runner, we cannot export a report from Eclipse.
3. Maven Surefire Plugin
The Maven Surefire plugin is used to execute unit tests during the test phase of the build lifecycle. The surefire plugin is part of the default Maven configuration. However, if a specific version or additional configuration is required, we can declare it in the pom.xml:
<plugin>
    <groupId>org.apache.maven.plugins</groupId>
    <artifactId>maven-surefire-plugin</artifactId>
    <version>3.0.0-M3</version>
    <configuration>
        <excludes>
            <exclude>**/*IntegrationTest.java</exclude>
        </excludes>
    </configuration>
    <dependencies>
        <dependency>
            <groupId>org.junit.platform</groupId>
            <artifactId>junit-platform-surefire-provider</artifactId>
            <version>1.3.2</version>
        </dependency>
    </dependencies>
</plugin>
There are three ways to find the execution time of JUnit tests when testing with Maven. We’ll examine each one in the next subsections.
3.1. Maven Build Logs
Surefire displays the execution status and time of every test case in the build logs:
[INFO] Running com.baeldung.execution.time.SampleExecutionTimeUnitTest
[INFO] Tests run: 3, Failures: 0, Errors: 0, Skipped: 0, Time elapsed: 15.003 s
- in com.baeldung.execution.time.SampleExecutionTimeUnitTest
Here, it shows the combined execution time of all three test cases in the test class.
3.2. Surefire Test Reports
The surefire plugin also generates a test execution summary in .txt and .xml formats. These are generally stored in the target directory of the project. Surefire follows a standard format for both text reports:
----------------------------------------------
Test set: com.baeldung.execution.time.SampleExecutionTimeUnitTest
----------------------------------------------
Tests run: 3, Failures: 0, Errors: 0, Skipped: 0, Time elapsed: 15.003 s
- in com.baeldung.execution.time.SampleExecutionTimeUnitTest
and XML reports:
<?xml version="1.0" encoding="UTF-8"?>
<testsuite
	xmlns:xsi="http://www.w3.org/2001/XMLSchema-instance"
	xsi:noNamespaceSchemaLocation=
          "https://maven.apache.org/surefire/maven-surefire-plugin/xsd/surefire-test-report.xsd"
	name="com.baeldung.execution.time.SampleExecutionTimeUnitTest"
	time="15.003" tests="3" errors="0" skipped="0" failures="0">
	<testcase name="someEndToEndTest"
		classname="com.baeldung.execution.time.SampleExecutionTimeUnitTest"
		time="9.996" />
	<testcase name="someIntegrationTest"
		classname="com.baeldung.execution.time.SampleExecutionTimeUnitTest"
		time="5.003" />
	<testcase name="someUnitTest"
		classname="com.baeldung.execution.time.SampleExecutionTimeUnitTest"
		time="0.002" />
</testsuite>
Although the text format is more suited for readability, the XML format is machine-readable and can be imported for visualization in HTML and other tools.
3.3. Surefire HTML Reports
We can view our test report in HTML in our browser by using the maven-surefire-report-plugin:
<reporting>
    <plugins>
        <plugin>
            <groupId>org.apache.maven.plugins</groupId>
            <artifactId>maven-surefire-report-plugin</artifactId>
            <version>3.0.0-M3</version>
        </plugin>
    </plugins>
</reporting>
We can now execute mvn commands to generate the report:
- mvn surefire-report:report – executes the tests and generates an HTML report
- mvn site – adds CSS styling to the HTML generated in the last step
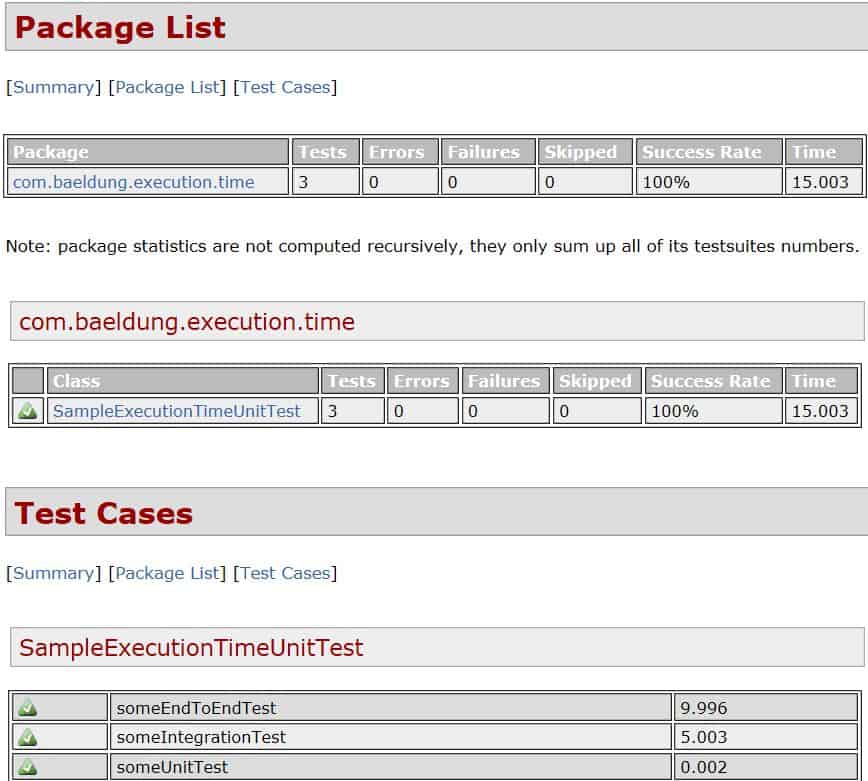
This report shows the execution time of all the test cases in a class or a package along with the time taken by each test case.
4. Jenkins Test Results
If we are running CI in Jenkins, we can import the XML files written by surefire. This allows Jenkins to mark a build as failed if the tests fail, and to show us test trends and results.
When we review the test results in Jenkins, we also see the execution times.
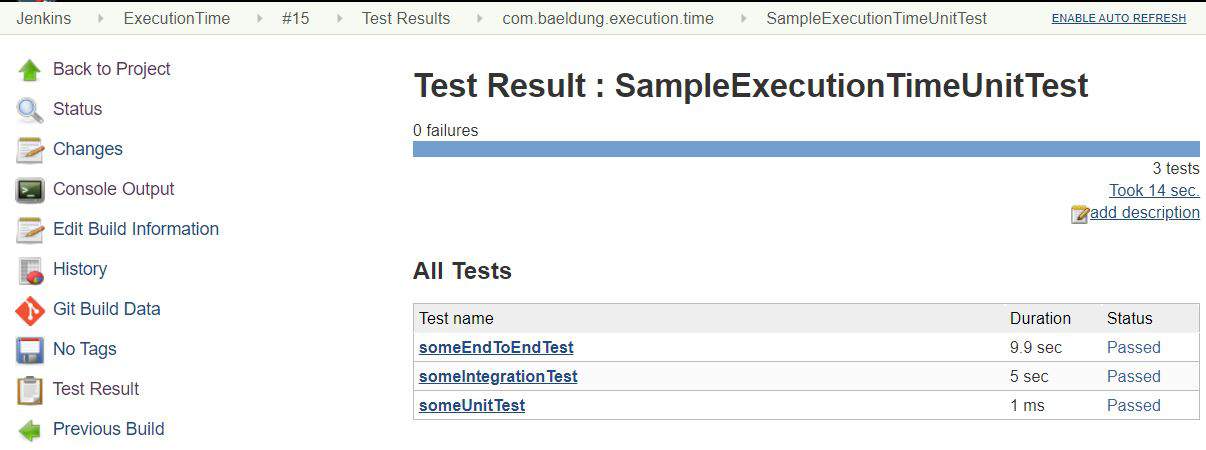
For our example, after installing Jenkins, we’ll configure a job using Maven and the surefire XML report files to publish the test results:

We added a post-build action in our job to publish the test results. Jenkins will now import the XML files from the given path and add this report to the build execution summary:
This can also be achieved using Jenkins pipeline builds.
5. Conclusion
In this article, we discussed various ways of determining the execution time of JUnit tests. The most immediate method is to use our IDE’s JUnit runner.
We then used the maven-surefire-plugin to archive the test reports in text, XML, and HTML formats.
Finally, we provided our test report output to our CI server, which can help us analyze how different builds performed.


