What Happens When the JVM Runs Out of Memory to Allocate During Runtime?
Last updated: January 8, 2024


Mocking is an essential part of unit testing, and the Mockito library makes it easy to write clean and intuitive unit tests for your Java code.
Get started with mocking and improve your application tests using our Mockito guide:
Handling concurrency in an application can be a tricky process with many potential pitfalls. A solid grasp of the fundamentals will go a long way to help minimize these issues.
Get started with understanding multi-threaded applications with our Java Concurrency guide:
Spring 5 added support for reactive programming with the Spring WebFlux module, which has been improved upon ever since. Get started with the Reactor project basics and reactive programming in Spring Boot:
Since its introduction in Java 8, the Stream API has become a staple of Java development. The basic operations like iterating, filtering, mapping sequences of elements are deceptively simple to use.
But these can also be overused and fall into some common pitfalls.
To get a better understanding on how Streams work and how to combine them with other language features, check out our guide to Java Streams:
Explore Spring Boot 3 and Spring 6 in-depth through building a full REST API with the framework:
Yes, Spring Security can be complex, from the more advanced functionality within the Core to the deep OAuth support in the framework.
I built the security material as two full courses - Core and OAuth, to get practical with these more complex scenarios. We explore when and how to use each feature and code through it on the backing project.
You can explore the course here:
Spring Data JPA is a great way to handle the complexity of JPA with the powerful simplicity of Spring Boot.
Get started with Spring Data JPA through the guided reference course:
Refactor Java code safely — and automatically — with OpenRewrite.
Refactoring big codebases by hand is slow, risky, and easy to put off. That’s where OpenRewrite comes in. The open-source framework for large-scale, automated code transformations helps teams modernize safely and consistently.
Each month, the creators and maintainers of OpenRewrite at Moderne run live, hands-on training sessions — one for newcomers and one for experienced users. You’ll see how recipes work, how to apply them across projects, and how to modernize code with confidence.
Join the next session, bring your questions, and learn how to automate the kind of work that usually eats your sprint time.
Yes, we're now running our only Summer Sale. All Courses are 30% off until 20th July, 2026:
Yes, we're now running our only Summer Sale. All Courses are 30% off until 20th July, 2026:
1. Overview
Defining an appropriate heap size for a JVM application is a crucial step. This might help our application with memory allocation and handling high loads. However, inefficient heap size, both too small or too big, might affect its performance.
In this tutorial, we’ll learn about the reason for OutOfMemoryErrors and its connection to the heap size. Also, we’ll check what we can do about this error and how we can investigate the root cause.
2. –Xmx and –Xms
We can control the heap allocation with two dedicated JVM flags. The first one, -Xms, helps us set the heap’s initial and minimal size. Another one, -Xmx, sets the maximum heap size. Several other flags can help allocate more dynamically, but they do a similar job overall.
Let’s check how these flags relate to each other and the OutOfMemoryError and how they can cause or prevent it. To begin with, let’s clarify the obvious thing: -Xms cannot be greater than -Xmx. If we don’t follow this rule, JVM will fail the application at the start:
$ java -Xms6g -Xmx4g
Error occurred during initialization of VM
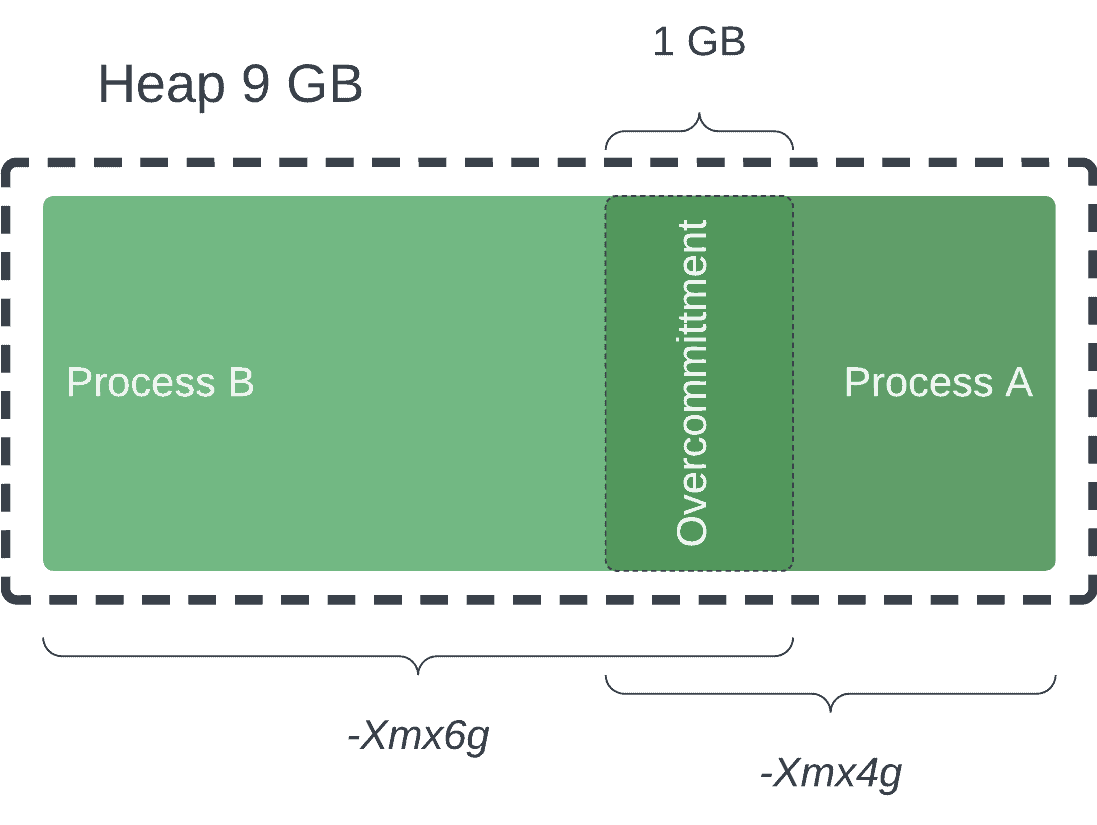
Initial heap size set to a larger value than the maximum heap sizeNow, let’s consider a more interesting scenario. What will happen if we try to allocate more memory than our physical RAM? It depends on the JVM version, architecture, operational system, etc. Some operating systems, like Linux, allow overcommitting and configure overcommitting directly. Others allow overcommitting but do this on their internal heuristics:
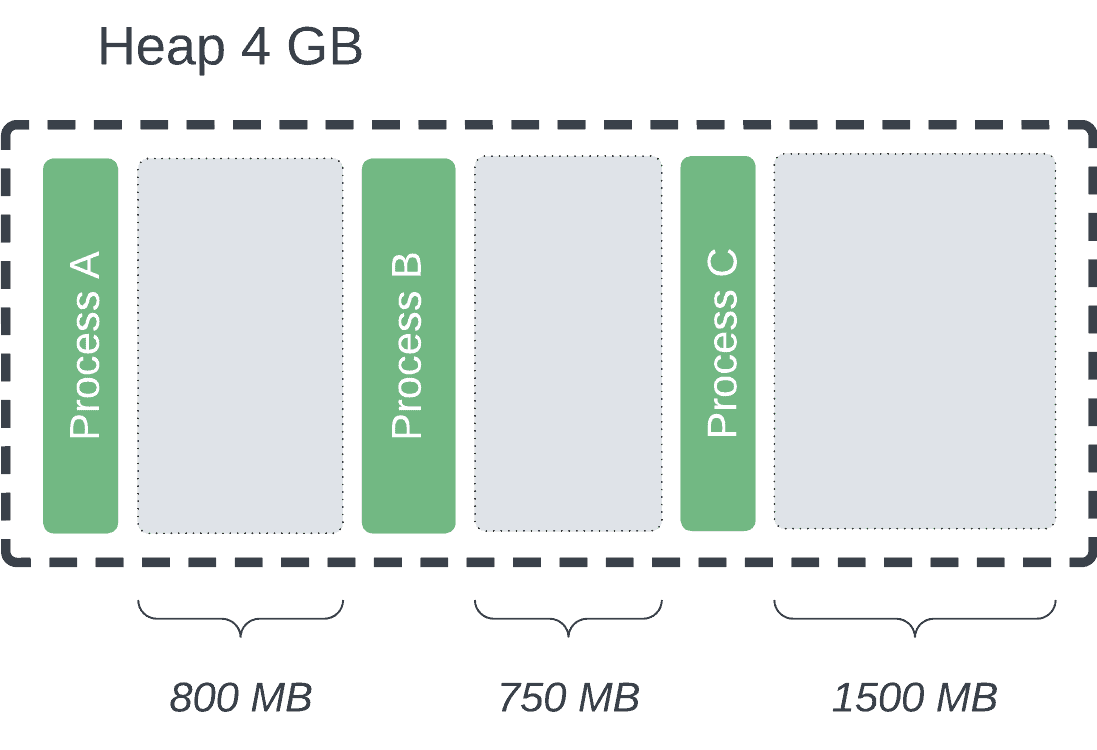
At the same time, we can fail to start an application even if we have enough physical memory because of high fragmentation. Let’s say we have 4 GB of physical RAM, where around 3 GB is available. Allocating a heap of 2 GB might be impossible as there are no contiguous segments of this size in RAM:
Some versions of JVMs, especially newer ones, don’t have such requirements. However, it might affect the object allocation during the runtime.
3. OutOfMemoryError During Runtime
Let’s say we started our application without any problems. We still have a chance to get OutOfMemoryError for several reasons.
3.1. Depleating Heap Space
The increase in memory consumption may be caused by natural causes, for example, increased activity in our web store during the festive season. Also, it might happen because of a memory leak. We can generally distinguish these two cases by checking the GC activity. At the same time, there might be a more complex scenario, such as finalization delays or slow garbage collection threads.
3.2. Overcommitting
Overcommitting is possible because of the swap space. We can extend our RAM by dumping some data on a disc. This might result in a significant slowdown, but at the same time, the app won’t fail. However, it might not be the best or desired solution to this problem. Also, the extreme case for swapping memory is thrashing, which might freeze the system.
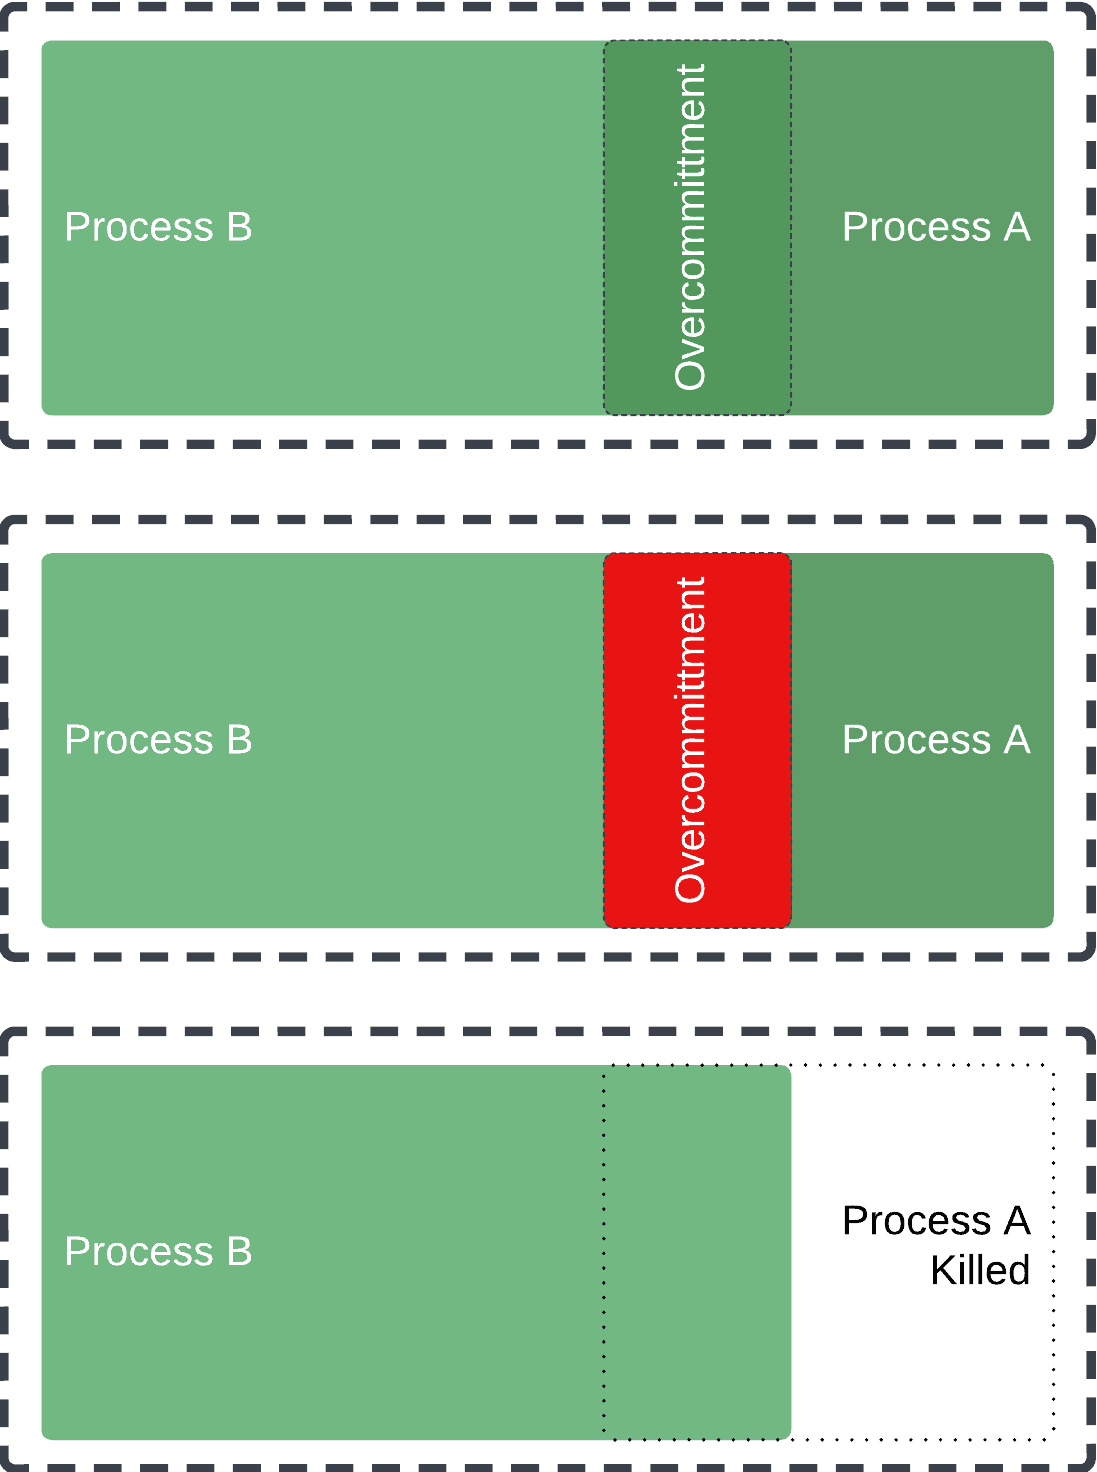
We can think about overcommitting as fractional reserve banking. The RAM doesn’t have all the required memory it promised to applications. However, when applications start to claim the memory they’re promised, the OS might start killing non-important applications to ensure that the rest won’t fail:
3.3. Shrinking Heap
This problem is connected to overcommitting, but the culprit is the garbage collection heuristic that tries to minimize the footprint. Even if the application successfully claimed the maximum heap size at some point in the lifecycle, it doesn’t mean that the next time will get it.
Garbage collectors might return some unused memory from the heap, and OS can reuse it for different purposes. At the same time, when the application tries to get it back, the RAM might be already allocated to some other application.
We can control it by setting -Xms and -Xmx to the same values. This way, we get more predictable memory consumption and avoid heap shrinking. However, this might affect resource utilization; thus, it should be used cautiously. Also, different JVM versions and garbage collectors might behave differently regarding heap shrinking.
4. OutOfMemoryError
Not all OutOfMemoryErrors are the same. We have a bunch of flavors, and knowing the difference between them might help us to identify the root cause. We’ll consider only those that are connected to the scenarios described earlier.
4.1. Java Heap Space
We can see the following message in the logs: java.lang.OutOfMemoryError: Java heap space. This describes the problem clearly: we don’t have space in the heap. The reasons for this might be either a memory leak or an increased load on the application. A significant difference in creation and removal rate might also cause this problem.
4.2. GC Overhead Limit Exceeded
Sometimes, the application might fail with: java.lang.OutOfMemoryError: GC Overhead limit exceeded. This happens when the application spends 98% on garbage collection, meaning the throughput is only 2%. This situation describes garbage collection thrashing: the application is active but without useful work.
4.3. Out of Swap Space
Another type of OutOfMemoryError is: java.lang.OutOfMemoryError: request size bytes for reason. Out of swap space? This is usually an indicator of overcommitting from the OS side. In this scenario, we still have the capacity in the heap, but the OS cannot provide us with more memory.
5. Root Cause
At the point when we get OutOfMemoryError, there’s little we can do in our application. Although catching errors is not recommended, it might be reasonable for cleanups or logging purposes in some cases. Sometimes, we can see the code that treats try-catch blocks to handle conditional logic. This is quite an expensive and unreliable hack, which should be avoided in most cases.
5.1. Garbage Collection Logs
While OutOfMemoryError provides information about the problem, it’s insufficient for a deeper analysis. The simplest way is to use garbage collection logs that don’t create much overhead while providing essential information about the running application.
5.2. Heap Dumps
Heap dumps yet another way to have a glance at the application. While we can capture it regularly, this might affect the applications’ performance. The cheapest way to use it is to do the heap dump automatically on OutOfMemoryError. Luckily, JVM allows us to set this using -XX:+HeapDumpOnOutOfMemoryError. Also, we can set the path for the heap dump with the -XX:HeapDumpPath flag.
5.3. Running Scripts on OutOfMemoryError
To enhance our experience with OutOfMemoryError, we can use -XX:OnOutOfMemoryError and direct it to the script that will run if the application runs out of memory. This can be used to implement a notification system, send the heap dump to some analysis tool, or restart the application.
6. Conclusion
In this article, we discussed OutOfMemoryError, which indicates a problem external to our application, like other errors. Handling these errors might create even more problems and leave our application inconsistent. The best way to handle this situation is to prevent it from happening in the first place.
Careful memory management and configuration of JVM can help us with this. Also, analyzing garbage collection logs can help us identify the problem’s reason. Allocating more memory to the application or using additional techniques to ensure that it would be kept alive without understanding the underlying problems isn’t the right solution and might cause more issues.


