How to Get the Number of Threads in a Java Process
Last updated: January 8, 2024


Mocking is an essential part of unit testing, and the Mockito library makes it easy to write clean and intuitive unit tests for your Java code.
Get started with mocking and improve your application tests using our Mockito guide:
Handling concurrency in an application can be a tricky process with many potential pitfalls. A solid grasp of the fundamentals will go a long way to help minimize these issues.
Get started with understanding multi-threaded applications with our Java Concurrency guide:
Spring 5 added support for reactive programming with the Spring WebFlux module, which has been improved upon ever since. Get started with the Reactor project basics and reactive programming in Spring Boot:
Since its introduction in Java 8, the Stream API has become a staple of Java development. The basic operations like iterating, filtering, mapping sequences of elements are deceptively simple to use.
But these can also be overused and fall into some common pitfalls.
To get a better understanding on how Streams work and how to combine them with other language features, check out our guide to Java Streams:
Explore Spring Boot 3 and Spring 6 in-depth through building a full REST API with the framework:
Yes, Spring Security can be complex, from the more advanced functionality within the Core to the deep OAuth support in the framework.
I built the security material as two full courses - Core and OAuth, to get practical with these more complex scenarios. We explore when and how to use each feature and code through it on the backing project.
You can explore the course here:
Spring Data JPA is a great way to handle the complexity of JPA with the powerful simplicity of Spring Boot.
Get started with Spring Data JPA through the guided reference course:
Refactor Java code safely — and automatically — with OpenRewrite.
Refactoring big codebases by hand is slow, risky, and easy to put off. That’s where OpenRewrite comes in. The open-source framework for large-scale, automated code transformations helps teams modernize safely and consistently.
Each month, the creators and maintainers of OpenRewrite at Moderne run live, hands-on training sessions — one for newcomers and one for experienced users. You’ll see how recipes work, how to apply them across projects, and how to modernize code with confidence.
Join the next session, bring your questions, and learn how to automate the kind of work that usually eats your sprint time.
Yes, we're now running our only Summer Sale. All Courses are 30% off until 20th July, 2026:
Yes, we're now running our only Summer Sale. All Courses are 30% off until 20th July, 2026:
1. Overview
Thread is the basic unit of concurrency in Java. In most cases, the throughput of an application increases when multiple threads are created to do tasks in parallel.
However, there’s always a saturation point. After all, the throughput of an application depends on CPU and memory resources. After a certain limit, increasing the number of threads can result in high memory, thread context switching, etc.
So a good starting point in troubleshooting a high memory issue in a Java application is to monitor the number of threads. In this tutorial, we’ll look at some ways we can check the number of threads created by a Java process.
2. Graphical Java Monitoring Tools
The simplest way to see the number of threads in Java is to use a graphical tool like Java VisualVM. Apart from the application threads, Java VisualVM also lists the GC or any other threads used by the application like JMX threads.
Furthermore, it also shows stats like thread states along with their duration:
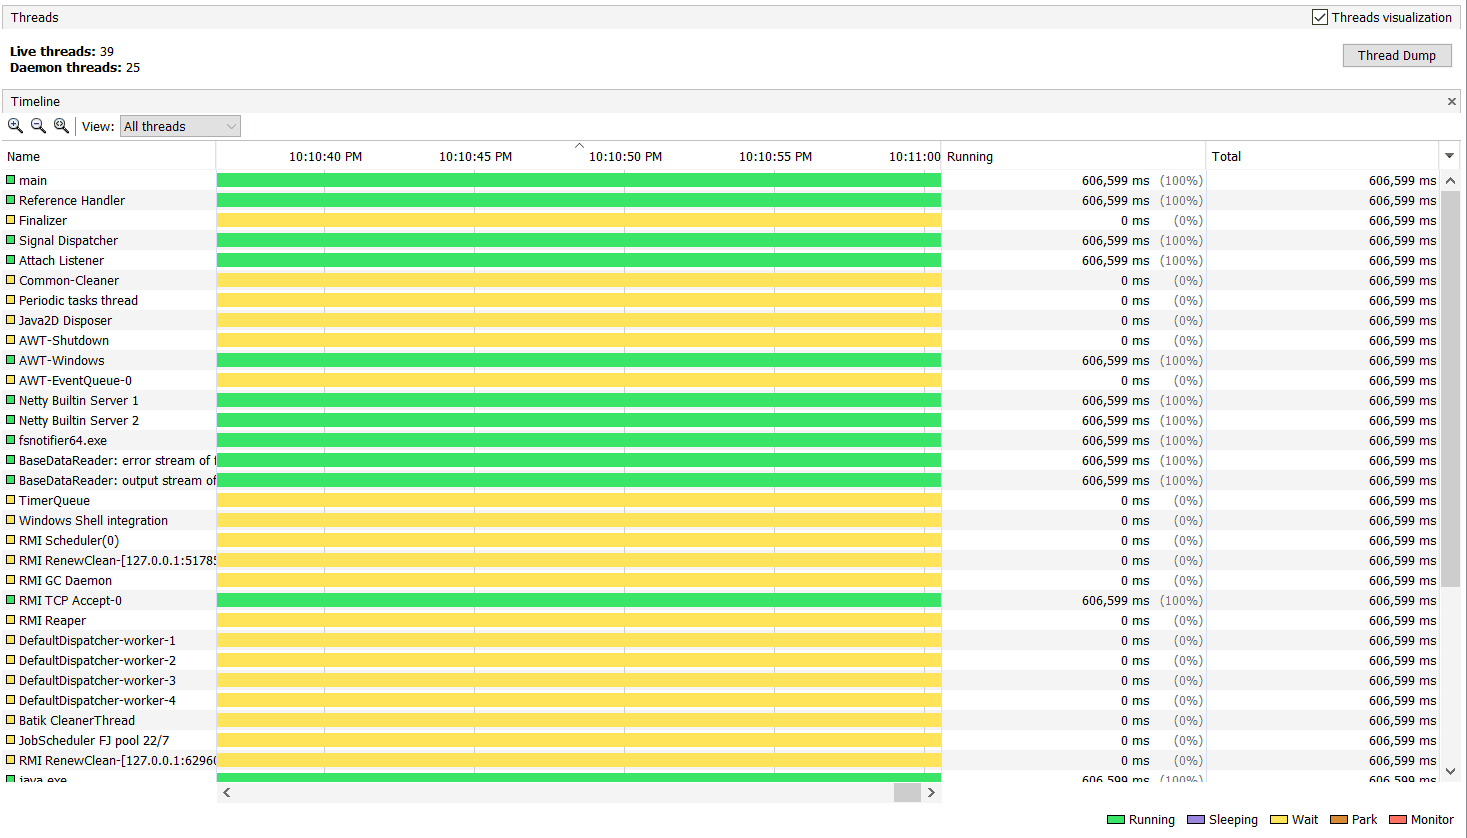
Monitoring the number of threads is the most basic feature in Java VisualVM. Generally speaking, graphical tools are more advanced and allow live monitoring of an application. For example, Java VisualVM allows us to sample our CPU stack traces and thus find a class or a method that may cause CPU bottleneck.
Java VisualVM is distributed with the JDK installation on Windows machines. For applications deployed on Linux, we need to connect to the application remotely. This requires JMX VM arguments.
Therefore, such tools won’t work if an application is already running without these parameters. In a later section, we’ll see how we can get the number of threads using command-line tools.
3. Java APIs
In some use cases, we may want to find the number of threads within the application itself. For example, to display on monitoring dashboards or exposing it in logs.
In such cases, we rely on Java APIs to get the thread count. Thankfully, there’s an activeCount() API in the Thread class:
public class FindNumberofThreads {
    public static void main(String[] args) {
        System.out.println("Number of threads " + Thread.activeCount());
    }
}
And the output will be:
Number of threads 2Notably, if we see the number of threads in Java VisualVM, we’ll see more threads for the same application. This is because activeCount() only returns the number of threads in the same ThreadGroup. Java divides all the threads into groups for easier management.
In this example, we have just the parent ThreadGroup, i.e., main:
public static void main(String[] args) {
    System.out.println("Current Thread Group - " + Thread.currentThread().getThreadGroup().getName());
}
Current Thread Group - mainIf there are many thread groups in a Java application, activeCount() won’t give a correct output. For example, it won’t return the number of GC threads.
In such scenarios, we can use the JMX API:
public static void main(String[] args) {
    System.out.println("Total Number of threads " + ManagementFactory.getThreadMXBean().getThreadCount());
}
This API returns the total number of threads from all thread groups, GC, JMX, etc.:
Total Number of threads 6As a matter of fact, the JMX graphical tools like Java VisualVM use the same API for their data.
4. Command-Line Tools
Previously, we discussed Java VisualVM, a graphical tool for analyzing live threads in an application. Although it’s a great tool for live visualization of threads, it has a minor impact on application performance. And hence it’s not recommended for production environments.
Moreover, as we discussed, Java VisualVM requires remote connectivity in Linux. And in fact, in some cases, it requires additional configuration. For example, an application running inside a Docker or Kubernetes would require additional service and port configuration.
In such cases, we have to rely on command-line tools in the host environment to get the thread count.
Luckily, Java provides few commands to take a thread dump. We can analyze a thread dump either as a text file or use a thread dump analyzer tool to check the number of threads along with their state.
Alibaba Arthas is another great command-line tool that doesn’t require remote connectivity or any special configuration.
Additionally, we can get information about threads from a few Linux commands as well. For example, we can use the top command to display all the threads of any Java application:
top -H -p 1Here, -H is a command-line option to display every thread in a Java process. Without this flag, the top command will display combined stats for all threads in the process. The -p option filters the output by process id of the target application:
top - 15:59:44 up 7 days, 19:23,  0 users,  load average: 0.52, 0.41, 0.36
Threads:  37 total,   0 running,  37 sleeping,   0 stopped,   0 zombie
%Cpu(s):  3.2 us,  2.2 sy,  0.0 ni, 93.4 id,  0.8 wa,  0.0 hi,  0.3 si,  0.0 st
MiB Mem :   1989.2 total,    110.2 free,   1183.1 used,    695.8 buff/cache
MiB Swap:   1024.0 total,    993.0 free,     31.0 used.    838.8 avail Mem

  PID USER      PR  NI    VIRT    RES    SHR S  %CPU  %MEM     TIME+ COMMAND
   1 flink     20   0 2612160 304084  29784 S   0.0  14.9   0:00.07 java
  275 flink     20   0 2612160 304084  29784 S   0.0  14.9   0:02.87 java
  276 flink     20   0 2612160 304084  29784 S   0.0  14.9   0:00.37 VM Thread
  277 flink     20   0 2612160 304084  29784 S   0.0  14.9   0:00.00 Reference Handl
  278 flink     20   0 2612160 304084  29784 S   0.0  14.9   0:00.00 Finalizer
  279 flink     20   0 2612160 304084  29784 S   0.0  14.9   0:00.00 Signal Dispatch
As seen above, it shows the thread id, i.e., PID and per-thread CPU and memory utilization. Similar to Java VisualVM, the top command will list all the threads, including GC, JMX, or any other sub-process.
To find the process ID we used as an argument in the above command, we can use the ps command:
ps -ef | grep javaAs a matter of fact, we can use the ps command to list the threads as well:
ps -e -T | grep 1The -T option tells the ps command to list all the threads started by the application:
1     1 ?        00:00:00 java
1   275 ?        00:00:02 java
1   276 ?        00:00:00 VM Thread
1   277 ?        00:00:00 Reference Handl
1   278 ?        00:00:00 Finalizer
1   279 ?        00:00:00 Signal Dispatch
1   280 ?        00:00:03 C2 CompilerThre
1   281 ?        00:00:01 C1 CompilerThre
Here, the first column is the PID, and the second column shows the Linux thread ID for each thread.
5. Conclusion
In this article, we saw that there are various ways we can find the number of threads in a Java application. In most cases, using the command-line options like the top or ps command should be the go-to way.


