

Mocking is an essential part of unit testing, and the Mockito library makes it easy to write clean and intuitive unit tests for your Java code.
Get started with mocking and improve your application tests using our Mockito guide:
Handling concurrency in an application can be a tricky process with many potential pitfalls. A solid grasp of the fundamentals will go a long way to help minimize these issues.
Get started with understanding multi-threaded applications with our Java Concurrency guide:
Spring 5 added support for reactive programming with the Spring WebFlux module, which has been improved upon ever since. Get started with the Reactor project basics and reactive programming in Spring Boot:
Since its introduction in Java 8, the Stream API has become a staple of Java development. The basic operations like iterating, filtering, mapping sequences of elements are deceptively simple to use.
But these can also be overused and fall into some common pitfalls.
To get a better understanding on how Streams work and how to combine them with other language features, check out our guide to Java Streams:
Explore Spring Boot 3 and Spring 6 in-depth through building a full REST API with the framework:
Yes, Spring Security can be complex, from the more advanced functionality within the Core to the deep OAuth support in the framework.
I built the security material as two full courses - Core and OAuth, to get practical with these more complex scenarios. We explore when and how to use each feature and code through it on the backing project.
You can explore the course here:
Spring Data JPA is a great way to handle the complexity of JPA with the powerful simplicity of Spring Boot.
Get started with Spring Data JPA through the guided reference course:
Refactor Java code safely — and automatically — with OpenRewrite.
Refactoring big codebases by hand is slow, risky, and easy to put off. That’s where OpenRewrite comes in. The open-source framework for large-scale, automated code transformations helps teams modernize safely and consistently.
Each month, the creators and maintainers of OpenRewrite at Moderne run live, hands-on training sessions — one for newcomers and one for experienced users. You’ll see how recipes work, how to apply them across projects, and how to modernize code with confidence.
Join the next session, bring your questions, and learn how to automate the kind of work that usually eats your sprint time.
1. Overview
Sometimes writing code that just runs isn’t enough. We might want to know what goes on internally, such as how memory is allocated, the consequences of using one coding approach over another, the implications of concurrent executions, areas to improve performance, etc. We can use profilers for this.
A Java Profiler is a tool that monitors Java bytecode constructs and operations at the JVM level. These code constructs and operations include object creation, iterative executions (including recursive calls), method executions, thread executions, and garbage collections.
In this tutorial, we’ll explore the main Java Profilers: JProfiler, YourKit, Java VisualVM, the Netbeans Profiler, and the IntelliJ Profiler.
2. JProfiler
JProfiler is a top choice for many developers. With an intuitive UI, JProfiler provides interfaces for viewing system performance, memory usage, potential memory leaks, and thread profiling.
With this information, we can easily see what we need to optimize, eliminate, or change in the underlying system.
This product requires the purchase of a license, but also offers a free trial.
Here’s what the JProfiler’s interface looks like:
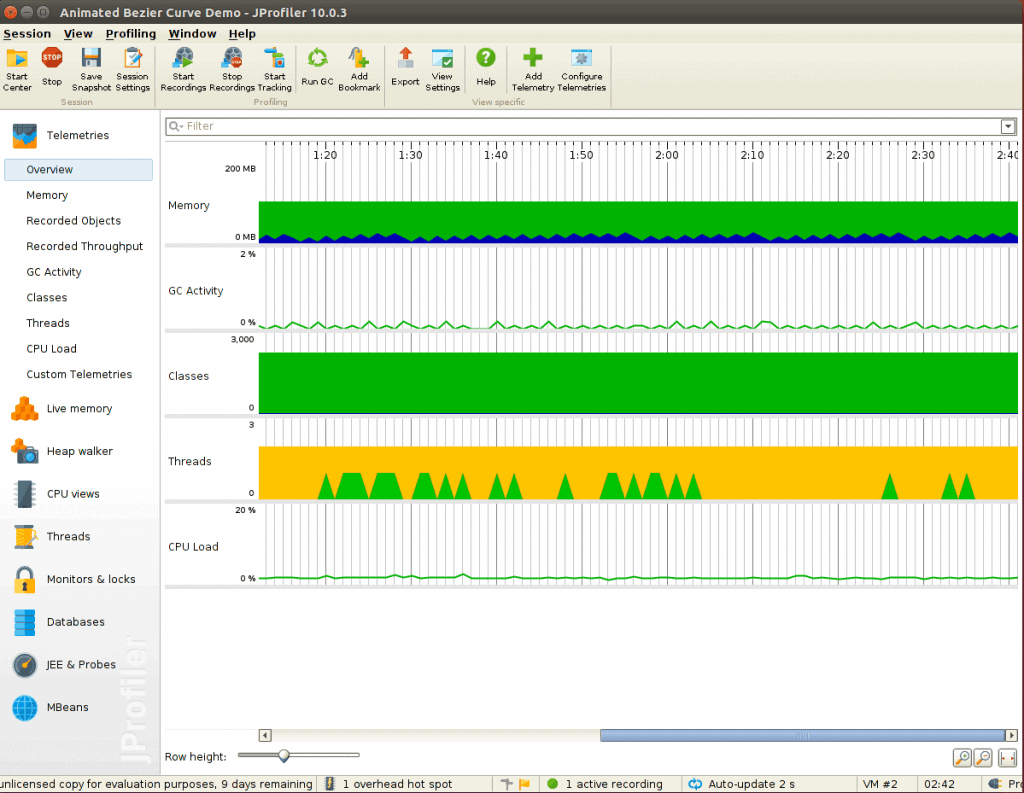 JProfiler overview interface with features
Like most profilers, we can use this tool for both local and remote applications. This means that it’s possible to profile Java applications running on remote machines without having to install anything on them.
JProfiler also provides advanced profiling for both SQL and NoSQL databases. It provides specific support for profiling JDBC, JPA/Hibernate, MongoDB, Casandra, and HBase databases.
The below screenshot shows the JDBC probing interface with a list of current connections:
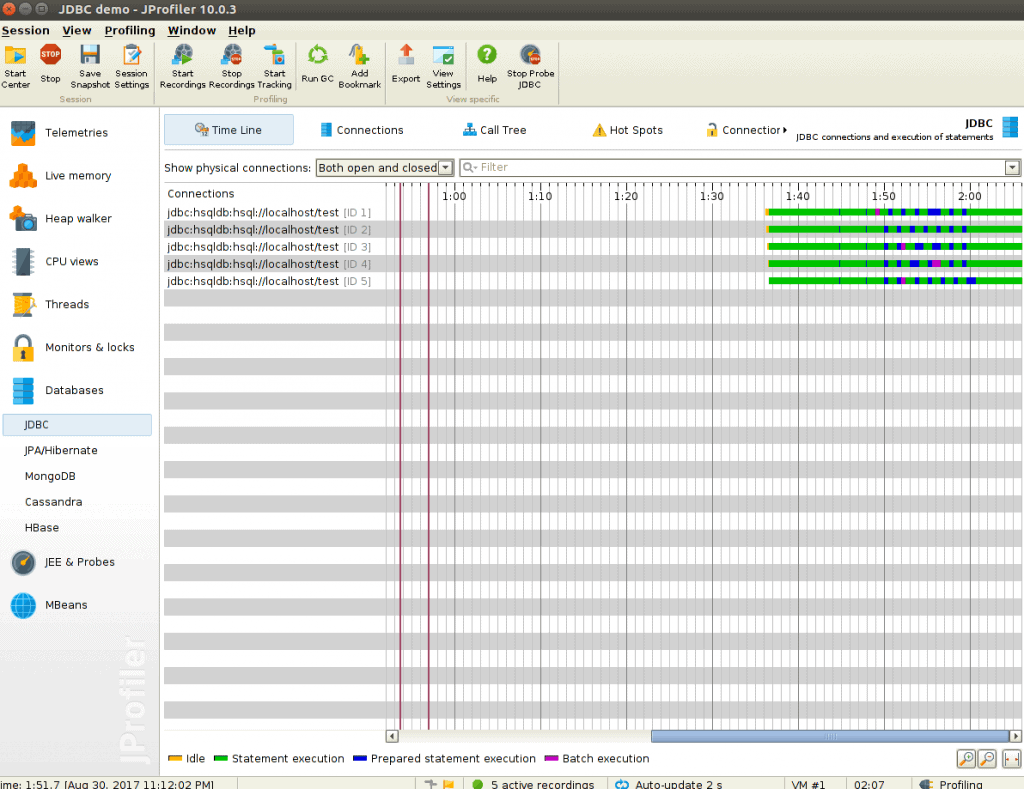 JProfiler database probing view
If we’re keen on learning about the call tree of interactions with our database and seeing connections that may be leaked, JProfiler nicely handles this.
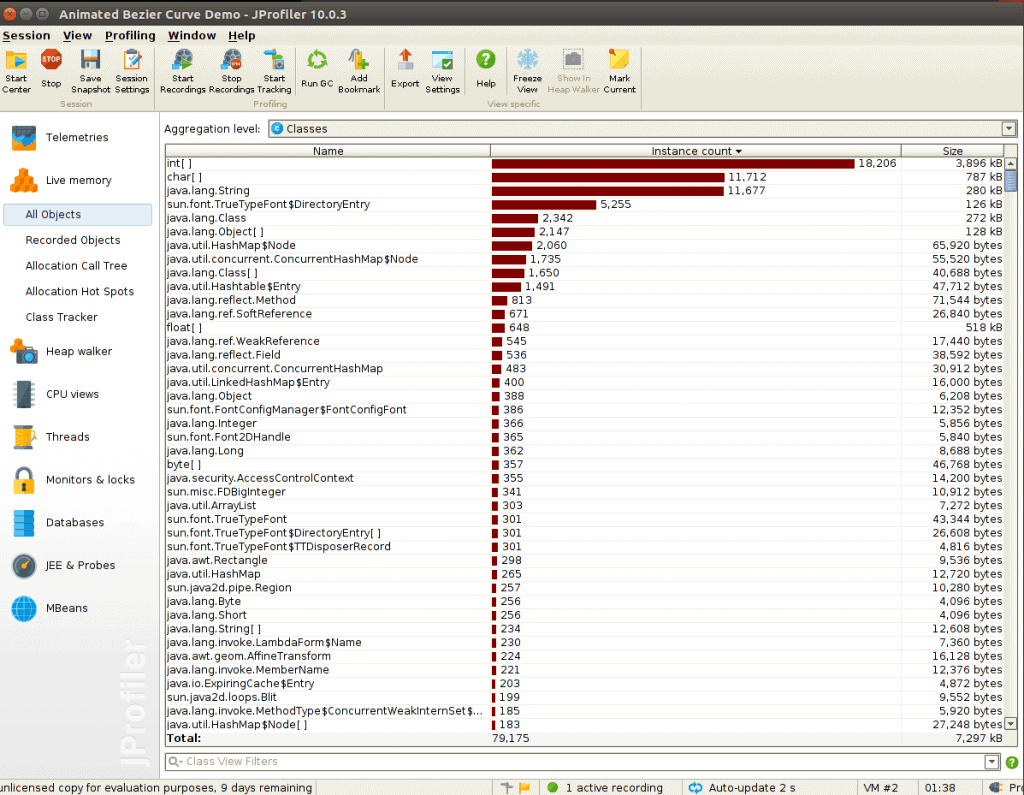
Live Memory is one feature of JProfiler that allows us to see current memory usage by our application. We can view memory usage for object declarations and instances, or for the full call tree.
For the allocation call tree, we can choose to view the call tree of live objects, garbage-collected objects, or both. We can also decide if this allocation tree should be for a particular class or package, or all classes.
The screen below shows the live memory usage by all objects with instance counts:
JProfiler supports integration with popular IDEs, such as Eclipse, NetBeans, and IntelliJ. It’s even possible to navigate from snapshot to source code.
3. YourKit
YourKit Java Profiler runs on many different platforms, and provides separate installations for each supported operating system (Windows, MacOS, Linux, Solaris, FreeBSD, etc.).
Like JProfiler, YourKit has core features for visualizing threads, garbage collections, memory usage, and memory leaks with support for local and remote profiling via ssh tunneling.
YourKit offers paid licenses for commercial use, which include a free trial, and lower cost or free licenses for non-commercial use.
Here’s a quick look at the memory profiling results of a Tomcat server application:
 YourKit Java Profiler memory profiling of Tomcat server application
YourKit also comes in handy when we want to profile thrown exceptions. We can easily find out what types of exceptions were thrown, and the number of times each exception occurred.
YourKit has an interesting CPU profiling feature that allows focused profiling on certain areas of our code, such as methods or subtrees in threads. This is very powerful, as it allows for conditional profiling through its what-if feature.
Figure 5 shows an example of the thread-profiling interface:
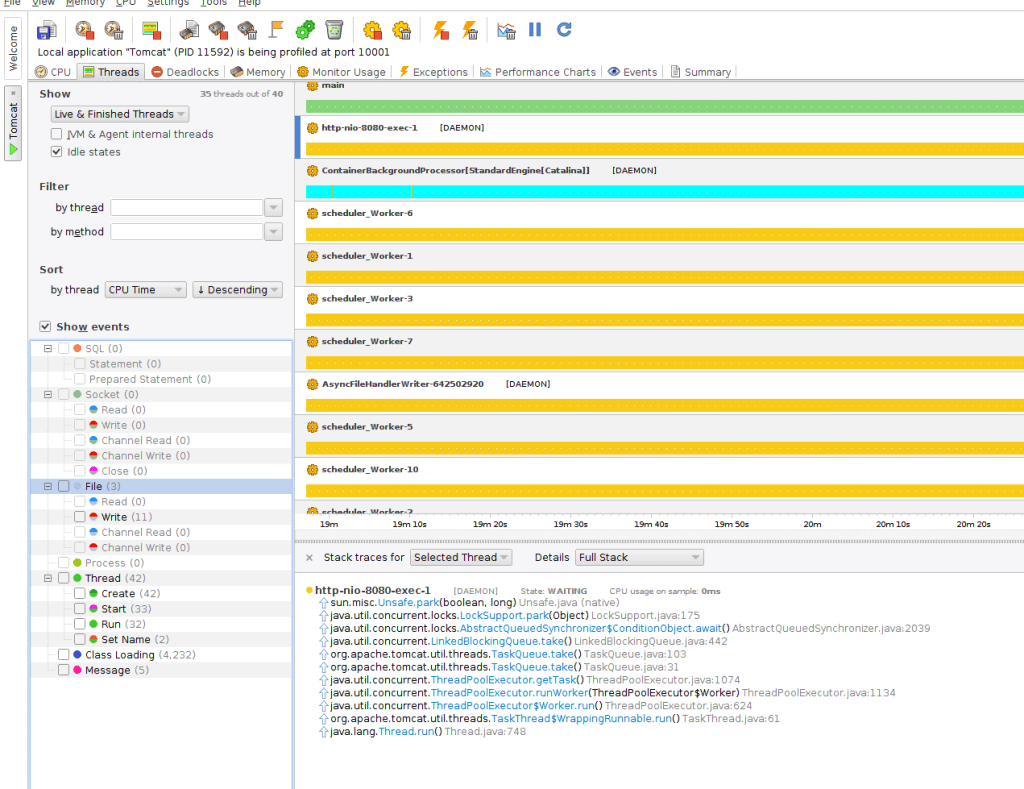 Figure 5. YourKit Java Profiler threads profiling interface
We can also profile SQL and NoSQL database calls with YourKit. It even provides a view for actual queries that were executed.
Though this isn’t a technical consideration, the permissive licensing model of YourKit makes it a good choice for multi-user or distributed teams, as well as for single-license purchases.
4. Java VisualVM
Java VisualVM is a simplified, yet robust profiling tool for Java applications. This is a free, open-source profiler.
This tool was bundled with the Java Development Kit (JDK) up to JDK 8, but was removed in JDK 9, and is now distributed as a standalone tool: VisualVM Download.
Its operation relies on other standalone tools provided in the JDK, such as JConsole, jstat, jstack, jinfo, and jmap.
Below we can see a simple overview interface of an ongoing profiling session using Java VisualVM:
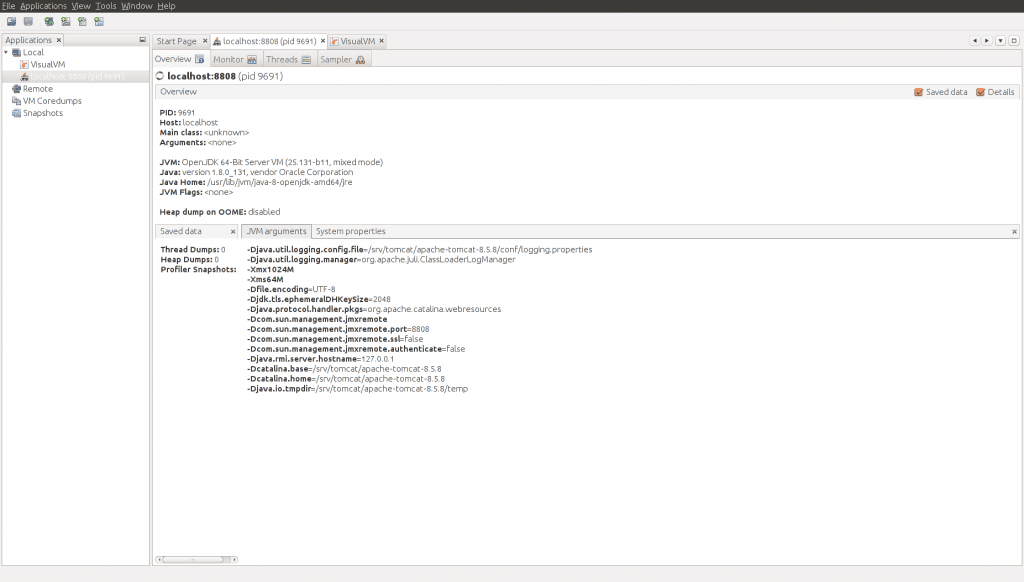 Java VisualVM local tomcat server app profiling
One interesting advantage of Java VisualVM is that we can extend it to develop new functionalities as plugins. We can then add these plugins to Java VisualVM’s built-in update center.
Java VisualVM supports local and remote profiling, as well as memory and CPU profiling. Connecting to remote applications requires providing credentials (hostname/IP and password as necessary), but doesn’t provide support for ssh tunneling. We can also choose to enable real-time profiling with instant updates (typically every 2 seconds).
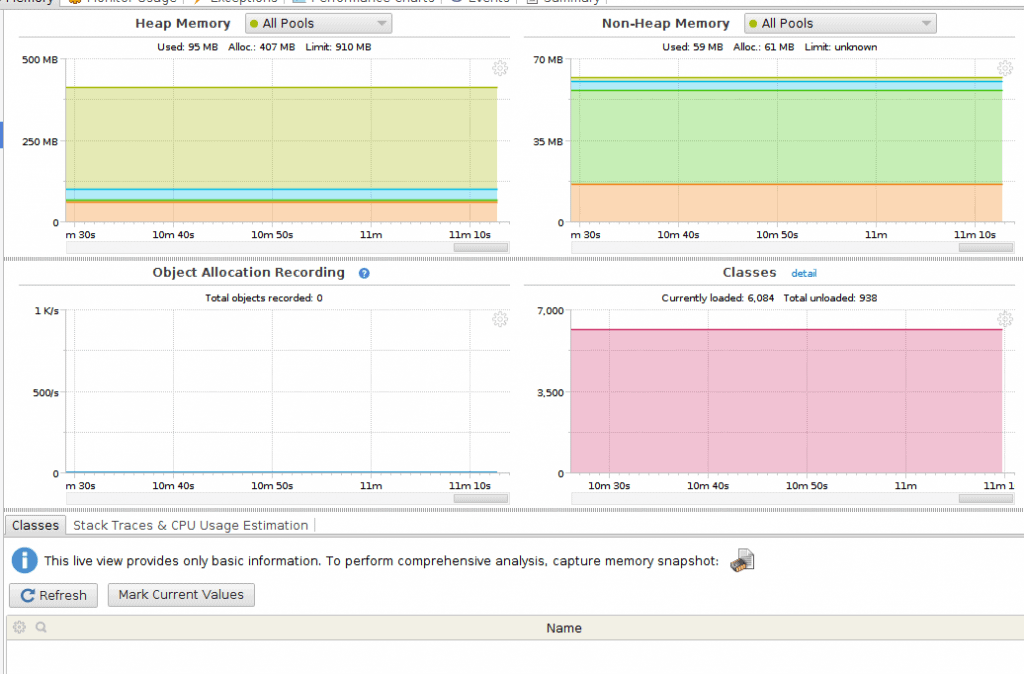
Below we can see the memory outlook of a Java application profiled using Java VisualVM:
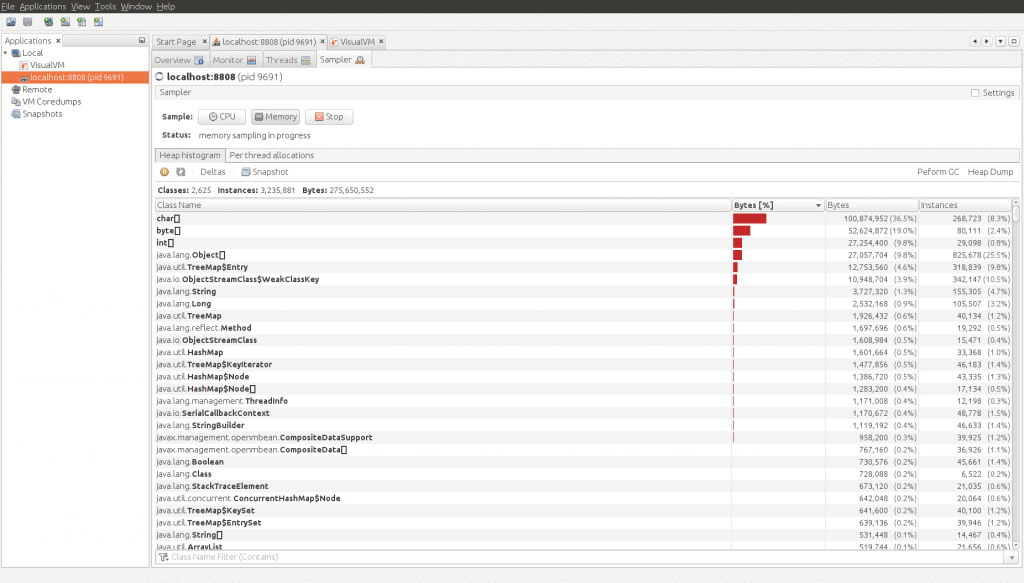 Java VisualVM memory heap histogram
With the snapshot feature of Java VisualVM, we can take snapshots of profiling sessions for later analysis.
5. NetBeans Profiler
The NetBeans Profiler is bundled with Oracle’s open-source NetBeans IDE.
While this profiler shares a lot of similarities with Java VisualVM, it’s a good choice when we want everything wrapped in one program (IDE + Profiler). All the other profilers discussed above provide plugins to enhance IDEs integration.
The below screenshot shows an example of the NetBeans Profiler interface:
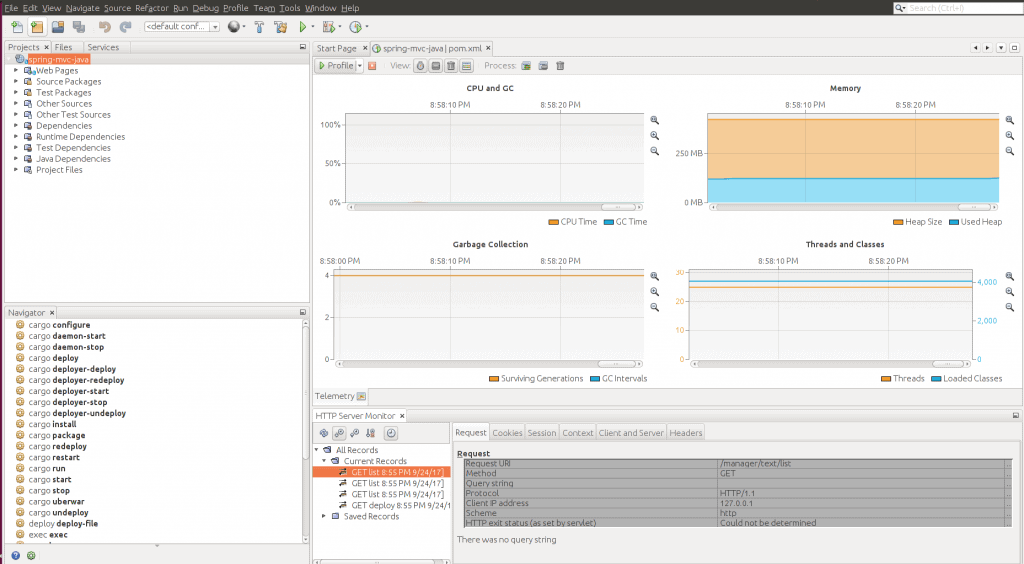 Netbeans Profiler telemetry interface
Netbeans Profiler is also a good choice for lightweight development and profiling. It provides a single window for configuring and controlling the profiling session and displaying the results. It provides the unique feature of knowing how often garbage collection occurs.
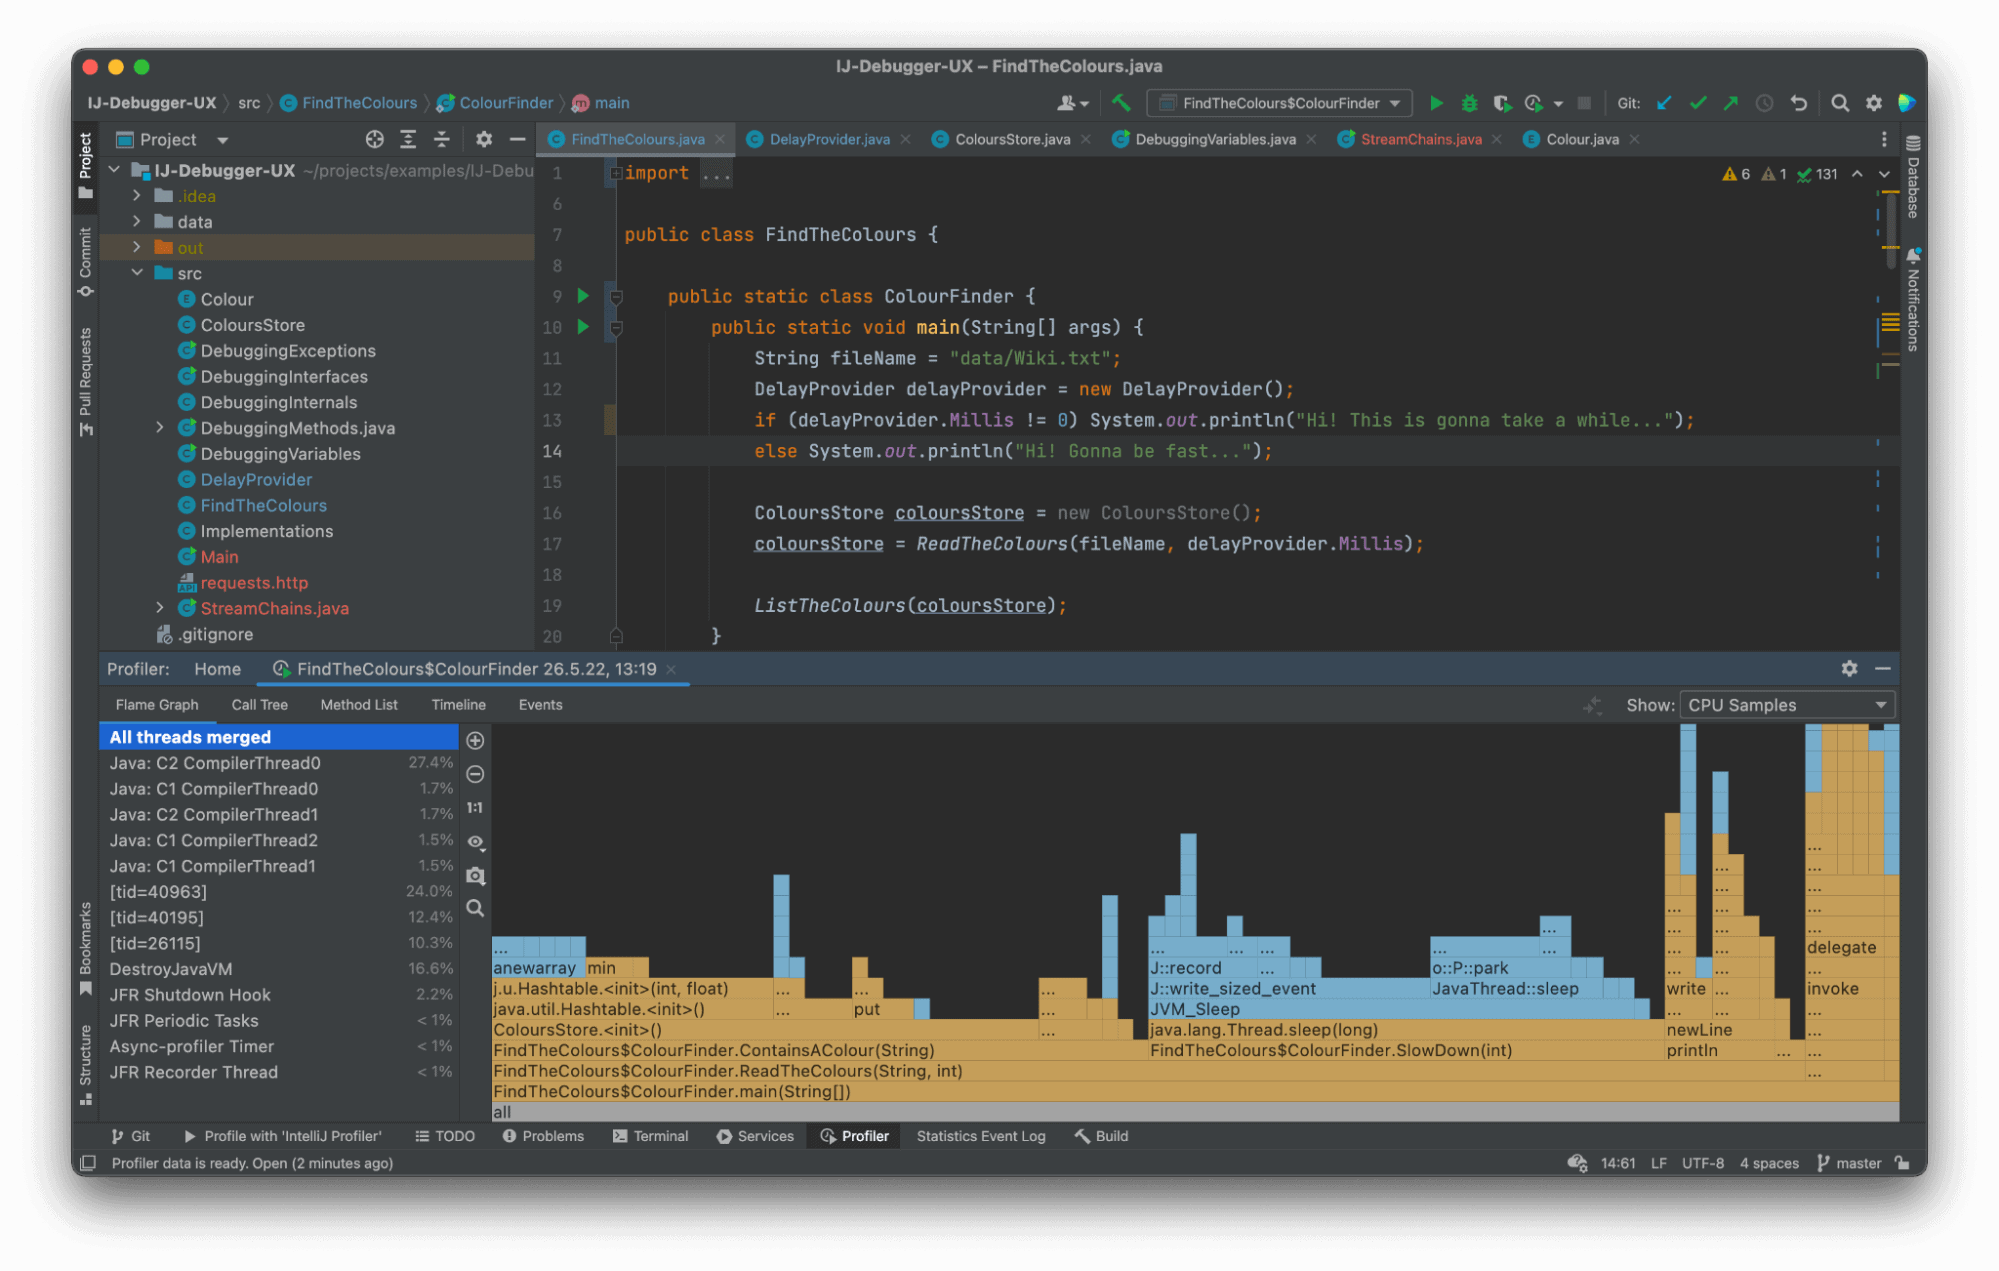
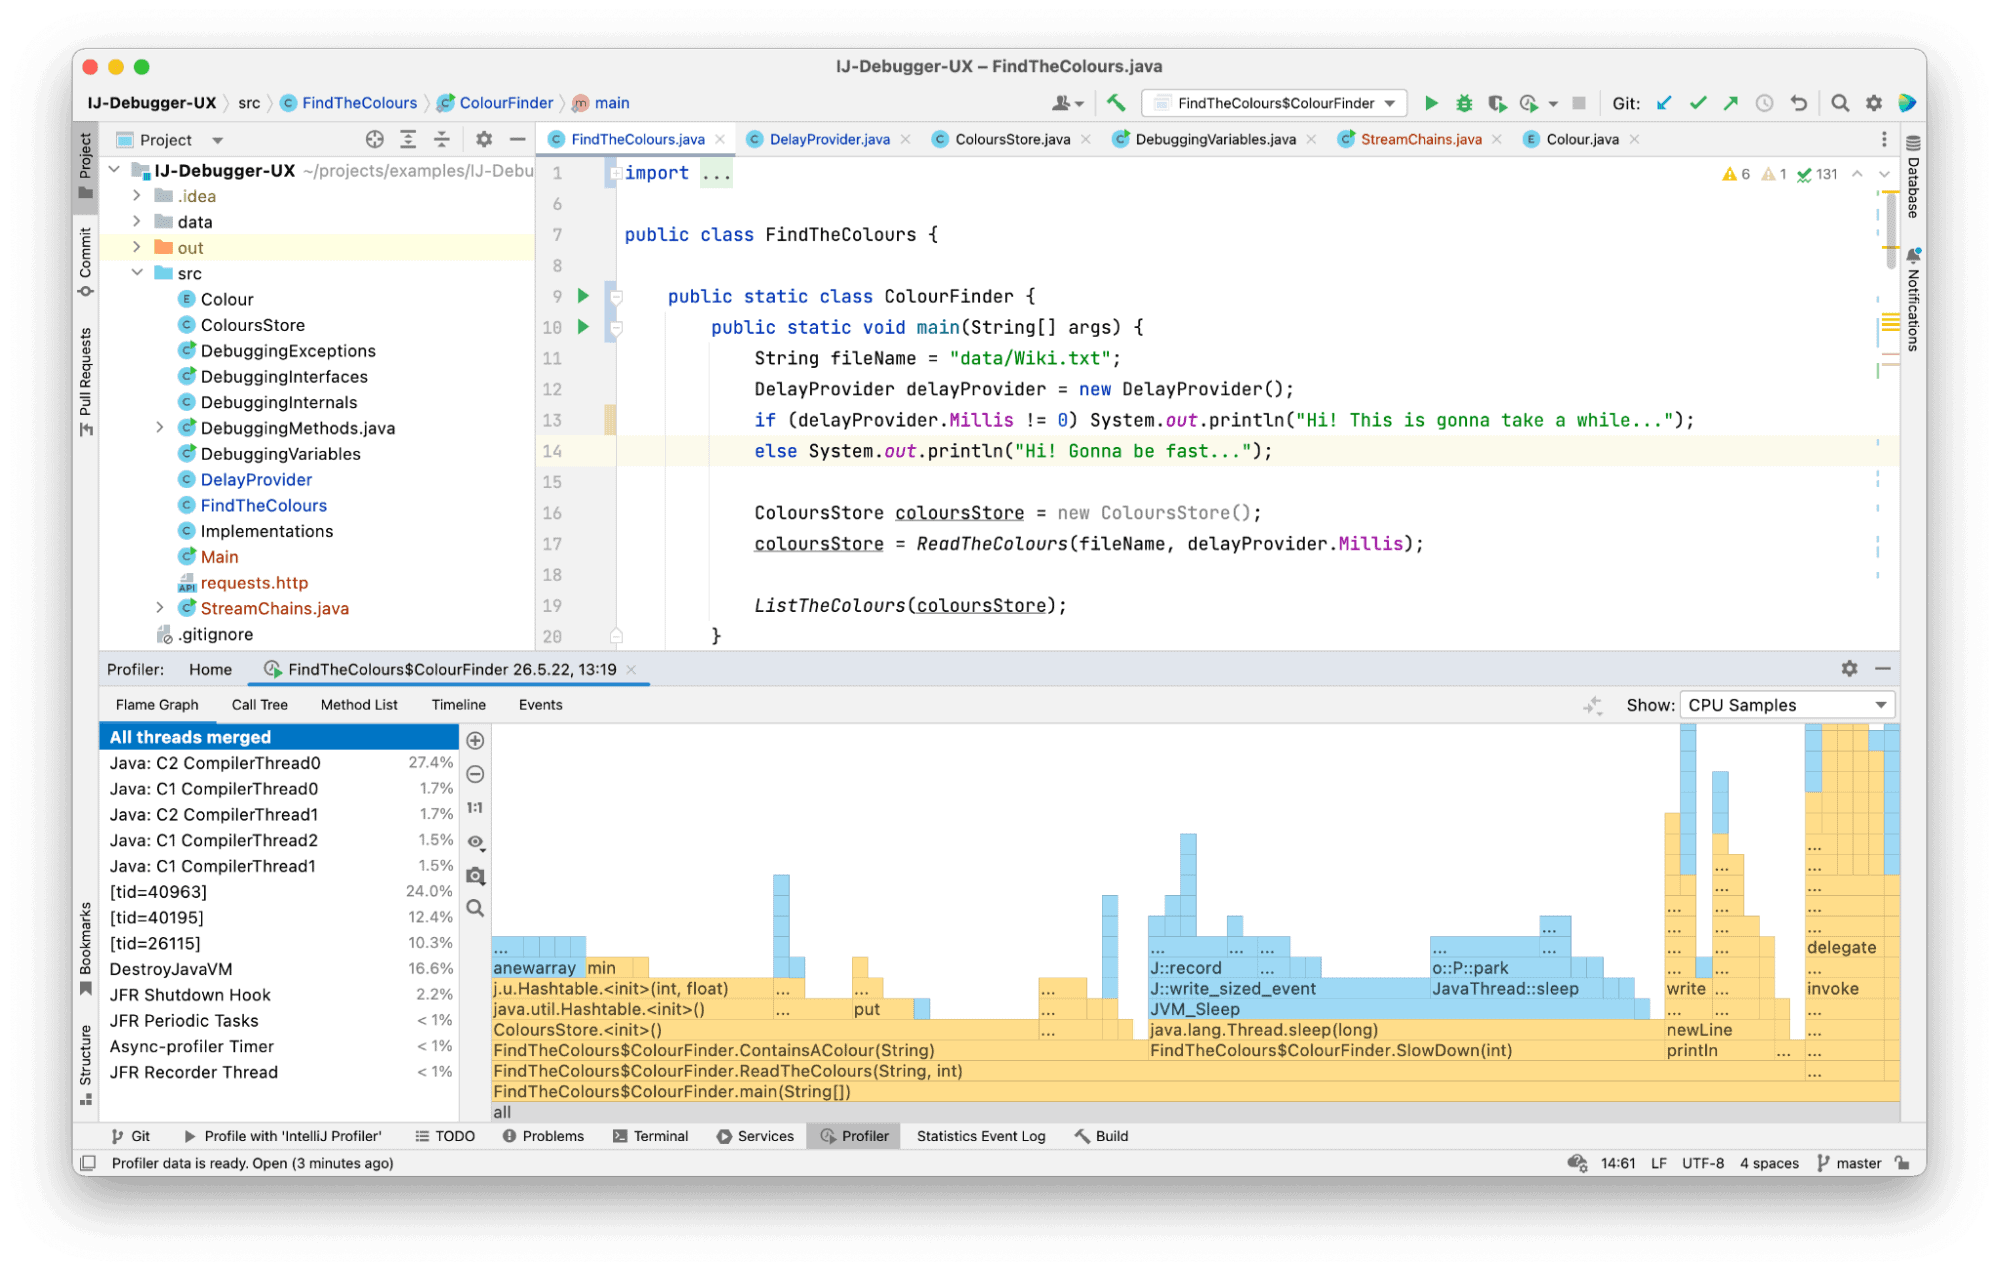
6. IntelliJ Profiler
IntelliJ Profiler is a simple, yet powerful tool for CPU and memory allocations profiling. It combines the power of two popular Java profilers: JFR and Async profiler.
While there are some advanced features, the main focus is on ease of use. IntelliJ Profiler allows us to get started in a few clicks without any kind of configuration, while providing helpful features to assist in our day-to-day development work.
As part of IntelliJ IDEA Ultimate, IntelliJ Profiler can be attached to a process with a single click, and we can navigate between a snapshot and the source code as if they were one. Its other features, like differential flame graphs, allow us to visually assess the performance of different approaches and get insight into the runtime operations quickly and efficiently:
IntelliJ Profiler works on Windows, Linux, and macOS.
7. Other Solid Profilers
Some honorable mentions here are Java Mission Control, New Relic, and Prefix (from Stackify). These have less market share overall, but definitely do deserve a mention. For example, Stackify’s Prefix is an excellent lightweight profiling tool, well-suited for profiling not only Java applications, but other web applications as well.
8. Conclusion
In this article, we discussed profiling and Java Profilers. We looked at the features of each Profiler, and what informs the potential choice of one over another.
There are many Java profilers available, with some having unique characteristics. The choice of which Java profiler to use, as we’ve seen in this article, is mostly dependent on a developer’s selection of tools, the level of analysis required, and the features of the profiler.


