

Mocking is an essential part of unit testing, and the Mockito library makes it easy to write clean and intuitive unit tests for your Java code.
Get started with mocking and improve your application tests using our Mockito guide:
Handling concurrency in an application can be a tricky process with many potential pitfalls. A solid grasp of the fundamentals will go a long way to help minimize these issues.
Get started with understanding multi-threaded applications with our Java Concurrency guide:
Spring 5 added support for reactive programming with the Spring WebFlux module, which has been improved upon ever since. Get started with the Reactor project basics and reactive programming in Spring Boot:
Since its introduction in Java 8, the Stream API has become a staple of Java development. The basic operations like iterating, filtering, mapping sequences of elements are deceptively simple to use.
But these can also be overused and fall into some common pitfalls.
To get a better understanding on how Streams work and how to combine them with other language features, check out our guide to Java Streams:
Explore Spring Boot 3 and Spring 6 in-depth through building a full REST API with the framework:
Yes, Spring Security can be complex, from the more advanced functionality within the Core to the deep OAuth support in the framework.
I built the security material as two full courses - Core and OAuth, to get practical with these more complex scenarios. We explore when and how to use each feature and code through it on the backing project.
You can explore the course here:
Spring Data JPA is a great way to handle the complexity of JPA with the powerful simplicity of Spring Boot.
Get started with Spring Data JPA through the guided reference course:
Refactor Java code safely — and automatically — with OpenRewrite.
Refactoring big codebases by hand is slow, risky, and easy to put off. That’s where OpenRewrite comes in. The open-source framework for large-scale, automated code transformations helps teams modernize safely and consistently.
Each month, the creators and maintainers of OpenRewrite at Moderne run live, hands-on training sessions — one for newcomers and one for experienced users. You’ll see how recipes work, how to apply them across projects, and how to modernize code with confidence.
Join the next session, bring your questions, and learn how to automate the kind of work that usually eats your sprint time.
1. Introduction
Alibaba Arthas is a diagnostic tool that enables us to monitor, profile, and troubleshoot our Java applications. One of the key benefits of using Arthas is that we don’t need to change our code or even restart the Java services that we want to monitor.
In this tutorial, we’ll start by installing Arthas before we walk through a simple case study to demonstrate some of the key features of Arthas.
Finally, as Arthas is written in Java, it’s cross-platform and will happily run on Linux, macOS, and Windows.
2. Downloading and Getting Started
First, let’s start by downloading the Arthas library either directly via the download link or using curl:
curl -O https://alibaba.github.io/arthas/arthas-boot.jar
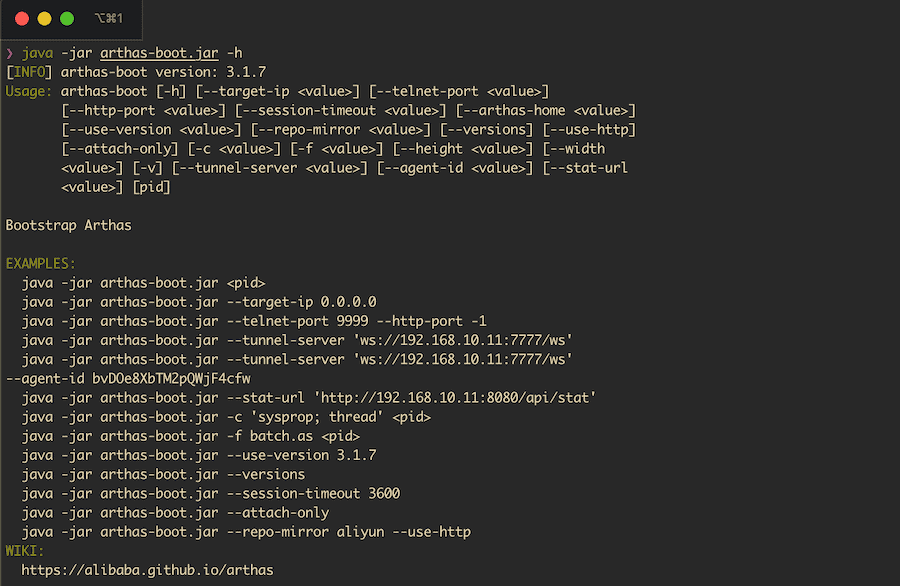
Now, let’s test that it’s working by running Arthas with the -h (help) option:
java -jar arthas-boot.jar -hIf successful, we should see the help guide for all the commands displayed:
3. Case Study
Throughout this tutorial, we’ll use a very simple application based on a fairly inefficient implementation of the Fibonacci sequence using recursion:
public class FibonacciGenerator {

    public static void main(String[] args) {
        System.out.println("Press a key to continue");
        System.in.read();
        for (int i = 0; i < 100; i++) {
            long result = fibonacci(i);
            System.out.println(format("fib(%d): %d", i, result));
        }
    }

    public static long fibonacci(int n) {
        if (n == 0 || n == 1) {
            return 1L;
        } else {
            return fibonacci(n - 1) + fibonacci(n - 2);
        }
    }
}
The most interesting part of this example is the fibonacci method that follows the mathematical definition of Fibonacci.
In the main method, we use a for loop with relatively large numbers so our computer will be busy with longer computations. This is, of course, precisely what we want in order to demonstrate Arthas.
4. Starting Arthas
Now let’s try Arthas out! The first thing we need to do is run our small Fibonacci application. For that, we can use our favorite IDE or run it directly in the terminal. It will ask to press a key in order to start. We’ll press any key after we attach the process to Arthas.
Now, let’s run the Arthas executable:
java -jar arthas-boot.jarArthas prompts a menu to select which process we want to attach to:
[INFO] arthas-boot version: 3.1.7
[INFO] Found existing java process, please choose one and hit RETURN.
* [1]: 25500 com.baeldung.arthas.FibonacciGenerator
...
Let’s select the one with the name com.baeldung.arthas.FibonacciGenerator. Simply enter the number in the list, ‘1’ in this example, and then press Enter.
Arthas will now attach to this process and start:
INFO] Try to attach process 25500
[INFO] Attach process 25500 success.
...
Once we have Arthas started, we have a prompt where we can issue different commands.
We can use the help command to get more information about the available options. Moreover, in order to facilitate the use of Arthas, we can also use the tab key to autocomplete its commands.
After attaching Arthas to our process, now we can press a key and the program starts printing Fibonacci numbers.
5. Dashboard
Once Arthas is started, we can use the dashboard. In this case, we proceed by typing the dashboard command. Now we see a detailed screen with several panes and much information about our Java process:
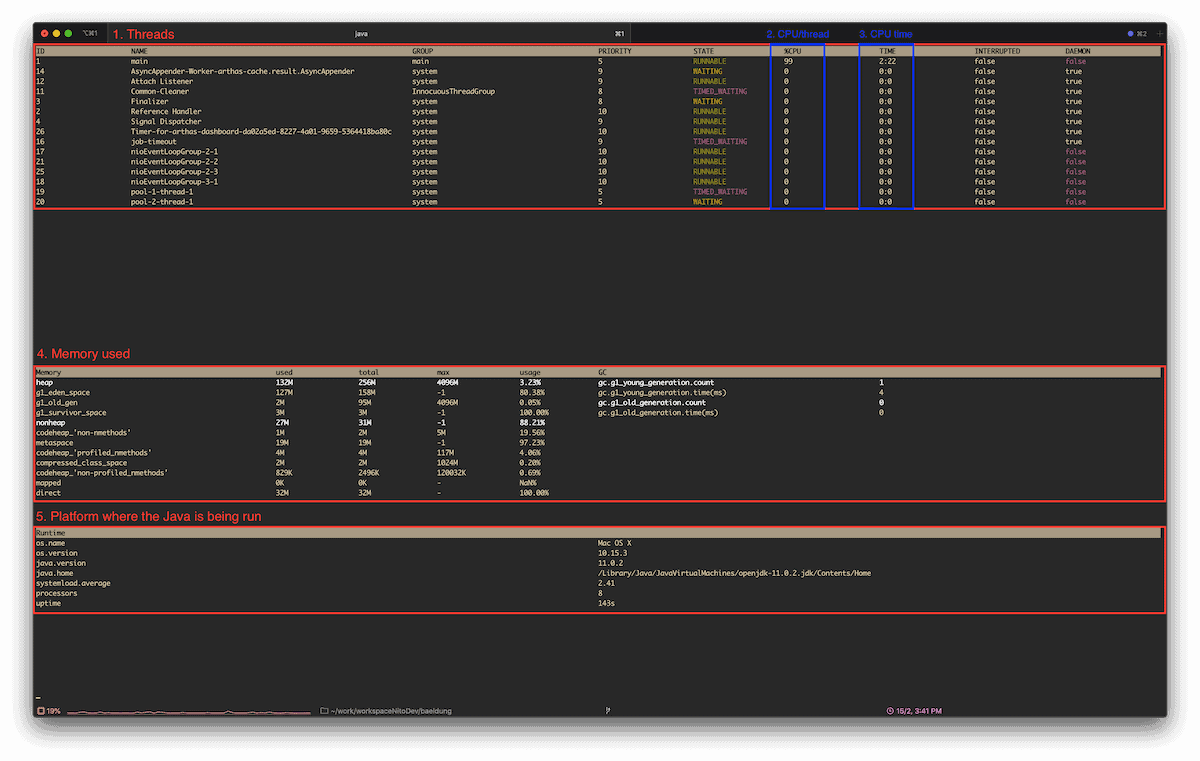
Let’s take a look at some of these in more detail:
- The top section is dedicated to the threads currently running
- One of the important columns is the CPU consumption for each thread
- Section 3 shows the CPU time per thread
- Another interesting pane is for memory analysis. Different memory regions are listed with their statistics. On the right-hand side, we have information about the Garbage Collector
- Finally, in section 5 we have information about the host platform and JVM
We can exit the dashboard by pressing q.
We should keep in mind that Arthas will be attached to our process even if we exit. So in order to properly unlink it from our process, we need to run the stop command.
6. Analyzing Stack Traces
In the dashboard, we saw that our main process takes almost 100% of the CPU. This process has an ID of 1, which we can see in the very first column.
Now that we’ve exited the dashboard, we can analyze the process in more detail by running the thread command:
thread 1The number passed as the argument is the thread id. Arthas prints out a stack trace that, unsurprisingly, is cluttered with calls to the fibonacci method.
If the stack trace is long and tedious to read, the thread command allows us to use pipes:
thread 1 | grep 'main('This will only print the line matching the grep command:
[arthas@25500]$ thread 1 | grep 'main('
    at com.baeldung.arthas.FibonacciGenerator.main(FibonacciGenerator.java:10)
7. Decompile a Java Class
Let’s imagine a scenario where we’re analyzing a Java application that we know little or nothing about, and we suddenly discover that the stack is strewn with repetitive calls of the type:
[arthas@59816]$ thread 1
"main" Id=1 RUNNABLE
  at app//com.baeldung.arthas.FibonacciGenerator.fibonacci(FibonacciGenerator.java:18)
  at app//com.baeldung.arthas.FibonacciGenerator.fibonacci(FibonacciGenerator.java:18)
  ...
Since we are running Arthas, we could decompile a class to see its content. To achieve that, we can use the jad command, passing the qualified class name as an argument:
jad com.baeldung.arthas.FibonacciGenerator

ClassLoader:
+-jdk.internal.loader.ClassLoaders$AppClassLoader@799f7e29
  +-jdk.internal.loader.ClassLoaders$PlatformClassLoader@60f1dd34

Location:
/home/amoreno/work/baeldung/tutorials/libraries-3/target/
/*
* Decompiled with CFR.
*/
package com.baeldung.arthas;
import java.io.IOException;
import java.io.InputStream;
import java.io.PrintStream;
public class FibonacciGenerator {
public static void main(String[] arrstring) throws IOException {The output is the decompiled Java class and some useful metadata like the location of the class. This is a really useful and powerful feature.
8. Search Class and Search Method
The search class command comes in handy when searching for classes loaded in the JVM. We can use it by typing sc and passing a pattern, with or without wildcards, as an argument:
[arthas@70099]$ sc *Fibonacci*
com.baeldung.arthas.FibonacciGenerator
Affect(row-cnt:1) cost in 5 ms.
Once we have the qualified name for the class, we can then look for more information using two additional flags:
- -d to display the details of the class
- -f to display the fields of the class
However, the fields of the class must be queried in conjunction with the details:
[arthas@70099]$ sc -df com.baeldung.arthas.FibonacciGenerator
  class-info        com.baeldung.arthas.FibonacciGenerator
  ...
Likewise, we can use the command sm (search method) to look for loaded methods in a class. In this case, for our class com.baeldung.arthas.FibonacciGenerator, we can run:
[arthas@70099]$ sm com.baeldung.arthas.FibonacciGenerator
com.baeldung.arthas.FibonacciGenerator <init>()V
com.baeldung.arthas.FibonacciGenerator main([Ljava/lang/String;)V
com.baeldung.arthas.FibonacciGenerator fibonacci(I)J
Affect(row-cnt:3) cost in 4 ms.
We could use the flag -d to retrieve the details of the methods as well. Finally, we can pass the name of the method an optional argument to narrow down the number of returned methods:
sm -d com.baeldung.arthas.FibonacciGenerator fibonacci
 declaring-class  com.baeldung.arthas.FibonacciGenerator
 method-name      fibonacci
 modifier         public,static
 annotation
 parameters       int
 return           long
 exceptions
 classLoaderHash  799f7e29
9. Monitoring Method Invocations
Another cool thing we can do with Arthas is to monitor a method. This can be very handy when debugging performance issues in our applications. For this, we can use the monitor command.
The monitor command requires a flag -c <seconds> and two arguments — the qualified class name and the method name.
For our case study, let’s now invoke monitor:
monitor -c 10 com.baeldung.arthas.FibonacciGenerator fibonacciAs expected, Arthas will print metrics about the fibonacci method every 10 seconds:
Affect(class-cnt:1 , method-cnt:1) cost in 47 ms.
 timestamp            class                                          method     total   success  fail  avg-rt(ms)  fail-rate
-----------------------------------------------------------------------------------------------------------------------------
 2020-03-07 11:43:26  com.baeldung.arthas.FibonacciGenerator  fibonacci  528957  528957   0     0.07        0.00%
...
We also have metrics for those calls that end up in failures — and these can be useful for debugging.
10. Monitoring Method Arguments
In case we need to debug the parameters of a method, we can use the watch command. But, the syntax is a bit more complex:
watch com.baeldung.arthas.FibonacciGenerator fibonacci '{params[0], returnObj}' 'params[0]>10' -n 10
Let’s take a look at each of the arguments in detail:
- The first argument is the class name
- The second is the method name
- The third argument is an OGNL expression defining what we want to watch — in this case, it’s the first (and only) method parameter, and the return value
- The fourth and final optional argument is a boolean expression used to filter the invocations we want to monitor
For this example, we only want to monitor the argument when it’s greater than 10. Finally, we add a flag to limit the number of results to 10:
watch com.baeldung.arthas.FibonacciGenerator fibonacci '{params[0], returnObj}' 'params[0]>10' -n 10
Press Q or Ctrl+C to abort.
Affect(class-cnt:1 , method-cnt:1) cost in 19 ms.
ts=2020-02-17 21:48:08; [cost=30.165211ms] result=@ArrayList[
    @Integer[11],
    @Long[144],
]
ts=2020-02-17 21:48:08; [cost=50.405506ms] result=@ArrayList[
    @Integer[12],
    @Long[233],
]
...
Here, we can see examples of invocations with their CPU times and input/return values.
11. Profiler
A very visual capability for those interested in the performance of applications is available via the profiler command. The profiler will evaluate the performance of the CPU that our processes are using.
Let’s run the profiler by launching profiler start. This is a non-blocking task, meaning we can continue using Arthas while the profiler is working.
At any time, we can ask how many samples the profiler has by running profiler getSamples.
Let’s now stop the profiler using profiler stop. At this point, a FlameGraph image is saved. In this precise case, we have a chart with the fibonacci thread dominating the graphic:
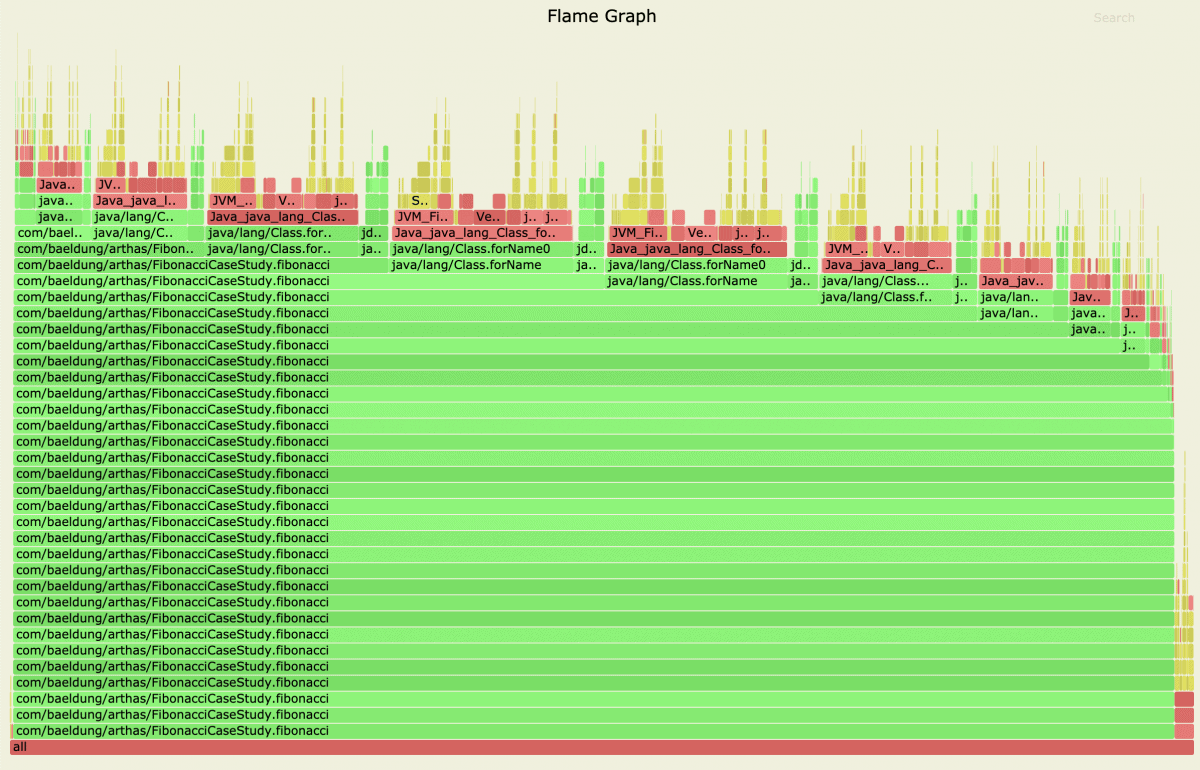
Note that this chart can be particularly useful when we want to detect where our CPU time is being spent.
12. Conclusion
In this tutorial, we have explored some of the most powerful and useful features of Arthas.
As we have seen, Arthas has many commands that can help us diagnose a variety of issues. It can also be particularly helpful when we cannot access the code of the application under scrutiny, or if we want to do a quick diagnostic of a problematic application running on a server.


