Mocking is an essential part of unit testing, and the Mockito library makes it easy to write clean and intuitive unit tests for your Java code.
Get started with mocking and improve your application tests using our Mockito guide:
Handling concurrency in an application can be a tricky process with many potential pitfalls. A solid grasp of the fundamentals will go a long way to help minimize these issues.
Get started with understanding multi-threaded applications with our Java Concurrency guide:
Spring 5 added support for reactive programming with the Spring WebFlux module, which has been improved upon ever since. Get started with the Reactor project basics and reactive programming in Spring Boot:
Since its introduction in Java 8, the Stream API has become a staple of Java development. The basic operations like iterating, filtering, mapping sequences of elements are deceptively simple to use.
But these can also be overused and fall into some common pitfalls.
To get a better understanding on how Streams work and how to combine them with other language features, check out our guide to Java Streams:
Explore Spring Boot 3 and Spring 6 in-depth through building a full REST API with the framework:
Yes, Spring Security can be complex, from the more advanced functionality within the Core to the deep OAuth support in the framework.
I built the security material as two full courses - Core and OAuth, to get practical with these more complex scenarios. We explore when and how to use each feature and code through it on the backing project.
You can explore the course here:
Spring Data JPA is a great way to handle the complexity of JPA with the powerful simplicity of Spring Boot.
Get started with Spring Data JPA through the guided reference course:
Refactor Java code safely — and automatically — with OpenRewrite.
Refactoring big codebases by hand is slow, risky, and easy to put off. That’s where OpenRewrite comes in. The open-source framework for large-scale, automated code transformations helps teams modernize safely and consistently.
Each month, the creators and maintainers of OpenRewrite at Moderne run live, hands-on training sessions — one for newcomers and one for experienced users. You’ll see how recipes work, how to apply them across projects, and how to modernize code with confidence.
Join the next session, bring your questions, and learn how to automate the kind of work that usually eats your sprint time.
Yes, we're now running our only Summer Sale. All Courses are 30% off until 20th July, 2026:
Yes, we're now running our only Summer Sale. All Courses are 30% off until 20th July, 2026:
1. Introduction
In modern software development, where microservices architectures are very popular, the ability to track and analyze the flow of requests across various services is essential. Because of this, distributed tracing emerges as a critical tool, providing insights into our system’s performance and behavior.
In this tutorial, we’ll introduce Brave, a popular distributed tracing instrumentation library in the Java ecosystem.
2. Understanding Distributed Tracing
Distributed tracing is a method used to monitor and troubleshoot complex, distributed systems composed of interconnected services. Within such systems, requests may traverse multiple services, each responsible for performing specific tasks. Therefore, tracking the journey of a request can become challenging without using some dedicated tools.
Before exploring distributed tracing, we must define two key concepts: traces and spans. A trace represents an external request and consists of a set of spans. A span represents an operation; its key attributes are an operation name, start time, and end time. A span can have one or more child spans representing nested operations.
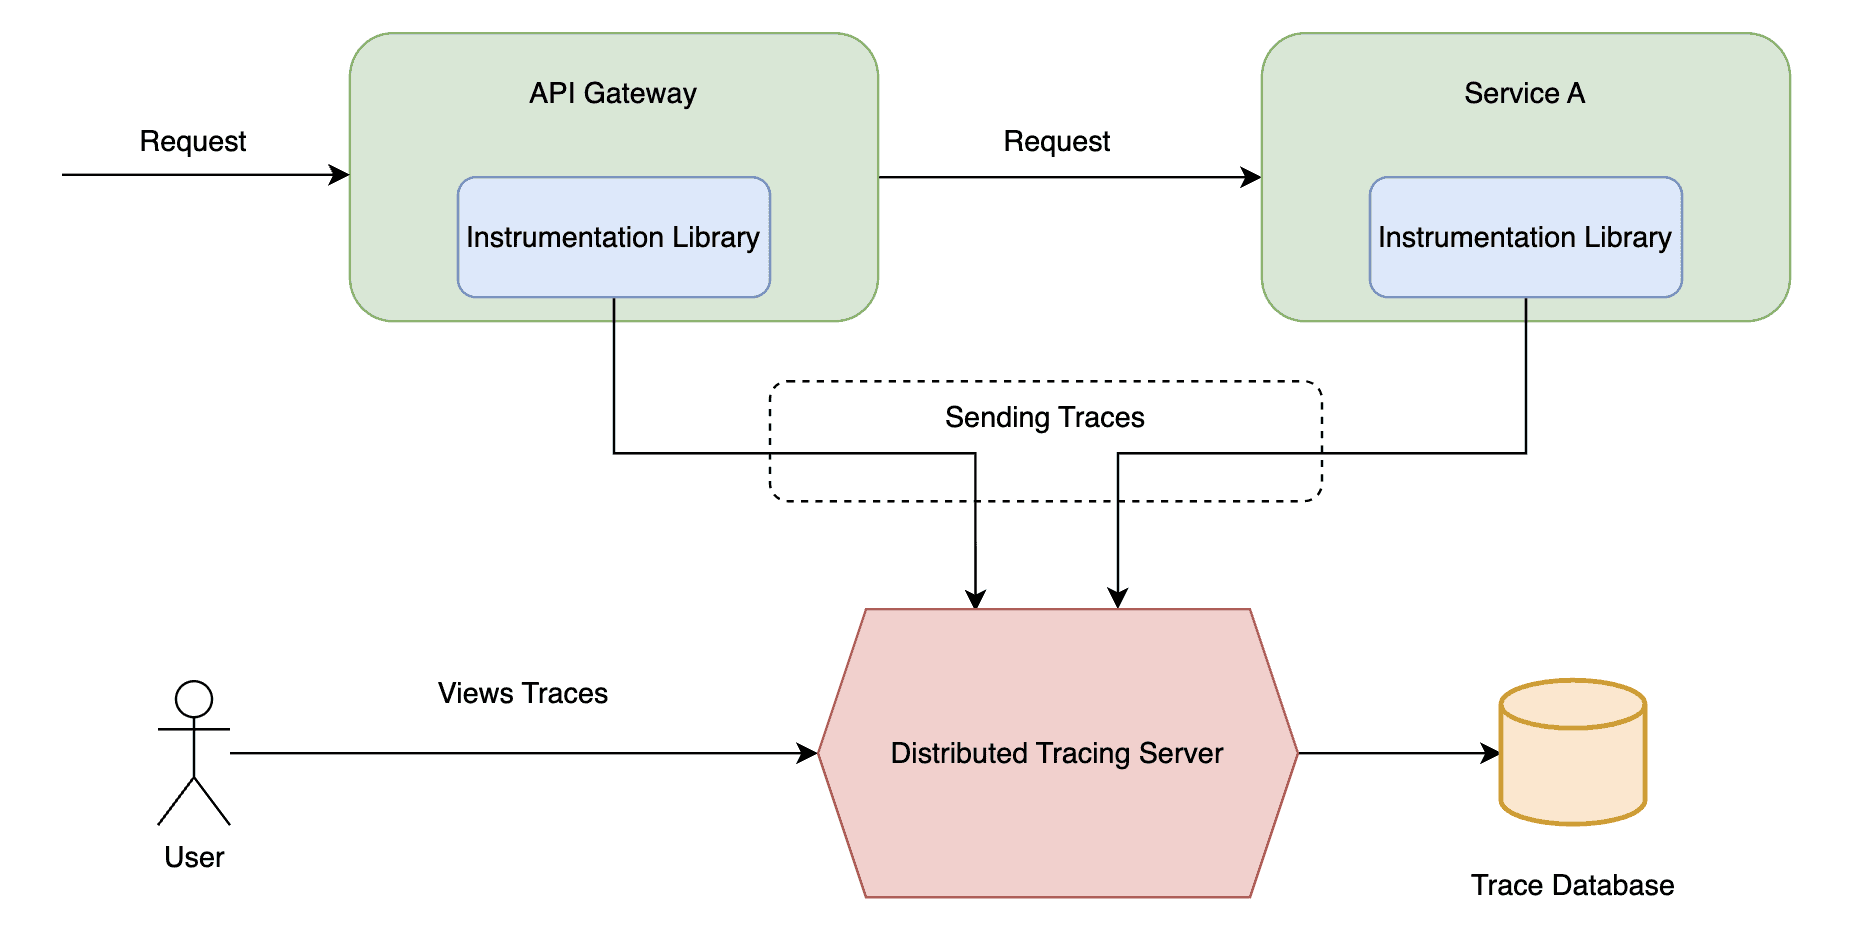
Now, let’s explore the key components of distributed tracing: the instrumentation library and the distributed tracing server. The instrumentation library utilized by each service serves the primary purpose of generating and propagating trace data. This involves capturing operational details within the service, such as handling incoming requests, making outbound calls to other services or databases, and processing data.
On the other hand, the distributed tracing server represents the central hub for trace data management. It provides APIs for receiving trace data from instrumentation libraries, aggregates and stores the data, and offers tools for analysis, monitoring, and troubleshooting.
The following diagram shows how distributed tracing works and the interaction between components:
3. Zipkin
Zipkin is a leading open-source distributed tracing system initially developed by Twitter. It’s designed to help gather data needed to troubleshoot latency problems in microservice architectures. It collects data from instrumented services and then provides a detailed view of this data.
Four main components comprise Zipkin, and we’ll detail each in the following sub-sections.
3.1. Collector
When instrumented services generate trace data, it necessitates collection and processing. Thus, the collector is responsible for receiving and validating the traces Zipkin receives. Once the traces are validated, they are stored for later retrieval and analysis. The collector can receive data through HTTP or AMQP, making it flexible and suitable for various system architectures.
3.2. Storage
Zipkin was initially built to store data using Cassandra because it is highly scalable, flexible, and heavily used within Twitter. However, Zipkin was updated to be more configurable, supporting other storage options, such as ElasticSearch, MySQL, or even in-memory storage.
3.3. API
Once the data is stored, Zipkin offers an intuitive means of data extraction through a RESTful interface. This interface enables us to locate and retrieve traces as needed effortlessly. Additionally, the API serves as the backbone for the Zipkin Web UI, which is its primary data source.
3.4. Web UI
The graphical user interface (GUI) provided by Zipkin represents a visually accessible method for inspecting traces based on service, time, and annotations. Moreover, it facilitates detailed analysis by allowing us to delve into specific traces, making it particularly invaluable for troubleshooting complex issues involving distributed transactions.
4. Brave
Brave is a distributed tracing instrumentation library. It intercepts production requests, gathers timing data, and propagates trace contexts. Its primary objective is to facilitate the correlation of timing data within distributed systems, enabling efficient troubleshooting for latency issues.
Although Brave commonly sends trace data to a Zipkin server, it offers flexibility through third-party plugins to integrate with other services such as Amazon X-Ray.
Brave offers a dependency-free tracer library compatible with JRE6 and above. It provides an essential API for timing operations and tagging them with descriptive attributes. This library also includes code that parses X-B3-TraceId headers, further enriching its functionality.
While direct tracing code implementation is typically unnecessary, users can leverage existing instrumentation provided by Brave and Zipkin. Notably, libraries for common tracing scenarios like JDBC, Servlet, and Spring are readily available, meticulously tested, and benchmarked.
For those dealing with legacy applications, the Spring XML Configuration offers a seamless setup for tracing without necessitating custom code.
Users may also seek to integrate trace IDs into log files or modify thread local behavior. In such cases, context libraries provided by Brave offer seamless integration with tools like SLF4J.
5. How to Use Brave
Moving on, let’s build a simple Java and Spring Boot application and integrate it with Brave and Zipkin.
5.1. Zipkin Slim Setup
First of all, we need to have a Zipkin server running. To do so, we’re going to use Zipkin Slim, a slim build of Zipkin, which is smaller and starts faster. It supports in-memory and Elasticsearch storage but doesn’t support messaging through Kafka or RabbitMQ.
Multiple ways to use it are documented in Zipkin’s official repository. Also, further methods for running a Zipkin server can be found in our article on Tracing Services with Zipkin.
For simplicity, we’re going to assume we already have Docker installed on our local machine and run it with the following command:
docker run -d -p 9411:9411 openzipkin/zipkin-slimNow, by accessing http://localhost:9411/zipkin/, we can visualize the Zipkin Web UI.
5.2. Project Setup
We’ll start from an empty Spring Boot project with brave, zipkin-reporter, zipkin-sender-okhttp3, and zipkin-reporter-brave dependencies:
<dependency>
    <groupId>io.zipkin.brave</groupId>
    <artifactId>brave</artifactId>
    <version>6.0.2</version>
</dependency>
<dependency>
    <groupId>io.zipkin.reporter2</groupId>
    <artifactId>zipkin-reporter</artifactId>
    <version>3.3.0</version>
</dependency>
<dependency>
    <groupId>io.zipkin.reporter2</groupId>
    <artifactId>zipkin-sender-okhttp3</artifactId>
    <version>3.3.0</version>
</dependency>
<dependency>
    <groupId>io.zipkin.reporter2</groupId>
    <artifactId>zipkin-reporter-brave</artifactId>
    <version>3.3.0</version>
</dependency>
Moving on, we need a configuration class to instantiate a Tracer bean to use it later:
@Configuration
public class TracingConfiguration {
    @Bean
    BytesMessageSender sender() {
        return OkHttpSender.create("http://127.0.0.1:9411/api/v2/spans");
    }

    @Bean
    AsyncZipkinSpanHandler zipkinSpanHandler(BytesMessageSender sender) {
        return AsyncZipkinSpanHandler.create(sender);
    }

    @Bean
    public Tracing tracing(AsyncZipkinSpanHandler zipkinSpanHandler) {
        return Tracing.newBuilder()
          .localServiceName("Dummy Service")
          .addSpanHandler(zipkinSpanHandler)
          .build();
    }

    @Bean
    public Tracer tracer(Tracing tracing) {
        return tracing.tracer();
    }
}
Now, we can inject the Tracer directly into our beans. To demonstrate, we’ll create a dummy service that will send a trace to Zipkin after being initialized:
@Service
public class TracingService {
    private final Tracer tracer;

    public TracingService(Tracer tracer) {
        this.tracer = tracer;
    }

    @PostConstruct
    private void postConstruct() {
        Span span = tracer.nextSpan().name("Hello from Service").start();
        try {
            Thread.sleep(2000);
        } catch (InterruptedException e) {
            throw new RuntimeException(e);
        } finally {
            span.finish();
        }
    }
}
If we run our application and check Zipkin Web UI, we should be able to see our trace, containing only one span, taking approximately 2 seconds:
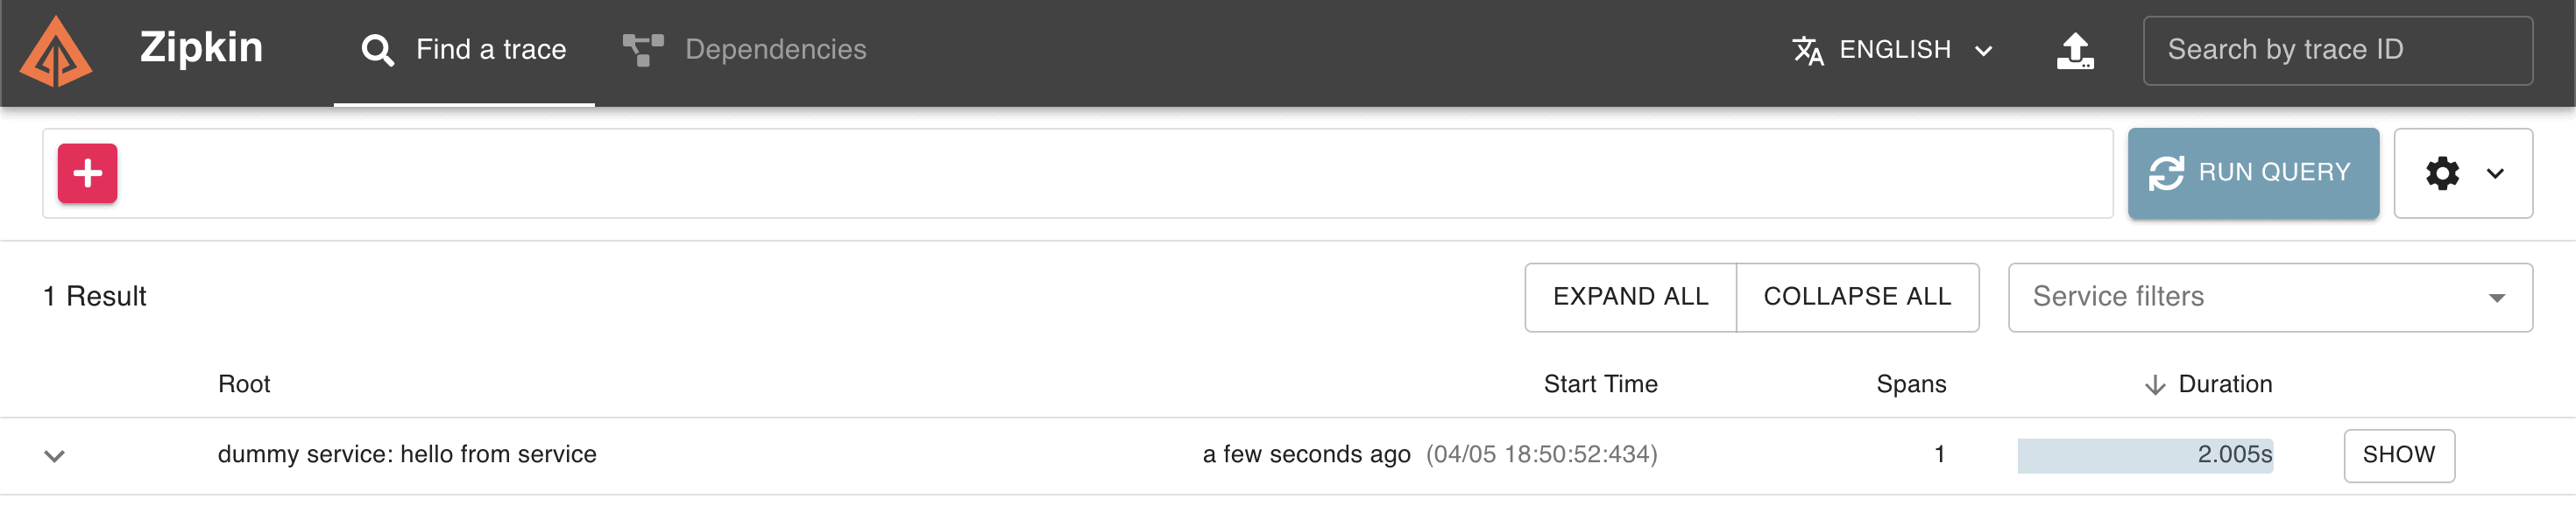
Note that this example only lightly configures tracing. When dealing with more complex scenarios, it is recommended to use Spring Cloud Sleuth instead.
Also, the brave-example repository describes alternative ways to trace a simple web application.
5. Conclusion
As we’ve learned throughout this article, Brave helps us monitor our applications efficiently. Brave simplifies the instrumentation process and proves a valuable asset within distributed systems thanks to its seamless integration with Zipkin.