

Learn through the super-clean Baeldung Pro experience:
>> Membership and Baeldung Pro.
No ads, dark-mode and 6 months free of IntelliJ Idea Ultimate to start with.
Learn through the super-clean Baeldung Pro experience:
>> Membership and Baeldung Pro.
No ads, dark-mode and 6 months free of IntelliJ Idea Ultimate to start with.
In this tutorial, we’ll study the tools that we can use to generate dependency graphs based on our textual input.
A dependency graph is a graph with directed edges that represent the relationship existing between vertices. Its typical usage consists of describing processes, such as those in the development of software; or relationships, such as those contained in a knowledge graph.
As for all directed graphs, dependency graphs also comprise nodes or vertices represented as boxes or circles with labels, and arrows connecting them in their mandatory direction of traversal.
In scientific literature, dependency graphs are standard for representing semantic relationships, the temporal and causal dependency between events, or the flow of electric current in electronic circuits. When working in computer science, drawing dependency graphs is so frequent that we’ll want to use tools that automate their drawing based on some simple textual instructions on our part.
To aid us in this, we’re now going to see some of them, together with examples of their application. Their usage will significantly shorten the time we spend in drawing dependency graphs manually.
Graphviz is a software for the visualization of graphs that’s very popular, due to its frequent usage for the graphical representation of decision trees in machine learning. Its popularity derives from the existence of libraries that implement it in most programming languages, such as Python, Java, and Scala.
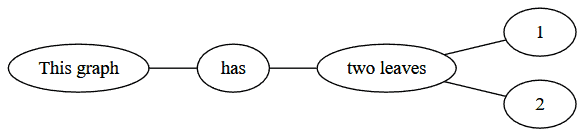
Graphviz uses a simplified language called DOT, which builds a graph around a set of node labels defined by the programmer. There’s also a web version of Graphviz that allows us to directly type the description of the graph into the browser, without installing any software. For example, we can try this code:
graph G {
    rankdir=LR
    "This graph" -- "has" -- "two leaves" -- 1;
    "two leaves" -- 2;
}
It generates this image:
Another similar tool is Mermaid, which recently won a JavaScript Open Source award as the most exciting technology for 2019. Mermaid has the advantage of being easily integrable into Markdown interpreters; this makes it particularly useful if we’re working on Jupyter Notebooks and need to draw some dependency charts quickly. The language allows the definition of nodes with different shapes, and the addition of labels to both nodes and edges.
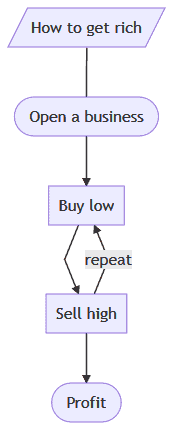
There’s also a webpage that uses Mermaid, where we can test our ideas on the go. This is a sample code to create a graph in Mermaid:
graph TD
  A[/How to get rich/] --- B([Open a business]);
  B --> C[Buy low];
  C --> D[Sell high];
  D -->|repeat| C
  D --> E([Profit]);
The code produces this diagram:
WebSequenceDiagrams is a website rather than software, that allows the drawing of dependency graphs and the addition of some extra layers. Its free version allows the addition of some simple images and layouts that make the graphs more interesting to the reader.
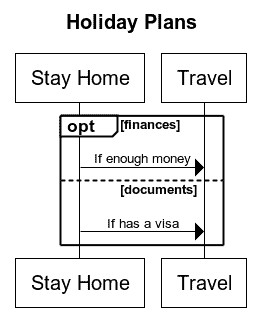
Its syntax is straightforward, and, as for the tools above, let us define the graphs by indicating nodes interspersed by arrows. We can also add simple loops or options to the graphs as extra layers:
title Holiday Plans
opt finances
    Stay Home->Travel: If enough money
else documents
    Stay Home->Travel: If has visa
end
The snipped above produces this output:
Another useful tool is nomnoml, which performs similar functions, but with a more “comics” or cartoonish style. It uses a square bracket notation and allows customization of the graph according to a CSS-like style.
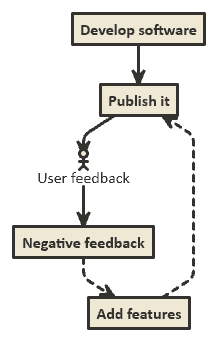
Its primary advantage lies in the fact that it’s web-based, and thus requires no installation. Additionally, it allows the export of images in both PNG and SVG formats and also the direct sharing of links that recreate code and graphs:
[Develop software]->[Publish it]
[Publish it] -> [<actor>User feedback]
[User feedback] -> [Negative feedback]
[Negative feedback] --> [Add features]
[Add features] --> [Publish it]
This is how the output graph looks:
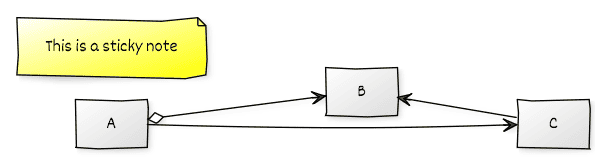
yUML is a web tool that lets us draw graphs based on a square bracket language. Particularly interesting is the feature that allows the drawing of scruffy graphs, which give an informal and friendly look to our diagrams. yUML also lets us add sticky notes to graphs, which allow us to provide additional comments that are easy to interpret:
[A]<>->[B]
[B]<-[C]
[A]->[C]
[note: This is a sticky note {bg:yellow}]
This is the image that the code generates:
And lastly, we can also use LaTeX to represent graphs. On one hand, its syntax is certainly more complicated than that of any of the previous tools. On the other, though, LaTeX offers superior capabilities for customization of all the elements of the dependency graph:
In this article, we studied some tools that we can use to generate dependency graphs.
