Learn through the super-clean Baeldung Pro experience:
>> Membership and Baeldung Pro.
No ads, dark-mode and 6 months free of IntelliJ Idea Ultimate to start with.
Last updated: May 24, 2023

Learn through the super-clean Baeldung Pro experience:
>> Membership and Baeldung Pro.
No ads, dark-mode and 6 months free of IntelliJ Idea Ultimate to start with.
Deep learning is a subset of machine learning that involves training artificial neural networks with multiple layers to learn complex representations of data. Convolutional Neural Network (CNN) is a type of deep learning model commonly used for image classification and object recognition tasks. To do such classification tasks, CNNs use feature maps in which a series of features are extracted from input via different filters. In this tutorial, we explain the purpose of feature map in CNN.
CNNs are a type of artificial neural network commonly used for image recognition and computer vision tasks. As a neural network, CNNs are trained through a process of supervised learning, in which the algorithm is trained on a labeled dataset. In CNN, convolution refers to the process of applying a filter or a kernel to an input or feature map. The filter is a small matrix of weights that slides over the input image or feature map and performs a dot product operation at each position.
The purpose of the convolution operation in CNNs is to extract features from the input image or feature map. By applying different filters to an input image, the network can identify edges, lines, curves, and other features that are important for recognition tasks. Convolutional layers can learn to recognize low-level features such as edges and corners, and then combine them to detect more complex features such as shapes and patterns.
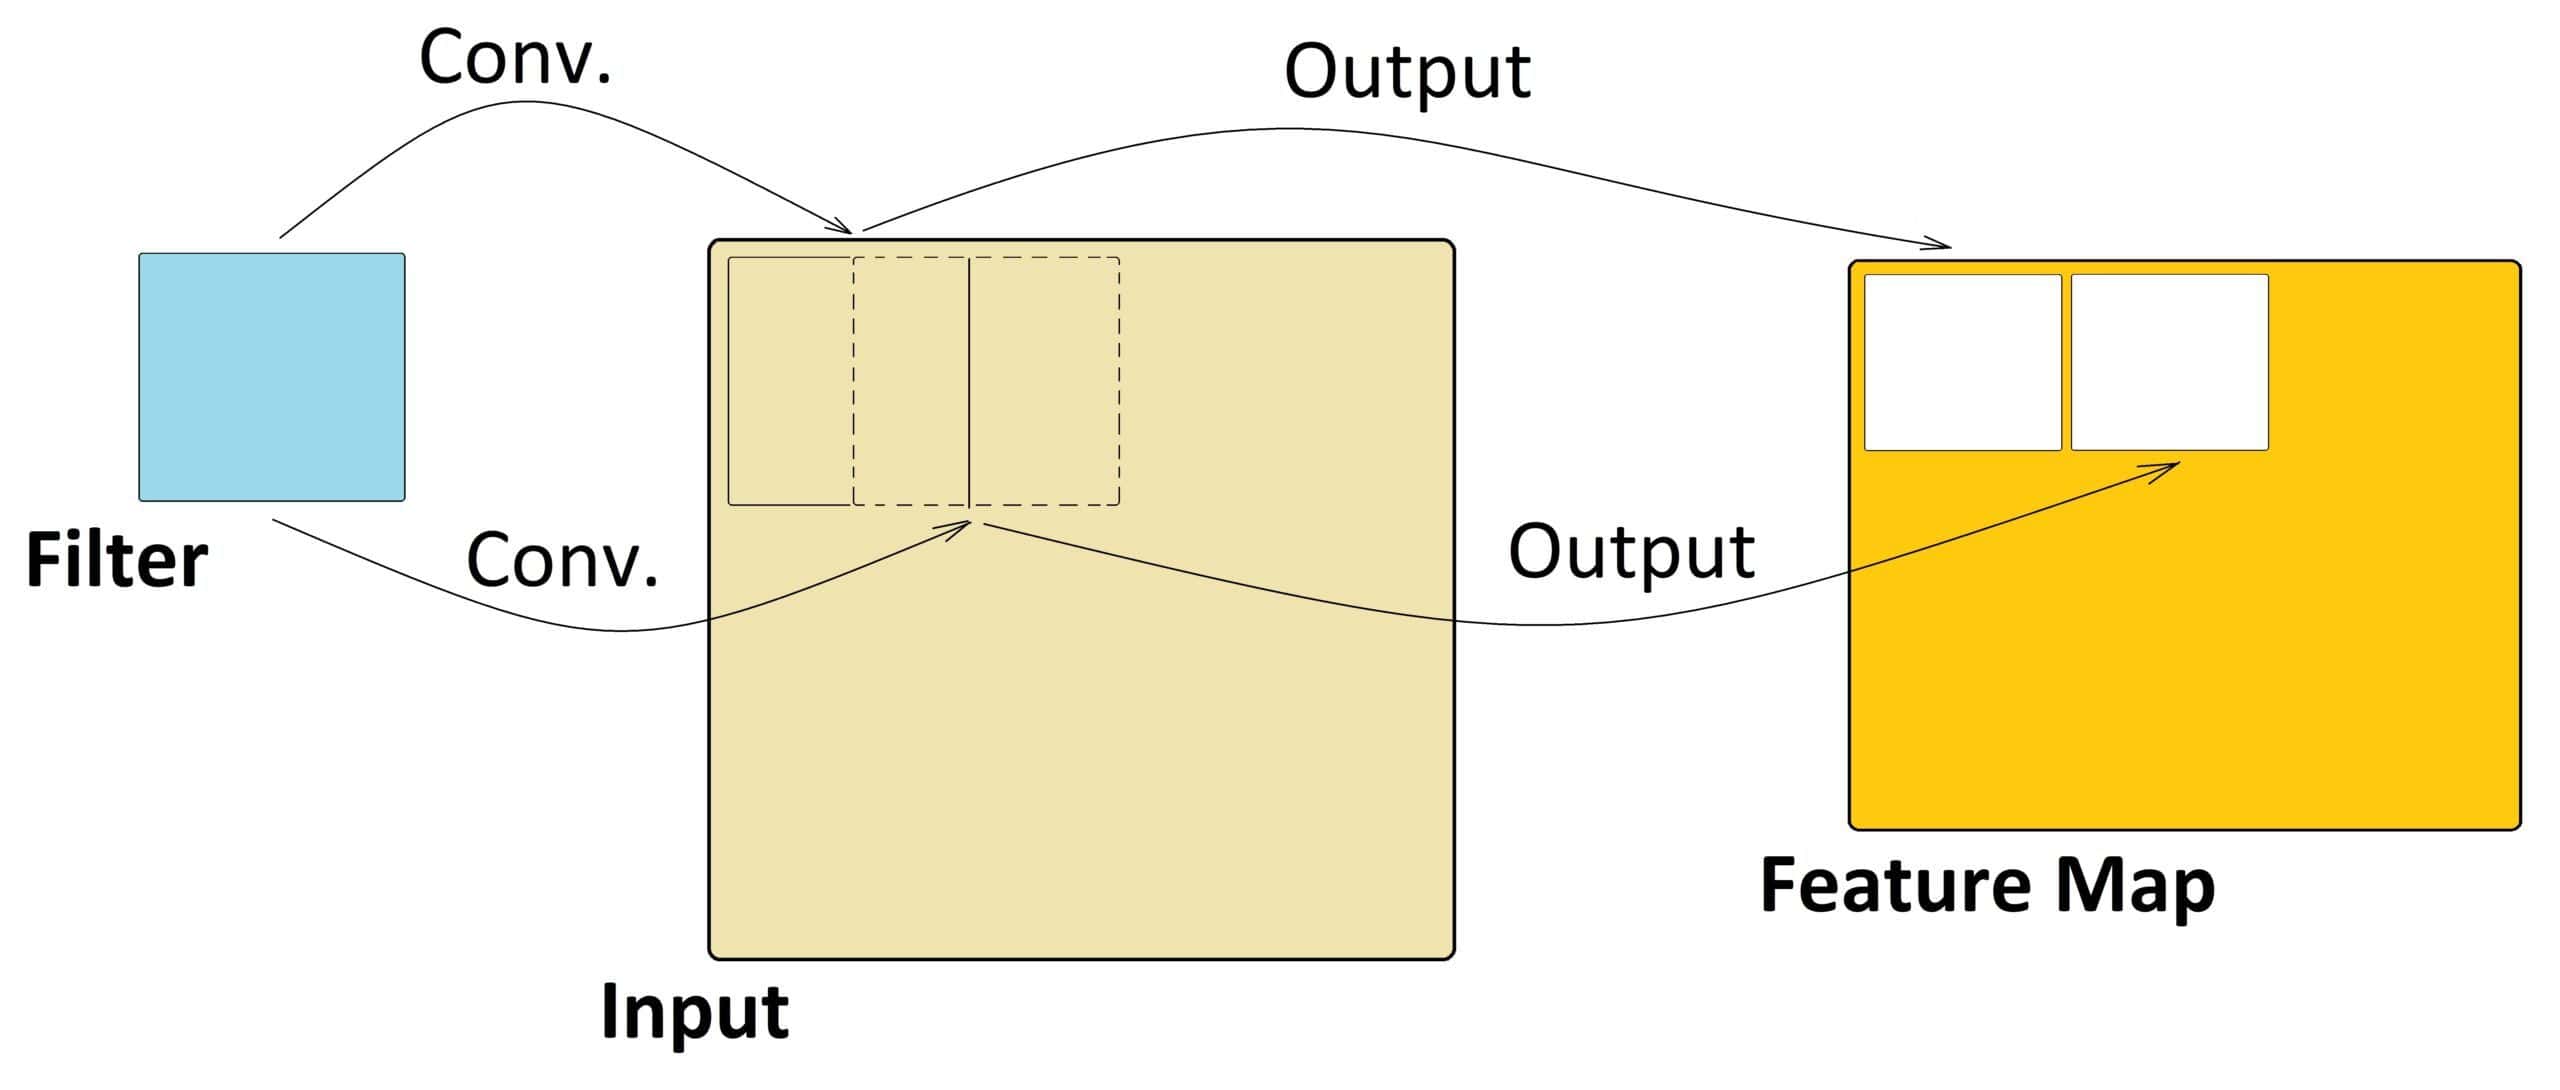
In CNNs, a feature map is the output of a convolutional layer representing specific features in the input image or feature map.
During the forward pass of a CNN, the input image is convolved with one or more filters to produce multiple feature maps. Each feature map corresponds to a specific filter and represents the response of that filter to the input image. Each element in the feature map represents the activation of a specific neuron in the network, and its value represents the degree to which the corresponding feature is present in the input image.
For example, in the early layers of a CNN, the feature maps may represent low-level features such as edges, lines, and corners. Moving deeper into the network, feature maps may represent more complex features, such as shapes, textures, or even whole objects:
The number of feature maps in a convolutional layer is a hyperparameter that can be tuned during the network design. Increasing the number of feature maps can help the network learn more complex and abstract features, but it also increases the computational cost and may lead to overfitting if the network is too large.
After each convolutional layer, non-linear activation functions such as Rectified Linear Unit (ReLU) are typically applied to introduce non-linearity to the feature maps. Then, pooling layers are used to reduce the spatial size of the feature maps while preserving the most important information.
Here’s an example of a 3×3 filter (shown in blue) applied to a 5×5 input matrix to produce a 3×3 feature map. To compute the first element of the feature map, we place the filter over the top left corner of the input matrix (shown in pink) and compute the dot product:
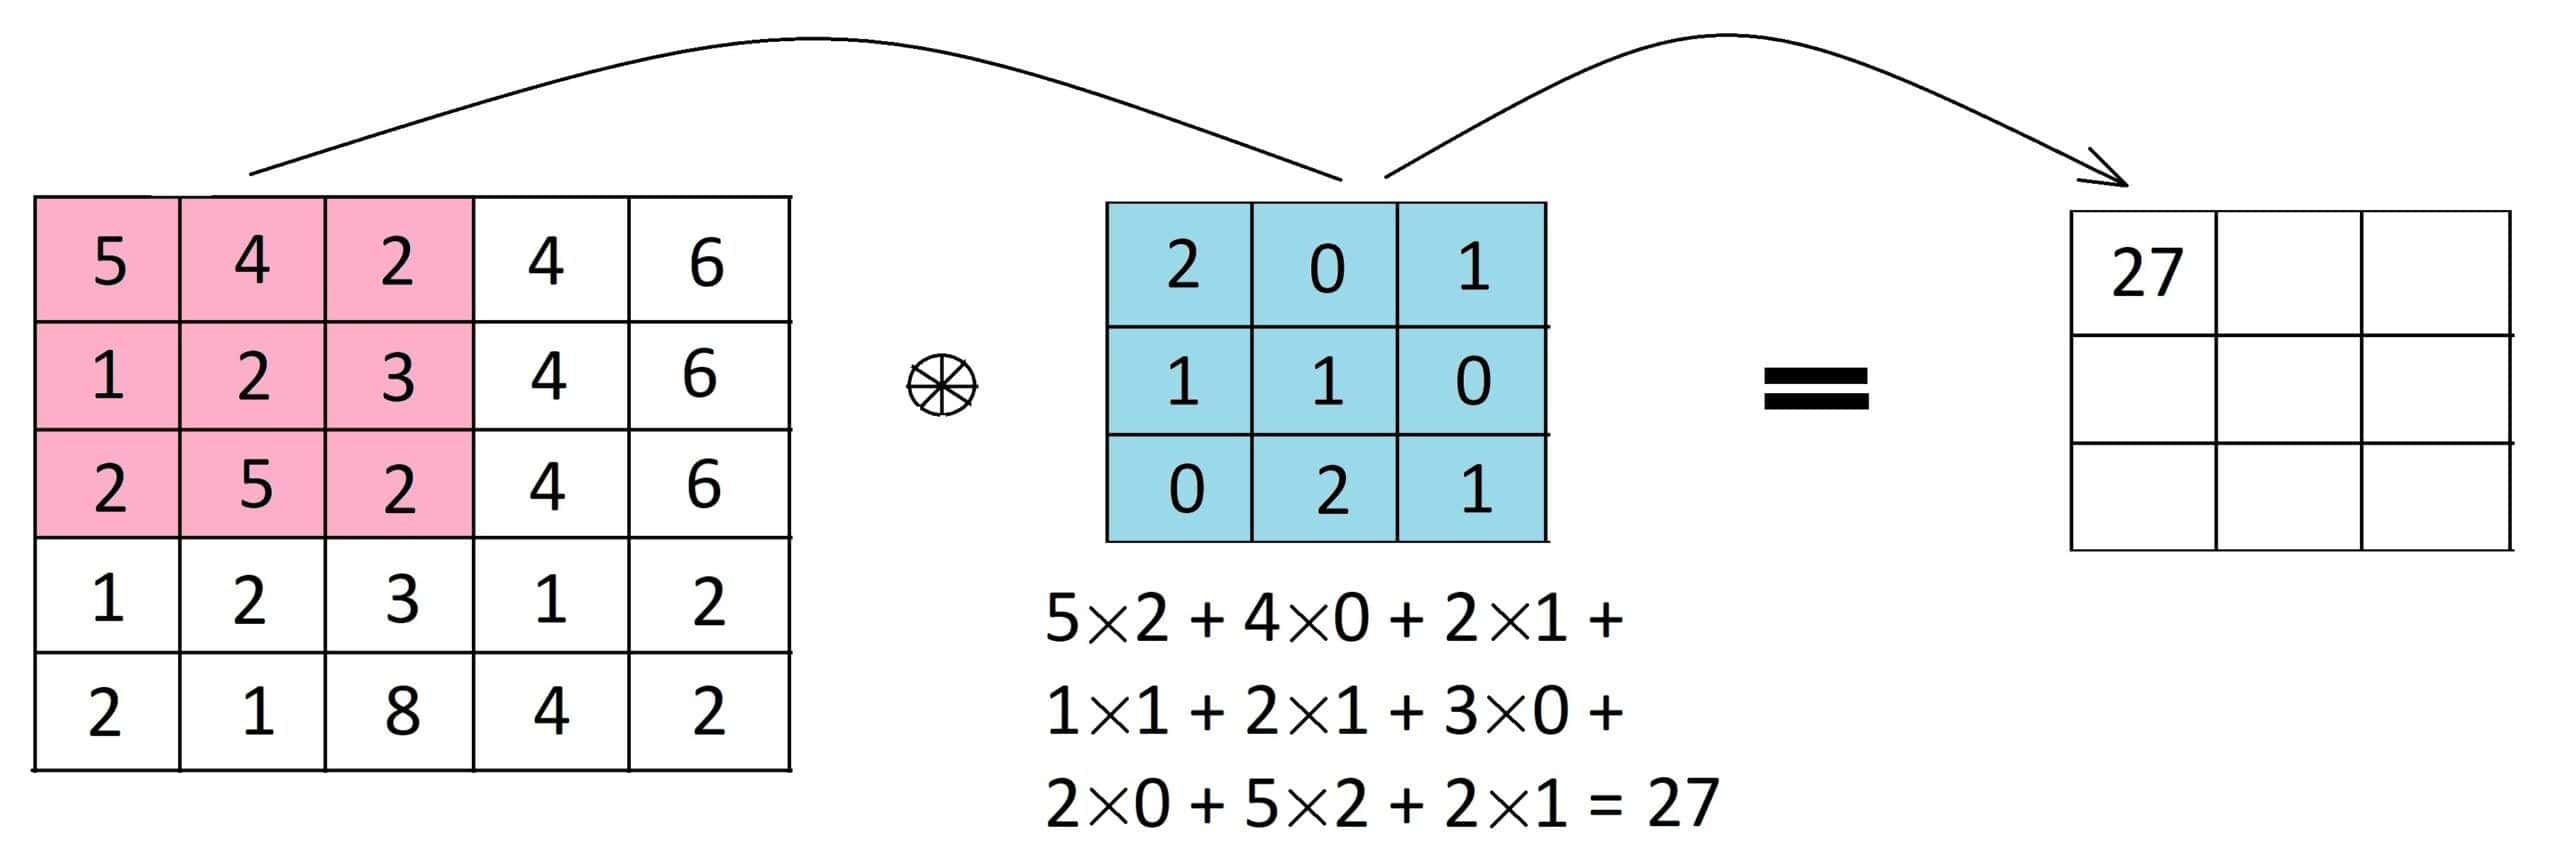
We slide the filter to the right by one pixel to compute the next element of the feature map, and so on, until we have computed all 9 elements of the feature map.
Different filters can create different feature maps in a CNN by highlighting different patterns or features in the input data. A filter can be considered a small window that scans over the input data and calculates a dot product between the filter values and the corresponding values in the input data.
We can extract different features from the input data by using different filters with different values. For example, a filter that detects horizontal edges might have values like:
 .
.
This filter will highlight areas in the input data where there is a strong horizontal edge.
Similarly, a filter that detects vertical edges might have values like:
 .
.
This filter will highlight areas in the input data where there is a strong vertical edge.
We can extract multiple features by applying multiple filters to the input data. Each filter will produce a separate feature map, which can be concatenated to create a final feature map that captures multiple aspects of the input data.
In CNNs, the size of the output feature map is determined by several factors including the size of the input or feature map, the size of the filter, and the stride of the convolution operation.
Assuming the input has dimensions of  x
x  x
x  (where is the width, is the height, and is the number of channels), and we use a filter of size
  x x (where is the filter size), and a stride of
  , the output feature map will have dimensions of:
![[ (W - F) / S + 1]](/wp-content/ql-cache/quicklatex.com-95c60bfa133d04707372e5ba666885cf_l3.svg "Rendered by QuickLaTeX.com") x
x ![[ (H - F) / S + 1]](/wp-content/ql-cache/quicklatex.com-66cfeec7c81841e15f4cc60efd68d169_l3.svg "Rendered by QuickLaTeX.com") x
x 
where is the number of filters used in the layer.
For example, let’s say we have an input image of size 28 x 28 x 3, and we use a filter of size 5 x 5 x 3 with a stride of 1. In this case, the output feature map would have dimensions of 24 x 24 x . If we use two filters, the output feature map would have dimensions of 24 x 24 x 2.
Indeed, the size of the output feature map is determined by the size of the input, the size of the filter, and the stride of the convolution operation.
The feature maps in Convolutional Neural Networks (CNNs) can differ significantly for different types of input data, such as text, image, and audio.
In image processing tasks, the feature maps in CNNs represent visual patterns and features such as edges, corners, shapes, and textures in the input image. These features are learned through convolutional and pooling layers, and are progressively combined to form higher-level features that correspond to object parts and eventually the entire object in the image.
In natural language processing (NLP) tasks, the feature maps in CNNs represent linguistic patterns and features such as n-grams, parts of speech, and syntactic structures in the input text. These features are learned through convolutional and pooling layers, and are progressively combined to form higher-level features that correspond to phrases, sentences, and eventually the entire text sequence.
In audio processing tasks, the feature maps in CNNs represent audio patterns and features such as frequency content, pitch, timbre, and rhythm in the input audio signal. These features are learned through convolutional and pooling layers, and are progressively combined to form higher-level features that correspond to different sound sources or audio events.
Overall, the feature maps in CNNs differ depending on the type of input data, and they capture different patterns and features that are relevant to the specific task. However, in all cases, CNNs use convolutional and pooling layers to learn hierarchical features that are combined to produce a final output.
Here are some potential pros and cons of feature maps in CNNs.
Pros:
Cons:
In this article, we examined the key role of feature maps in extraction of basic features and showed the calculation process in CNNs by an example. We noticed how such feature maps are used in other layers of CNN to yield the desired outcome.