

Mocking is an essential part of unit testing, and the Mockito library makes it easy to write clean and intuitive unit tests for your Java code.
Get started with mocking and improve your application tests using our Mockito guide:
Handling concurrency in an application can be a tricky process with many potential pitfalls. A solid grasp of the fundamentals will go a long way to help minimize these issues.
Get started with understanding multi-threaded applications with our Java Concurrency guide:
Spring 5 added support for reactive programming with the Spring WebFlux module, which has been improved upon ever since. Get started with the Reactor project basics and reactive programming in Spring Boot:
Since its introduction in Java 8, the Stream API has become a staple of Java development. The basic operations like iterating, filtering, mapping sequences of elements are deceptively simple to use.
But these can also be overused and fall into some common pitfalls.
To get a better understanding on how Streams work and how to combine them with other language features, check out our guide to Java Streams:
Explore Spring Boot 3 and Spring 6 in-depth through building a full REST API with the framework:
Yes, Spring Security can be complex, from the more advanced functionality within the Core to the deep OAuth support in the framework.
I built the security material as two full courses - Core and OAuth, to get practical with these more complex scenarios. We explore when and how to use each feature and code through it on the backing project.
You can explore the course here:
Spring Data JPA is a great way to handle the complexity of JPA with the powerful simplicity of Spring Boot.
Get started with Spring Data JPA through the guided reference course:
Refactor Java code safely — and automatically — with OpenRewrite.
Refactoring big codebases by hand is slow, risky, and easy to put off. That’s where OpenRewrite comes in. The open-source framework for large-scale, automated code transformations helps teams modernize safely and consistently.
Each month, the creators and maintainers of OpenRewrite at Moderne run live, hands-on training sessions — one for newcomers and one for experienced users. You’ll see how recipes work, how to apply them across projects, and how to modernize code with confidence.
Join the next session, bring your questions, and learn how to automate the kind of work that usually eats your sprint time.
1. Introduction
In this article, we’ll learn how to use VisualVM and Java Management Extensions (JMX) for remote monitoring of Java applications.
2. JMX
JMX is a standard API for the management and monitoring of JVM applications. The JVM has built-in instrumentation that JMX can use for this purpose. As a result, we usually call these utilities “out-of-the-box management tools” or, in this case, “JMX agents”.
3. VisualVM
VisualVM is a visual tool that provides lightweight profiling capabilities for the JVM. There are plenty of other mainstream profiling tools. However, VisualVM is free and comes bundled with the JDK 6U7 release until early updates of JDK 8. For other versions, Java VisualVM is available as a standalone application.
VisualVM allows us to connect to both local and remote JVM applications for monitoring purposes.
When launched on any machine, it auto-discovers and starts monitoring all JVM applications running locally. However, we need to connect remote applications explicitly.
3.1. JVM Connection Modes
The JVM exposes itself for monitoring through tools such as jstatd or JMX. These tools, in turn, provide APIs for tools such as VisualVM to get profiling data.
The jstatd program is a daemon that’s bundled with the JDK. However, it has limited capability. For instance, we can’t monitor CPU usage, nor can we take thread dumps.
On the other hand, JMX technology doesn’t require any daemon to run on the JVM. Moreover, it can be used to profile both local and remote JVM applications. However, we do need to start the JVM with special properties to enable the out-of-the-box monitoring features. In this article, we’ll only focus on the JMX mode.
3.2. Launching
As we saw earlier, our JDK version can either come bundled with VisualVM or not. In either case, we can launch it by executing the appropriate binary:
./jvisualvmIf the binary is present in the $JAVA_HOME/bin folder, then the above command will open the VisualVM interface, and it could be in a different folder if installed separately.
VisualVM will launch and load all the Java applications running locally by default:
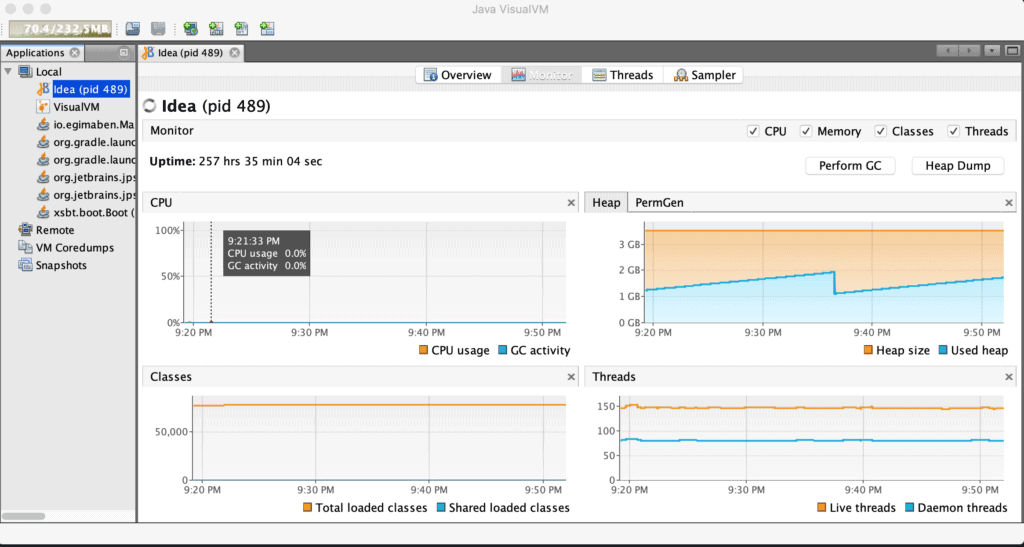
3.3. Features
VisualVM provides several useful features:
- Display of local and remote Java application processes
- Monitoring process performance in terms of CPU usage, GC activity, number of loaded classes, and other metrics
- Visualizing threads in all processes and the times they spend in different states such as sleeping and waiting
- Taking and displaying thread dumps for immediate insights into what is going on in the processes being monitored
The VisualVM features page has a more comprehensive list of available features. Like all well-designed software, VisualVM can be extended to access more advanced and unique features by installing third-party plugins available on the Plugins tab.
4. Remote Monitoring
In this section, we’ll demonstrate how to monitor a Java application using VisualVM and JMX remotely. We’ll also get a chance to explore all the necessary configurations and JVM startup options.
4.1. Application Configuration
We launch most, if not all, Java applications with a startup script. In this script, the start command usually passes essential parameters to the JVM to specify the application’s needs, such as maximum and minimum memory requirements.
Assuming we have an application packaged as MyApp.jar, let’s see an example startup command that includes the main JMX configuration parameters:
java -Dcom.sun.management.jmxremote.port=8080
-Dcom.sun.management.jmxremote.ssl=false
-Dcom.sun.management.jmxremote.authenticate=false
-Xms1024m -Xmx1024m -jar MyApp.jar
In the command above, MyApp.jar is launched with out-of-the-box monitoring capability configured via port 8080. Furthermore, we deactivated SSL encryption and password authentication for simplicity.
In a production setting, we should, ideally, secure communication between VisualVM and the JVM application when in a public network.
4.2. VisualVM Configuration
Now that we have VisualVM running locally and our MyApp.jar running on a remote server, we can begin our remote monitoring session.
Right-click on the left panel and select Add JMX Connection:
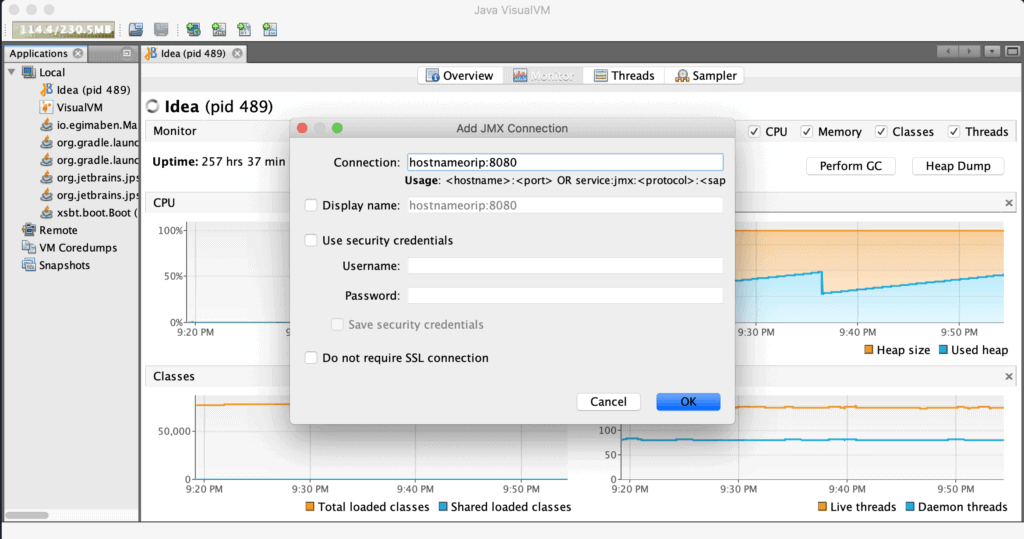
Input the host:port combination in the Connection field in the resulting dialog box and click OK.
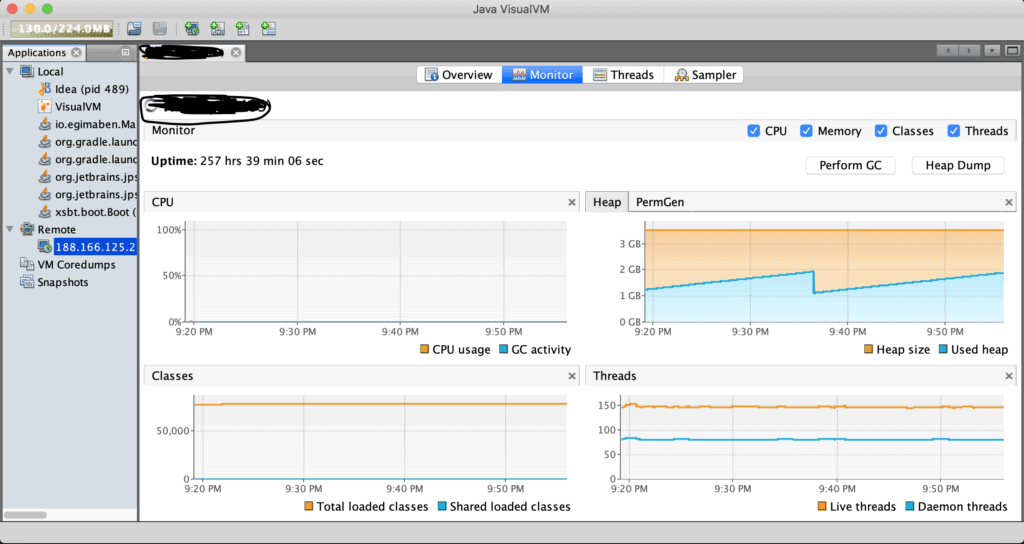
If successful, we should now be able to see a monitoring window by double-clicking the new connection from the left panel:
5. Conclusion
In this article, we’ve explored remote monitoring of Java applications with VisualVM and JMX.


