OpenTelemetry Setup in Spring Boot Application
Last updated: April 30, 2025


Mocking is an essential part of unit testing, and the Mockito library makes it easy to write clean and intuitive unit tests for your Java code.
Get started with mocking and improve your application tests using our Mockito guide:
Handling concurrency in an application can be a tricky process with many potential pitfalls. A solid grasp of the fundamentals will go a long way to help minimize these issues.
Get started with understanding multi-threaded applications with our Java Concurrency guide:
Spring 5 added support for reactive programming with the Spring WebFlux module, which has been improved upon ever since. Get started with the Reactor project basics and reactive programming in Spring Boot:
Since its introduction in Java 8, the Stream API has become a staple of Java development. The basic operations like iterating, filtering, mapping sequences of elements are deceptively simple to use.
But these can also be overused and fall into some common pitfalls.
To get a better understanding on how Streams work and how to combine them with other language features, check out our guide to Java Streams:
Explore Spring Boot 3 and Spring 6 in-depth through building a full REST API with the framework:
Yes, Spring Security can be complex, from the more advanced functionality within the Core to the deep OAuth support in the framework.
I built the security material as two full courses - Core and OAuth, to get practical with these more complex scenarios. We explore when and how to use each feature and code through it on the backing project.
You can explore the course here:
Spring Data JPA is a great way to handle the complexity of JPA with the powerful simplicity of Spring Boot.
Get started with Spring Data JPA through the guided reference course:
Refactor Java code safely — and automatically — with OpenRewrite.
Refactoring big codebases by hand is slow, risky, and easy to put off. That’s where OpenRewrite comes in. The open-source framework for large-scale, automated code transformations helps teams modernize safely and consistently.
Each month, the creators and maintainers of OpenRewrite at Moderne run live, hands-on training sessions — one for newcomers and one for experienced users. You’ll see how recipes work, how to apply them across projects, and how to modernize code with confidence.
Join the next session, bring your questions, and learn how to automate the kind of work that usually eats your sprint time.
1. Overview
In a distributed system, it’s expected that occasional errors are bound to happen when serving requests. A central observability platform helps by capturing application traces/logs and provides an interface to query for a specific request. OpenTelemetry helps in standardizing the process of capturing and exporting telemetry data.
In this tutorial, we’ll learn how to integrate a Spring Boot Application with OpenTelemetry using the Micrometer facade. Also, we’ll run an OpenTelemetry service to capture application traces and send them to a central system to monitor the requests.
First, let’s understand a few basic concepts.
2. Introduction to OpenTelemetry
OpenTelemetry (Otel) is a collection of standardized vendor-agnostic tools, APIs, and SDKs. It’s a CNCF incubating project and is a merger of the OpenTracing and OpenCensus projects.
OpenTracing is a vendor-neutral API for sending telemetry data over to an observability backend. The OpenCensus project provides a set of language-specific libraries that developers can use to instrument their code and send it to any supported backends. Otel uses the same concept of trace and span to represent the request flow across microservices as used by its predecessor projects.
OpenTelemetry allows us to instrument, generate, and collect telemetry data, which helps in analyzing application behavior or performance. Telemetry data can include logs, metrics, and traces. We can either automatically or manually instrument the code for HTTP, DB calls, and more.
Spring Boot 3 supports OpenTelemetry via Micrometer Tracing – a consistent, pluggable, vendor-neutral API.
Notably, the earlier Spring Cloud Sleuth framework has been deprecated in Spring Boot 3, and its tracing functionality has been migrated to Micrometer Tracing.
Let’s take a deep dive into this with an example.
3. Example Application
Let’s imagine we need to build two microservices, where one service interacts with the other.
For instrumenting the application for telemetry data, we’ll integrate the application with the Micrometer tracing and OpenTelemetry exporter libraries.
3.1. Maven Dependencies
The micrometer-tracing, micrometer-tracing-bridge-otel and opentelemetry-exporter-otlp dependencies automatically capture and export traces to any supported collector.
First, we’ll start by creating a Spring Boot 3 Web project, and include the below Spring Boot 3 starter, Micrometer and OpenTelemetry dependencies into both applications:
<dependency>
    <groupId>org.springframework.boot</groupId>
    <artifactId>spring-boot-starter-web</artifactId>
    <version>3.4.4</version>
</dependency>
<dependency>
    <groupId>org.springframework.boot</groupId>
    <artifactId>spring-boot-starter-actuator</artifactId>
    <version>3.4.4</version>
</dependency>
<dependency>
    <groupId>io.micrometer</groupId>
    <artifactId>micrometer-tracing</artifactId>
    <version>1.4.4</version>
</dependency>
<dependency>
    <groupId>io.micrometer</groupId>
    <artifactId>micrometer-tracing-bridge-otel</artifactId>
    <version>1.4.4</version>
</dependency>
<dependency>
    <groupId>io.opentelemetry</groupId>
    <artifactId>opentelemetry-exporter-otlp</artifactId>
    <version>1.39.0</version>
</dependency>
Next, we’ll implement the downstream service.
3.2. Implement the Downstream Application
Our downstream application will have an endpoint to return Price data.
First, let’s model the Price class:
public class Price {
    private long productId;
    private double priceAmount;
    private double discount;
}
Next, let’s implement the PriceController with the endpoint to get price:
@RestController(value = "/price")
public class PriceController {

    private static final Logger LOGGER = LoggerFactory.getLogger(PriceController.class);

    @Autowired
    private PriceRepository priceRepository;

    @GetMapping(path = "/{id}")
    public Price getPrice(@PathVariable("id") long productId) {
        LOGGER.info("Getting Price details for Product Id {}", productId);
        return priceRepository.getPrice(productId);
    }
}
Then, we’ll implement the getPrice() method in PriceRepository:
public Price getPrice(Long productId){
    LOGGER.info("Getting Price from Price Repo With Product Id {}", productId);
    if (!priceMap.containsKey(productId)){
        LOGGER.error("Price Not Found for Product Id {}", productId);
        throw new PriceNotFoundException("Price Not Found");
    }
    return priceMap.get(productId);
}
In the above code, we’re either returning the price or throwing an exception when the product is not found.
3.3. Implement the Upstream Application
The upstream application will also have an endpoint to get the Product details and integrate with the above Get Price endpoint.
First, let’s implement the Product class:
public class Product {
    private long id;
    private String name;
    private Price price;
}
Then, let’s implement the ProductController class with an endpoint for getting products:
@RestController
public class ProductController {

    private static final Logger LOGGER = LoggerFactory.getLogger(ProductController.class);

    @Autowired
    private PriceClient priceClient;

    @Autowired
    private ProductRepository productRepository;

    @GetMapping(path = "/product/{id}")
    public Product getProductDetails(@PathVariable("id") long productId){
        LOGGER.info("Getting Product and Price Details with Product Id {}", productId);
        Product product = productRepository.getProduct(productId);
        product.setPrice(priceClient.getPrice(productId));
        return product;
    }
}
Next, we’ll implement the getProduct() method in the ProductRepository class:
public Product getProduct(Long productId){
    LOGGER.info("Getting Product from Product Repo With Product Id {}", productId);
    if (!productMap.containsKey(productId)){
        LOGGER.error("Product Not Found for Product Id {}", productId);
        throw new ProductNotFoundException("Product Not Found");
    }
    return productMap.get(productId);
}
Also, we’ll need to explicitly define the RestTemplate bean using the RestTemplateBuilder, as it’s required in Spring Boot version 3:
@Bean
RestTemplate restTemplate(RestTemplateBuilder builder) {
    return builder.build();
}
Finally, let’s implement the getPrice() method in the PriceClient class:
public Price getPrice(@PathVariable("id") long productId){
    LOGGER.info("Fetching Price Details With Product Id {}", productId);
    String url = String.format("%s/price/%d", baseUrl, productId);
    ResponseEntity<Price> price = restTemplate.getForEntity(url, Price.class);
    return price.getBody();
}
In the above code, we’re calling the downstream service to fetch the price.
4. Configure Spring Boot With OpenTelemetry
OpenTelemetry provides a collector known as an Otel collector that processes and exports the telemetry data to any observability backends like Jaeger, Prometheus, and others.
The traces can be exported to any OpenTelemetry collector using Spring management configuration.
4.1. Configure Spring
We’ll need to configure the application with the management.tracing.sampling.probability and management.otlp.tracing.endpoint properties to export tracing data.
Let’s include the management configuration in the application.yml:
management:
  tracing:
    sampling:
      probability: '1.0'
  otlp:
    tracing:
      endpoint: http://collector:4318/v1/traces
The trace-sampling-probability-based property defines the sampling ratio for the spans collected. The value 1.0 means that all spans will be exported.
5. Run the Application
We’ll now configure and run the entire setup, the applications, and an Otel collector service like Jaeger to quickly bootstrap.
5.1. Configure Dockerfile in the Application
Let’s implement the Dockerfile for our Product service:
FROM openjdk:17-alpine
COPY target/spring-cloud-open-telemetry1-1.0.0-SNAPSHOT.jar spring-cloud-open-telemetry.jar
EXPOSE 8080
ENTRYPOINT ["java","-jar","/spring-cloud-open-telemetry.jar"]
We should note that the Dockerfile for the Price service is essentially the same.
5.2. Configure Services With Docker Compose
Now, let’s configure the docker-compose.yml with the entire setup:
services:
  product-service:
    build: spring-boot-open-telemetry1/
    ports:
      - "8080:8080"

  price-service:
    build: spring-boot-open-telemetry2/
    ports:
      - "8081"

  collector:
    image: jaegertracing/jaeger:2.5.0
    ports:
      - "4318:4318"
      - "16686:16686"
In the above collector service, we’re using the jaegertracing/jaeger v2 all-in-one image. It now has built-in support for OpenTelemetry, and so we don’t need a separate OpenTelemetry service running.
Below is the overall architecture of the services involved:

In the above architecture diagram, we’ve the implemented API services which is exporting the spans to the Jaeger v2 service. The Jaeger v2 service internally has three main component i.e. collector/receiver, storage and UI service.
We should note that for any production-ready observability setup, we should ideally run the OpenTelemetry collector, storage and Query/UI services separately to ensure separation of concerns.
Let’s now run the services via docker-compose:
$ docker-compose upWe’ll now validate the running docker services.
5.3. Validate the Running Docker Services
Along with the product-service and price-service, we’ve added the Jaeger service into the entire setup.
The above product-service and price-service use the HTTP port 4318 to send the trace data to the Jaeger collector.
Let’s verify the service status using the docker container command:
$ docker container ls --format "table {{.ID}}\t{{.Names}}\t{{.Status}}\t{{.Ports}}"We’ll get the service status similar to the below:
125c47300f69   spring-boot-open-telemetry-product-service-1   Up 19 seconds   0.0.0.0:8080->8080/tcp
5e8477630211   spring-boot-open-telemetry-price-service-1     Up 19 seconds   0.0.0.0:49775->8081/tcp
6ace8520779a   spring-boot-open-telemetry-collector-1         Up 19 seconds   4317-4318/tcp, 5778-5779/tcp, 9411/tcp, 13132-13133/tcp, 14250/tcp, 14268/tcp, 0.0.0.0:16686->16686/tcp
From the above command output, we confirm that the all services are running.
6. Monitor Traces in the Collector
OpenTelemetry collector tools like Jaeger also provide front-end applications to monitor the requests. We can view the request traces in real time or later on.
Let’s monitor the traces when the request succeeds as well as when it fails.
6.1. Monitor Traces When Request Succeeds
First, let’s call the Product endpoint http://localhost:8080/product/100001.
The request makes some logs appear:
product-service-1  | 2025-04-08T04:21:08.372Z  INFO 1 --- [product-service] [nio-8080-exec-1] [ca9845ffc9130c579d41f2f2ef61874a-ccb2d4cd80180fe9] c.b.o.repository.ProductRepository       : Getting Product from Product Repo With Product Id 100001
product-service-1  | 2025-04-08T04:21:08.373Z  INFO 1 --- [product-service] [nio-8080-exec-1] [ca9845ffc9130c579d41f2f2ef61874a-ccb2d4cd80180fe9] c.b.o.api.client.PriceClient             : Fetching Price Details With Product Id 100001
price-service-1    | 2025-04-08T04:21:08.731Z  INFO 1 --- [price-service] [nio-8081-exec-1] [ca9845ffc9130c579d41f2f2ef61874a-60bf6b4856b145f6] c.b.o.controller.PriceController         : Getting Price details for Product Id 100001
Micrometer will automatically configure the ProductService to attach the trace and span id to the current thread context and as an HTTP Header to the downstream API calls. The PriceService will also automatically include the same trace id in the thread context and logs. The Jaeger collector service will use this trace id to determine the request flow across the services.
As expected, the above trace id ….f61874a is the same in both PriceService and ProductService logs.
Let’s visualize the whole request spans timeline in the Jaeger UI hosted at port 16686:
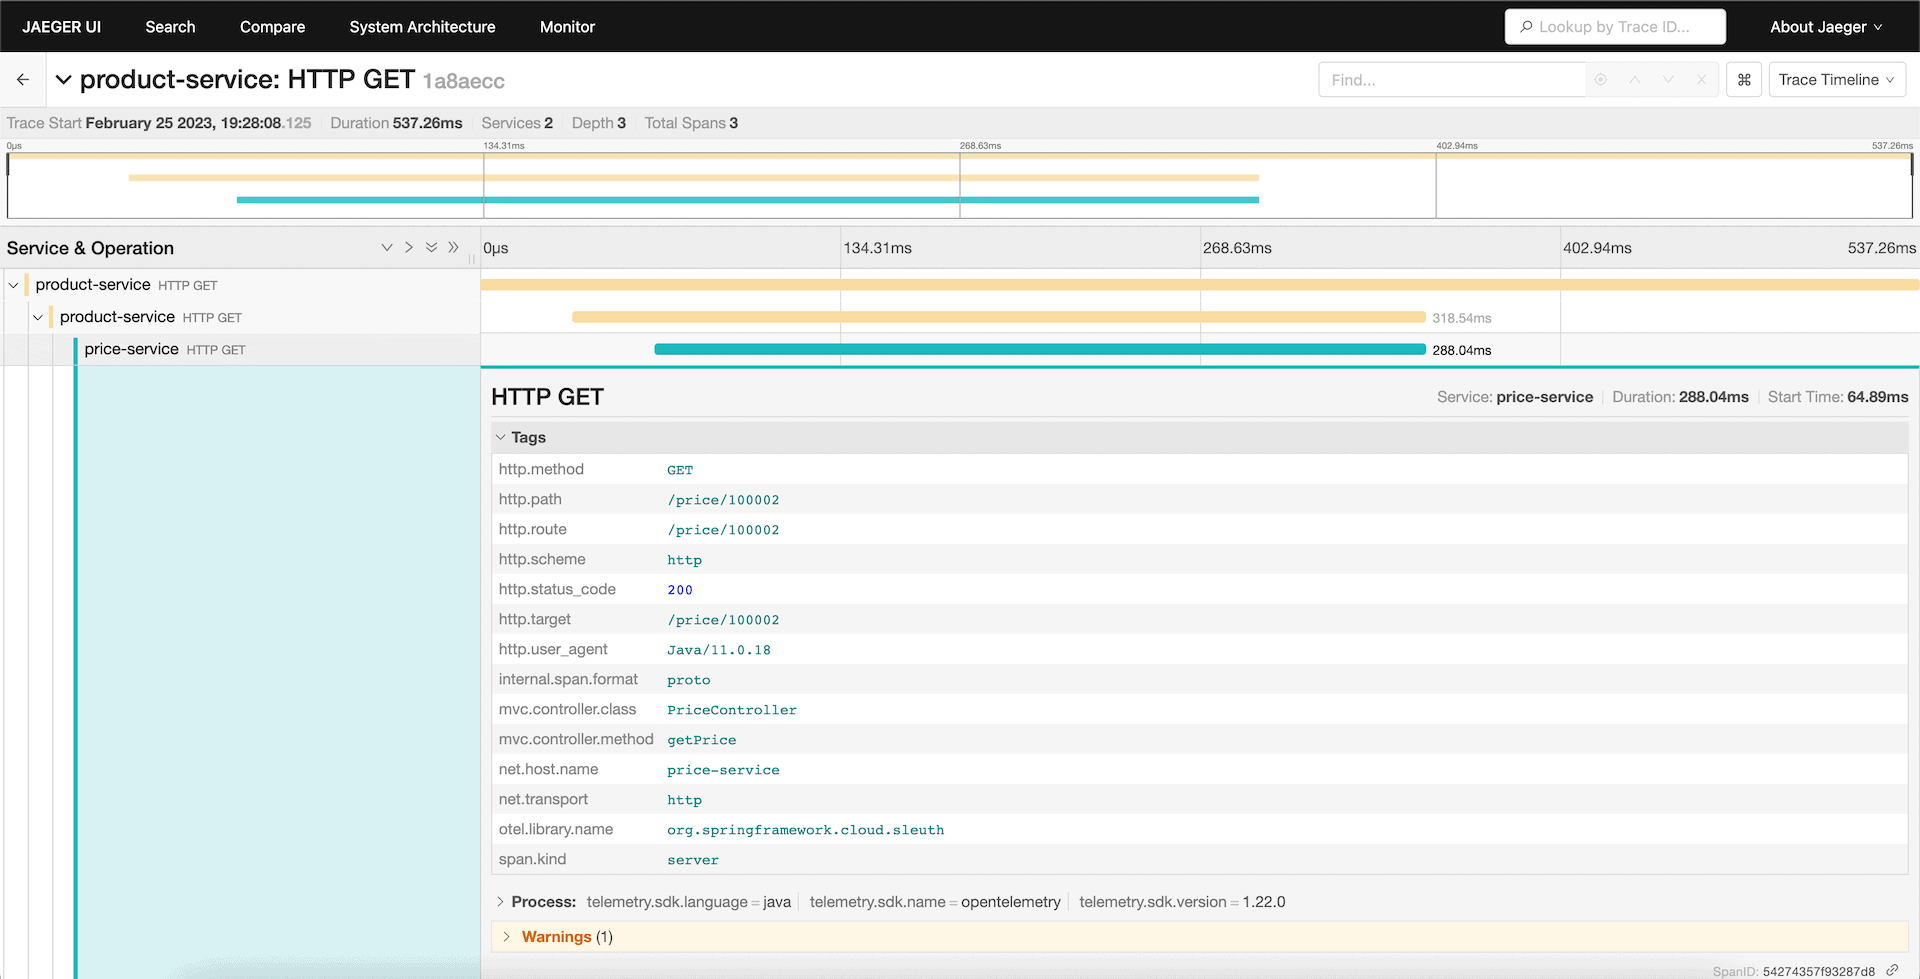
The above shows the timeline of the request flows and contains the metadata to represent the request.
6.2. Monitor Traces When Request Fails
Let’s imagine a scenario where the downstream service throws an exception, which results in request failure.
Again, we’ll leverage the same UI to analyze the root cause.
Let’s test the above scenario with the Product endpoint /product/100005 call where the Product is not present in the downstream application.
Now, let’s visualize the failed request spans:
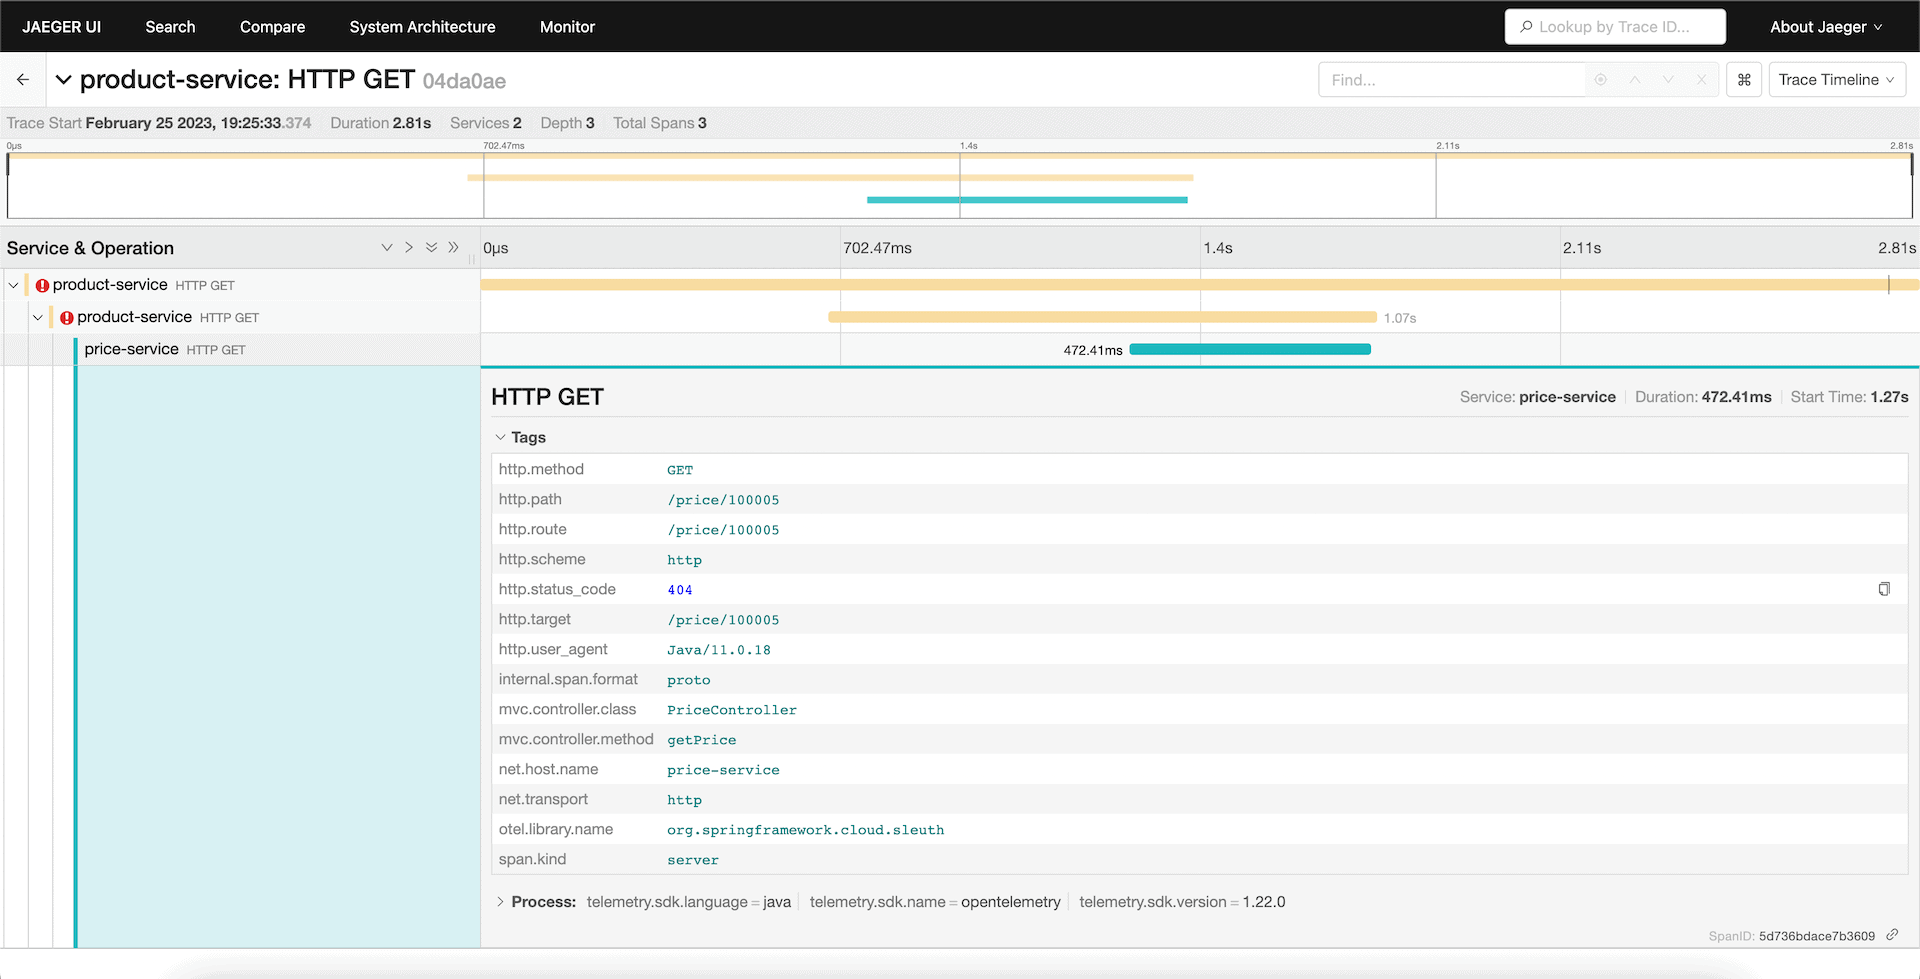
As we see above, we can trace back the request to the final API call where the error has originated.
7. Conclusion
In this article, we’ve learned how OpenTelemetry helps in standardizing observability patterns for microservices.
We’ve also seen how to configure the Spring Boot 3 application with OpenTelemetry using the Micrometer tracing facade with an example. Finally, we traced an API request flow in the Jaeger UI service.