

Mocking is an essential part of unit testing, and the Mockito library makes it easy to write clean and intuitive unit tests for your Java code.
Get started with mocking and improve your application tests using our Mockito guide:
Handling concurrency in an application can be a tricky process with many potential pitfalls. A solid grasp of the fundamentals will go a long way to help minimize these issues.
Get started with understanding multi-threaded applications with our Java Concurrency guide:
Spring 5 added support for reactive programming with the Spring WebFlux module, which has been improved upon ever since. Get started with the Reactor project basics and reactive programming in Spring Boot:
Since its introduction in Java 8, the Stream API has become a staple of Java development. The basic operations like iterating, filtering, mapping sequences of elements are deceptively simple to use.
But these can also be overused and fall into some common pitfalls.
To get a better understanding on how Streams work and how to combine them with other language features, check out our guide to Java Streams:
Explore Spring Boot 3 and Spring 6 in-depth through building a full REST API with the framework:
Yes, Spring Security can be complex, from the more advanced functionality within the Core to the deep OAuth support in the framework.
I built the security material as two full courses - Core and OAuth, to get practical with these more complex scenarios. We explore when and how to use each feature and code through it on the backing project.
You can explore the course here:
Spring Data JPA is a great way to handle the complexity of JPA with the powerful simplicity of Spring Boot.
Get started with Spring Data JPA through the guided reference course:
Refactor Java code safely — and automatically — with OpenRewrite.
Refactoring big codebases by hand is slow, risky, and easy to put off. That’s where OpenRewrite comes in. The open-source framework for large-scale, automated code transformations helps teams modernize safely and consistently.
Each month, the creators and maintainers of OpenRewrite at Moderne run live, hands-on training sessions — one for newcomers and one for experienced users. You’ll see how recipes work, how to apply them across projects, and how to modernize code with confidence.
Join the next session, bring your questions, and learn how to automate the kind of work that usually eats your sprint time.
Yes, we're now running our only Summer Sale. All Courses are 30% off until 20th July, 2026:
Yes, we're now running our only Summer Sale. All Courses are 30% off until 20th July, 2026:
1. Introduction
Grafana Labs developed Loki, an open-source log aggregation system inspired by Prometheus. Its purpose is to store and index log data, facilitating efficient querying and analysis of logs generated by diverse applications and systems.
In this article, we’ll set up logging with Grafana Loki for a Spring Boot application. Loki will collect and aggregate the application logs, and Grafana will display them.
2. Running Loki and Grafana Services
We’ll first spin up Loki and Grafana services so that we can collect and observe logs. Docker containers will help us to more easily configure and run them.
First, let’s compose Loki and Grafana services in a docker-compose file:
version: "3"
networks:
  loki:
services:
  loki:
    image: grafana/loki:2.9.0
    ports:
      - "3100:3100"
    command: -config.file=/etc/loki/local-config.yaml
    networks:
      - loki
  grafana:
    environment:
      - GF_PATHS_PROVISIONING=/etc/grafana/provisioning
      - GF_AUTH_ANONYMOUS_ENABLED=true
      - GF_AUTH_ANONYMOUS_ORG_ROLE=Admin
    entrypoint:
      - sh
      - -euc
      - |
        mkdir -p /etc/grafana/provisioning/datasources
        cat <<EOF > /etc/grafana/provisioning/datasources/ds.yaml
        apiVersion: 1
        datasources:
        - name: Loki
          type: loki
          access: proxy
          orgId: 1
          url: http://loki:3100
          basicAuth: false
          isDefault: true
          version: 1
          editable: false
        EOF
        /run.sh
    image: grafana/grafana:latest
    ports:
      - "3000:3000"
    networks:
      - loki
Next, we need to bring up the services using the docker-compose command:
docker-compose upFinally, let’s confirm if both services are up:
docker ps

211c526ea384        grafana/loki:2.9.0       "/usr/bin/loki -conf…"   4 days ago          Up 56 seconds       0.0.0.0:3100->3100/tcp   surajmishra_loki_1
a1b3b4a4995f        grafana/grafana:latest   "sh -euc 'mkdir -p /…"   4 days ago          Up 56 seconds       0.0.0.0:3000->3000/tcp   surajmishra_grafana_1
3. Configuring Loki With Spring Boot
Once we’ve spun up Grafana and the Loki service, we need to configure our application to send logs to it. We’ll use loki-logback-appender, which will be responsible for sending logs to the Loki aggregator to store and index logs.
First, we need to add loki-logback-appender in the pom.xml file:
<dependency>
    <groupId>com.github.loki4j</groupId>
    <artifactId>loki-logback-appender</artifactId>
    <version>1.4.1</version>
</dependency>
Second, we need to create a logback-spring.xml file under the src/main/resources folder. This file will control the logging behavior, such as the format of logs, the endpoint of our Loki service, and others, for our Spring Boot application:
<?xml version="1.0" encoding="UTF-8"?>
<configuration>
   <appender name="LOKI" class="com.github.loki4j.logback.Loki4jAppender">
        <http>
            <url>http://localhost:3100/loki/api/v1/push</url>
        </http>
        <format>
            <label>
                <pattern>app=${name},host=${HOSTNAME},level=%level</pattern>
                <readMarkers>true</readMarkers>
            </label>
            <message>
                <pattern>
                    {
                    "level":"%level",
                    "class":"%logger{36}",
                    "thread":"%thread",
                    "message": "%message",
                    "requestId": "%X{X-Request-ID}"
                    }
                </pattern>
            </message>
         </format>
     </appender>

     <root level="INFO">
        <appender-ref ref="LOKI" />
     </root>
</configuration>
Once we finish setting up, let’s write a simple service that logs data at INFO level:
@Service
class DemoService{

    private final Logger LOG = LoggerFactory.getLogger(DemoService.class);

    public void log(){
        LOG.info("DemoService.log invoked");
    }
}
4. Test Verification
Let’s conduct a live test by spinning up Grafana and Loki containers, and then executing the service method to push the logs to Loki. Afterward, we’ll query Loki using the HTTP API to confirm if the log was indeed pushed. For spinning up Grafana and Loki containers, please see the earlier section.
First, let’s execute the DemoService.log() method, which will call Logger.info(). This sends a message using the loki-logback-appender, which Loki will collect:
DemoService service = new DemoService();
service.log();
Second, we’ll create a request for invoking the REST endpoint provided by the Loki HTTP API. This GET API accepts query parameters representing the query, start time, and end time. We’ll add those parameters as part of our request object:
HttpHeaders headers = new HttpHeaders();
headers.setContentType(MediaType.APPLICATION_JSON);

String query = "{level=\"INFO\"} |= `DemoService.log invoked`";

// Get time in UTC
LocalDateTime currentDateTime = LocalDateTime.now(ZoneOffset.UTC);
String current_time_utc = currentDateTime.format(DateTimeFormatter.ofPattern("yyyy-MM-dd'T'HH:mm:ss'Z'"));

LocalDateTime tenMinsAgo = currentDateTime.minusMinutes(10);
String start_time_utc = tenMinsAgo.format(DateTimeFormatter.ofPattern("yyyy-MM-dd'T'HH:mm:ss'Z'"));

URI uri = UriComponentsBuilder.fromUriString(baseUrl)
  .queryParam("query", query)
  .queryParam("start", start_time_utc)
  .queryParam("end", current_time_utc)
  .build()
  .toUri();
Next, let’s use the request object to execute REST request:
RestTemplate restTemplate = new RestTemplate();
ResponseEntity<String> response = restTemplate.exchange(uri, HttpMethod.GET, new HttpEntity<>(headers), String.class);
Now we need to process the response and extract the log messages we’re interested in. We’ll use an ObjectMapper to read the JSON response and extract the log messages:
ObjectMapper objectMapper = new ObjectMapper();
List<String> messages = new ArrayList<>();
String responseBody = response.getBody();
JsonNode jsonNode = objectMapper.readTree(responseBody);
JsonNode result = jsonNode.get("data")
  .get("result")
  .get(0)
  .get("values");

result.iterator()
  .forEachRemaining(e -> {
      Iterator<JsonNode> elements = e.elements();
      elements.forEachRemaining(f -> messages.add(f.toString()));
  });
Finally, let’s assert that the messages we receive in the response contain the message that was logged by the DemoService:
assertThat(messages).anyMatch(e -> e.contains(expected));5. Log Aggregation and Visualization
Our service logs are pushed to the Loki service because of the configuration setup with the loki-logback-appender. We can visualize it by visiting http://localhost:3000 (where the Grafana service is deployed) in our browser.
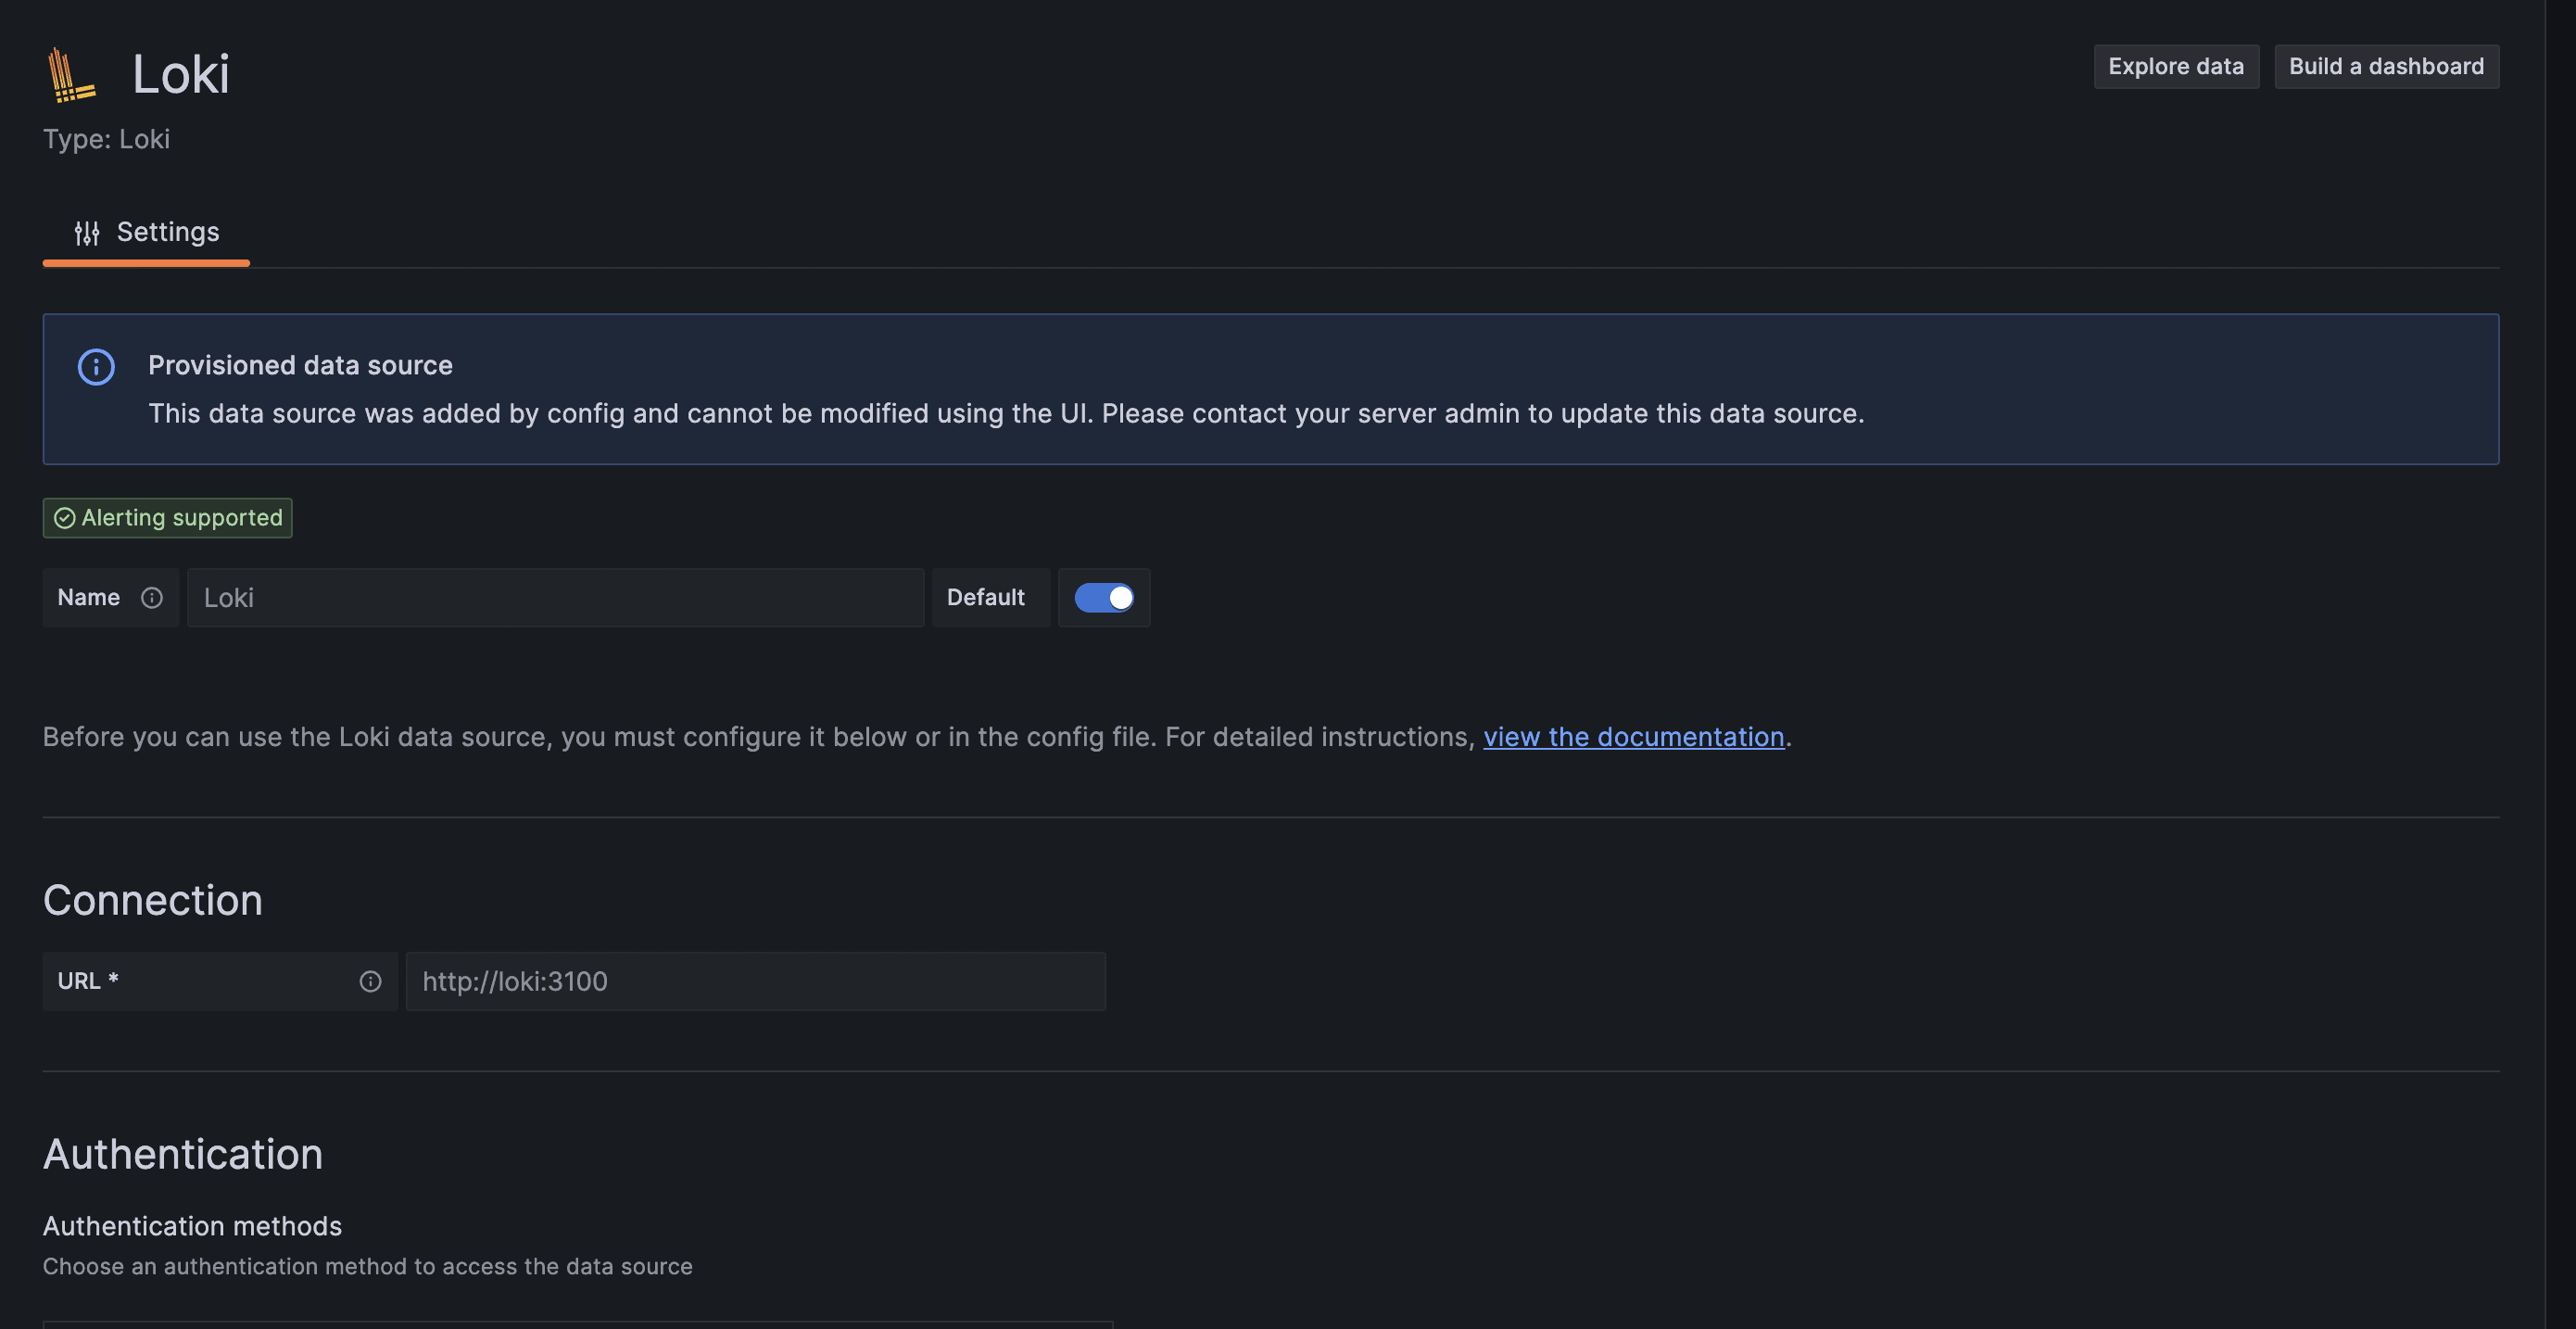
To see logs that have been stored and indexed in Loki, we need to use Grafana. The Grafana datasource provides configurable connection parameters for Loki where we need to enter the Loki endpoint, authentication mechanism, and more.
First, let’s configure the Loki endpoint to which logs have been pushed:
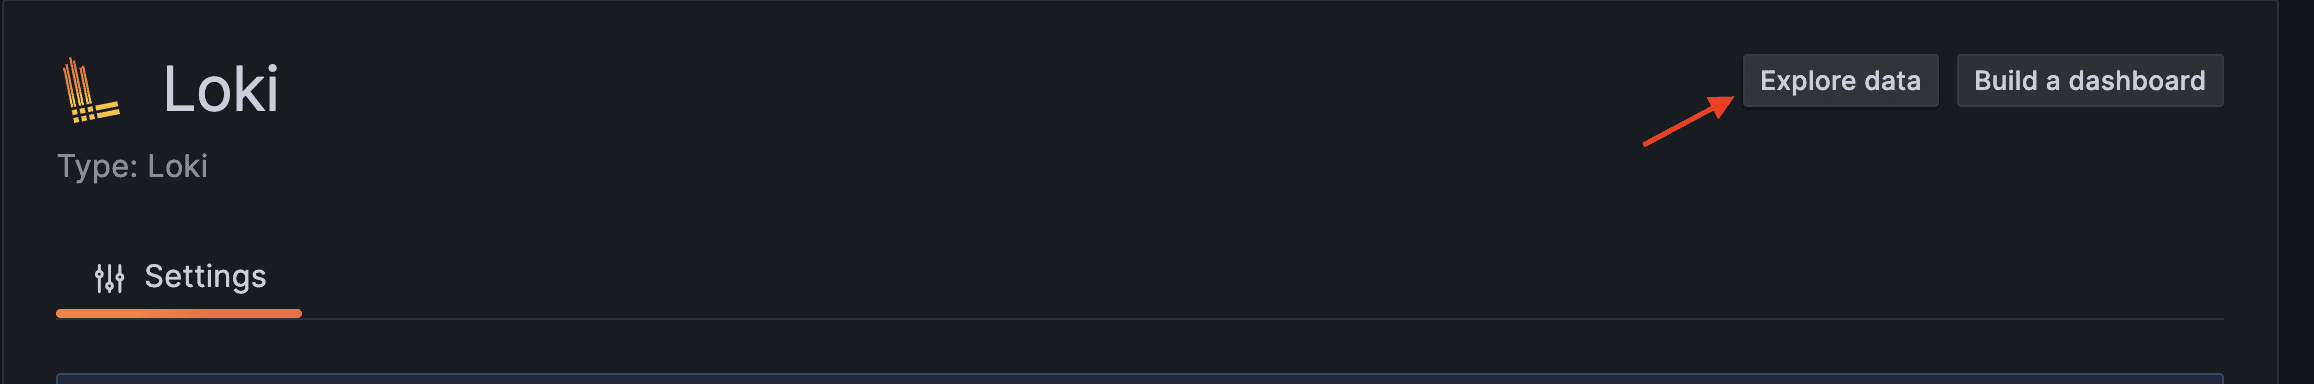
Once we’ve successfully configured the data source, let’s move to explore the data page for querying our logs:
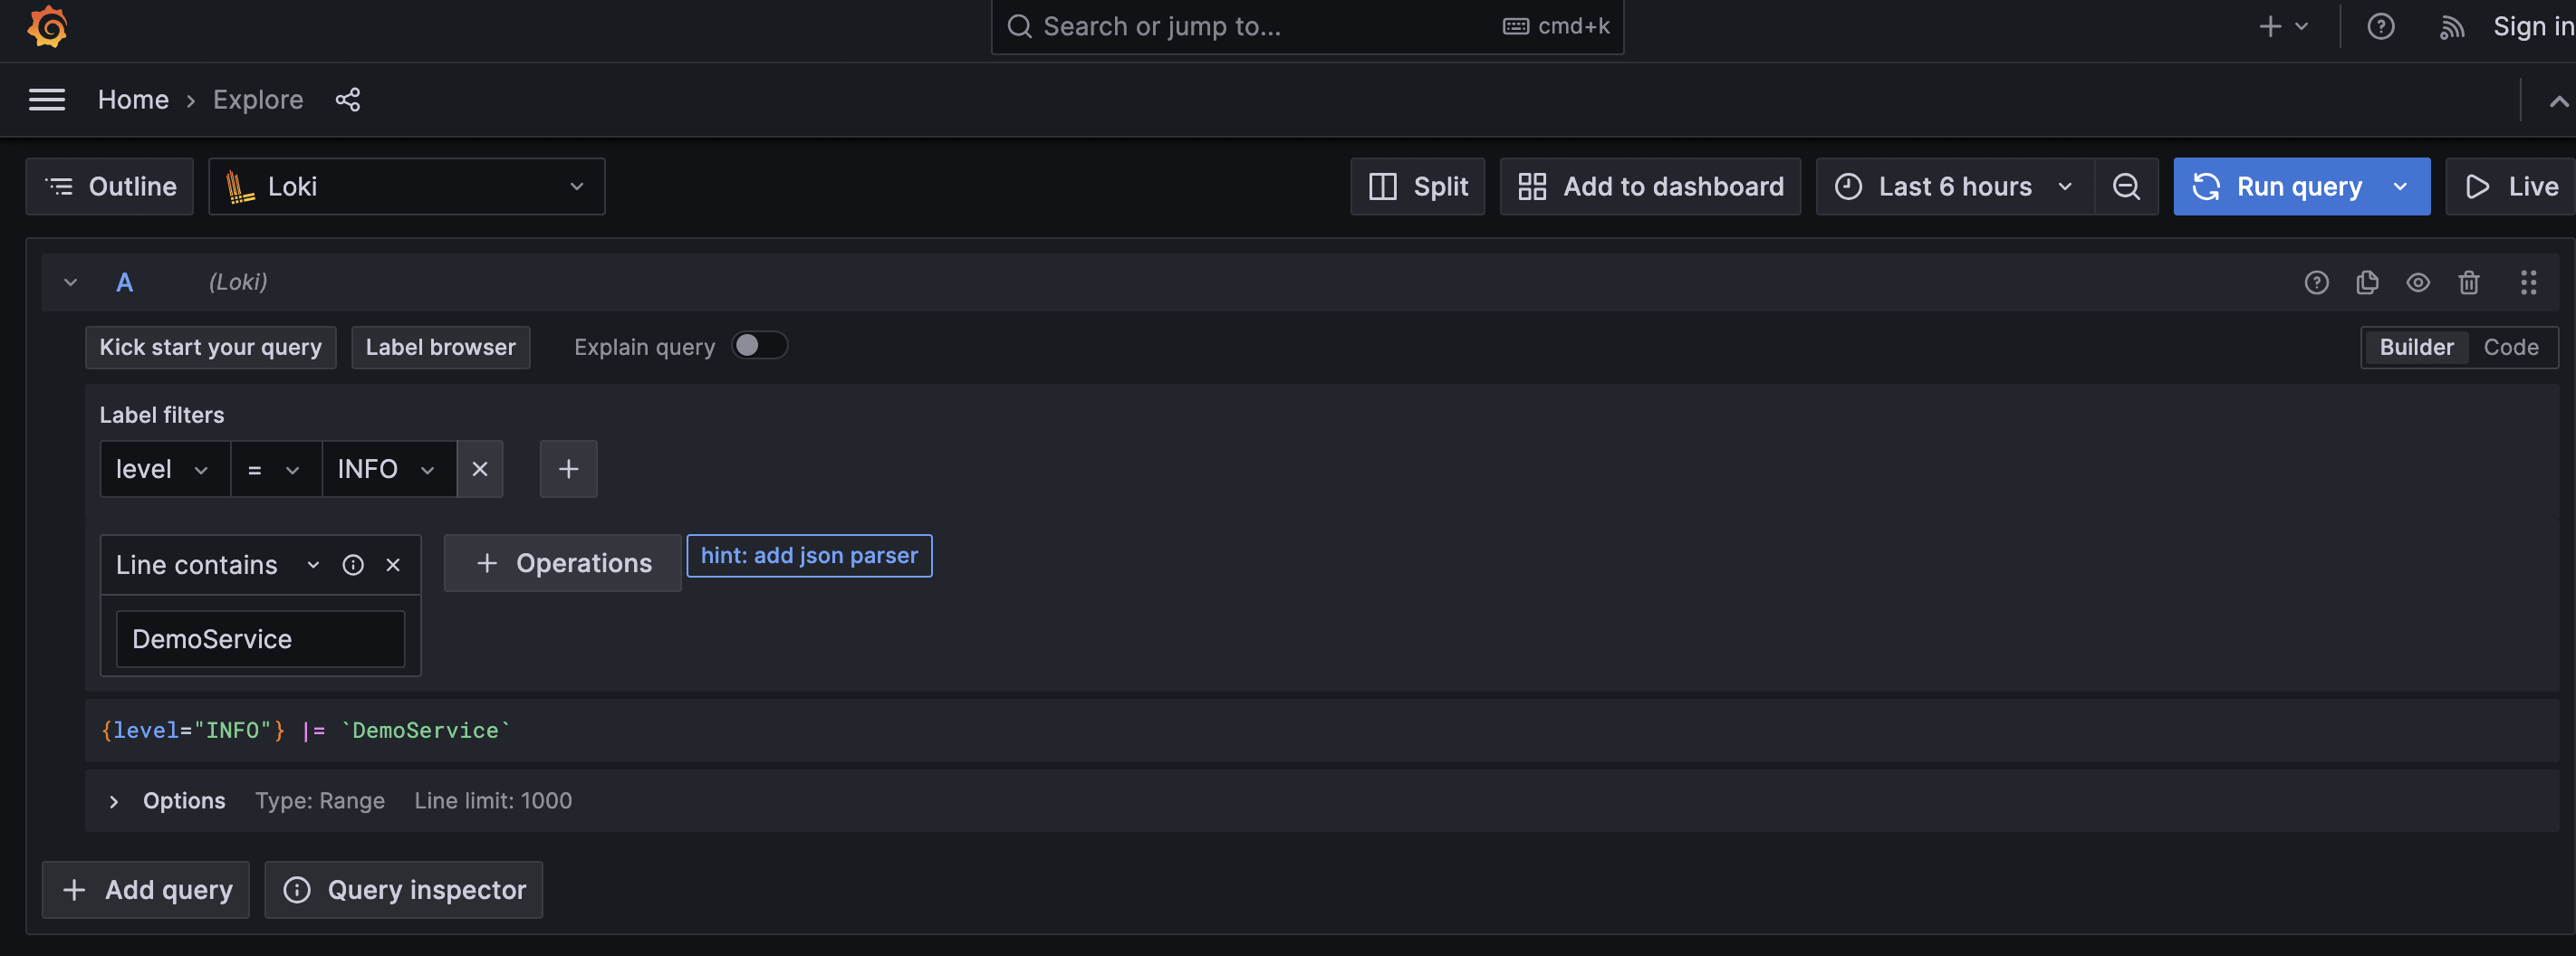
We can write our query to fetch app logs into Grafana for visualization. In our demo service, we’re pushing INFO logs, so we need to add that to our filter and run the query:
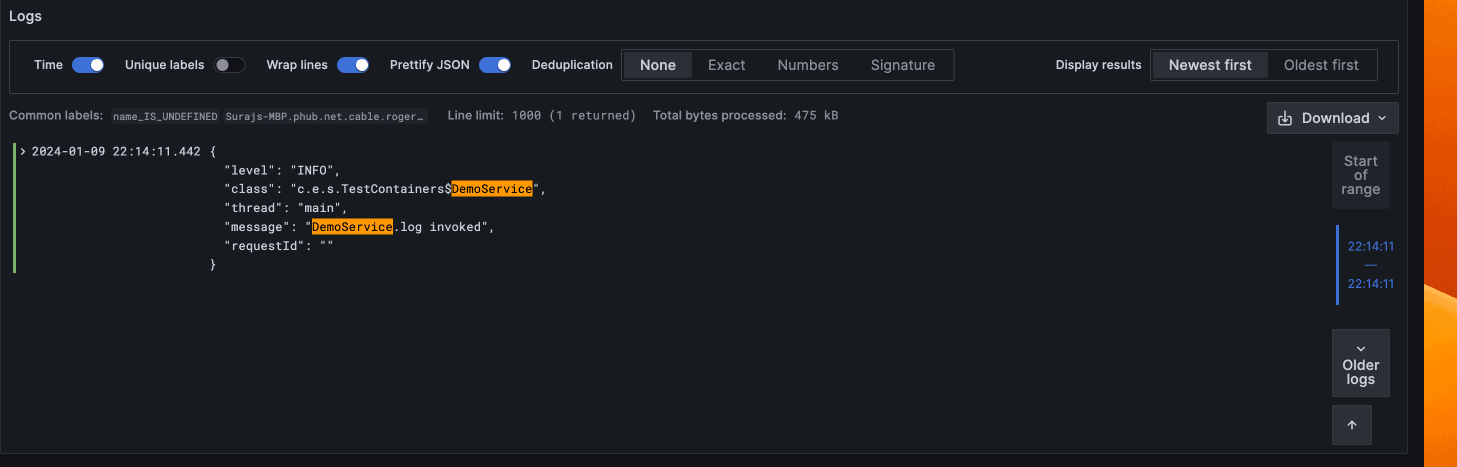
Once we run the query, we’ll see all the INFO logs that match our search:
6. Conclusion
In this article, we set up logging for a Spring Boot application with Grafana Loki. We also verified our setup with a unit test and visualization, using simple logic that logged INFO logs and setting a Loki data source in Grafana.


