

Yes, we're now running our only Summer Sale. All Courses are 30% off until 20th July, 2026:
Learn through the super-clean Baeldung Pro experience:
>> Membership and Baeldung Pro.
No ads, dark-mode and 6 months free of IntelliJ Idea Ultimate to start with.
1. Introduction
Observability is an important quality attribute of any large software system. This includes a wide range of topics such as log aggregation, metrics, tracing, and more.
In this tutorial, we’ll look at Grafana Loki, a log aggregation system that’s part of the Grafana ecosystem.
2. What Is Grafana Loki?
Grafana is one of the leading providers of software observability tools. Loki is Grafana’s log aggregation component. Inspired by Prometheus, it’s highly scalable and capable of handling petabytes of log data.
2.1. How Does Grafana Loki Work?
Loki works a little differently from other log aggregation systems. Instead of indexing entire log messages, Loki only indexes the labels and metadata from each message. The log message itself is compressed and available for querying in Grafana.
This approach has the benefit that it can process lots of messages quickly. It also requires less storage than other log aggregation systems.
However, by not indexing log message contents, Loki lacks some of the more sophisticated search capabilities of its counterparts.
We’ll look more at searching log messages later.
3. Using Grafana Loki
Now that we know what Grafana Loki is, let’s take a look at how to use it.
3.1. Installing
There are multiple ways to install Loki for a variety of environments. We’ll use a modified version of the Loki Getting Started steps to create a simple test deployment. These steps use Docker Compose and aren’t suitable for production workloads.
Let’s start by creating a working directory and downloading some sample configuration files:
$ mkdir grafana-loki
$ cd grafana-loki
$ wget https://raw.githubusercontent.com/grafana/loki/main/examples/getting-started/loki-config.yaml -O loki-config.yaml
$ wget https://raw.githubusercontent.com/grafana/loki/main/examples/getting-started/promtail-local-config.yaml -O promtail-local-config.yaml
$ wget https://raw.githubusercontent.com/grafana/loki/main/examples/getting-started/docker-compose.yaml -O docker-compose.yaml
Now we can start the required applications:
$ docker-compose up -dThis deployment starts several applications:
- flog: a test application that generates fake log messages
- promtail: an agent that consumes log messages and sends them to Grafana
- gateway: an Nginx container for routing requests between containers
- loki: two instances of the Grafana Loki application, one for read operations and one for write operations
- minio: an open-source object storage engine used to store log message data
- grafana: the graphical interface for viewing data
The reason for deploying two Loki instances is for scalability. The write agent handles ingesting new log messages, while the read agent handles query requests. This is part of what makes Loki incredibly scalable.
To confirm the deployment is up and running, we can check the following URLs:
- http://localhost:3101/ready
- http://localhost:3102/ready
The first URL is for the Loki read agent, and the second is for the write agent. Both return a simple ready text response when they are initialized.
3.2. Sending Data
The promtail agent is responsible for collecting log messages and passing them to a Loki agent. In a typical setup, we would deploy one promtail agent per host.
The promtail agent uses a YAML configuration to define how to discover log files. It supports a wide variety of sources, including syslog, static paths, Kafka, Gelf, and many more.
Our sample deployment contains the following snippet:
scrape_configs:
  - job_name: flog_scrape
    docker_sd_configs:
      - host: unix:///var/run/docker.sock
        refresh_interval: 5s
    relabel_configs:
      - source_labels: ['__meta_docker_container_name']
        regex: '/(.*)'
        target_label: 'container'
This ingests logs from all active Docker containers by querying the Docker daemon. Notably, it’s possible to define multiple jobs for a single promtail agent.
As each log message is ingested, various labels are added. In the example above, the Docker container name is added as a label. Later we’ll see how to utilize labels to query log messages.
Different scrape jobs allow for defining different labels. For example, if we use the Kubernetes service discovery template, we can add labels for nodes, pods, and other Kubernetes-specific details.
3.3. Viewing Data
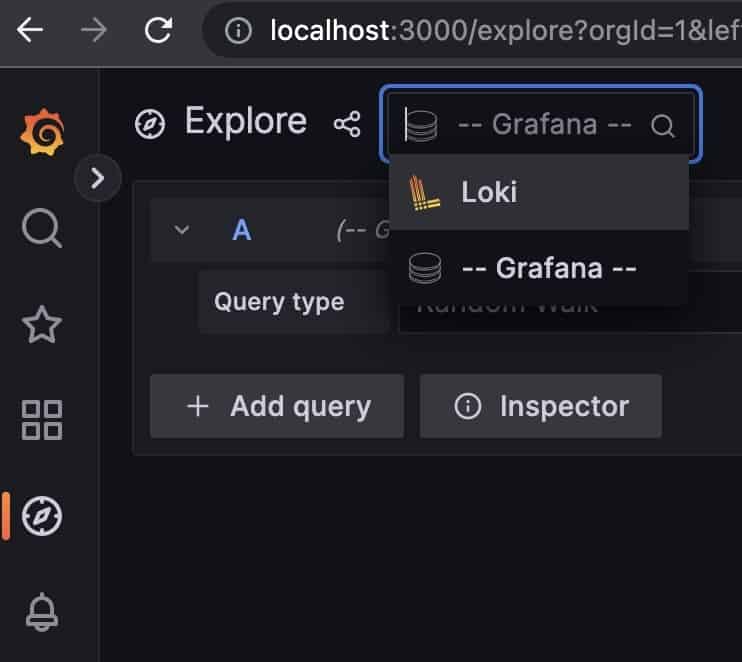
To view log data, we use the Grafana dashboard. In our sample deployment, this is available at the URL http://localhost:3000. From there, we select Explore and then select Loki from the datasource drop-down:
From there, the easiest way to start browsing log messages is to filter on labels. Our sample deployment creates one label named container that we can use to view log messages from specific applications:
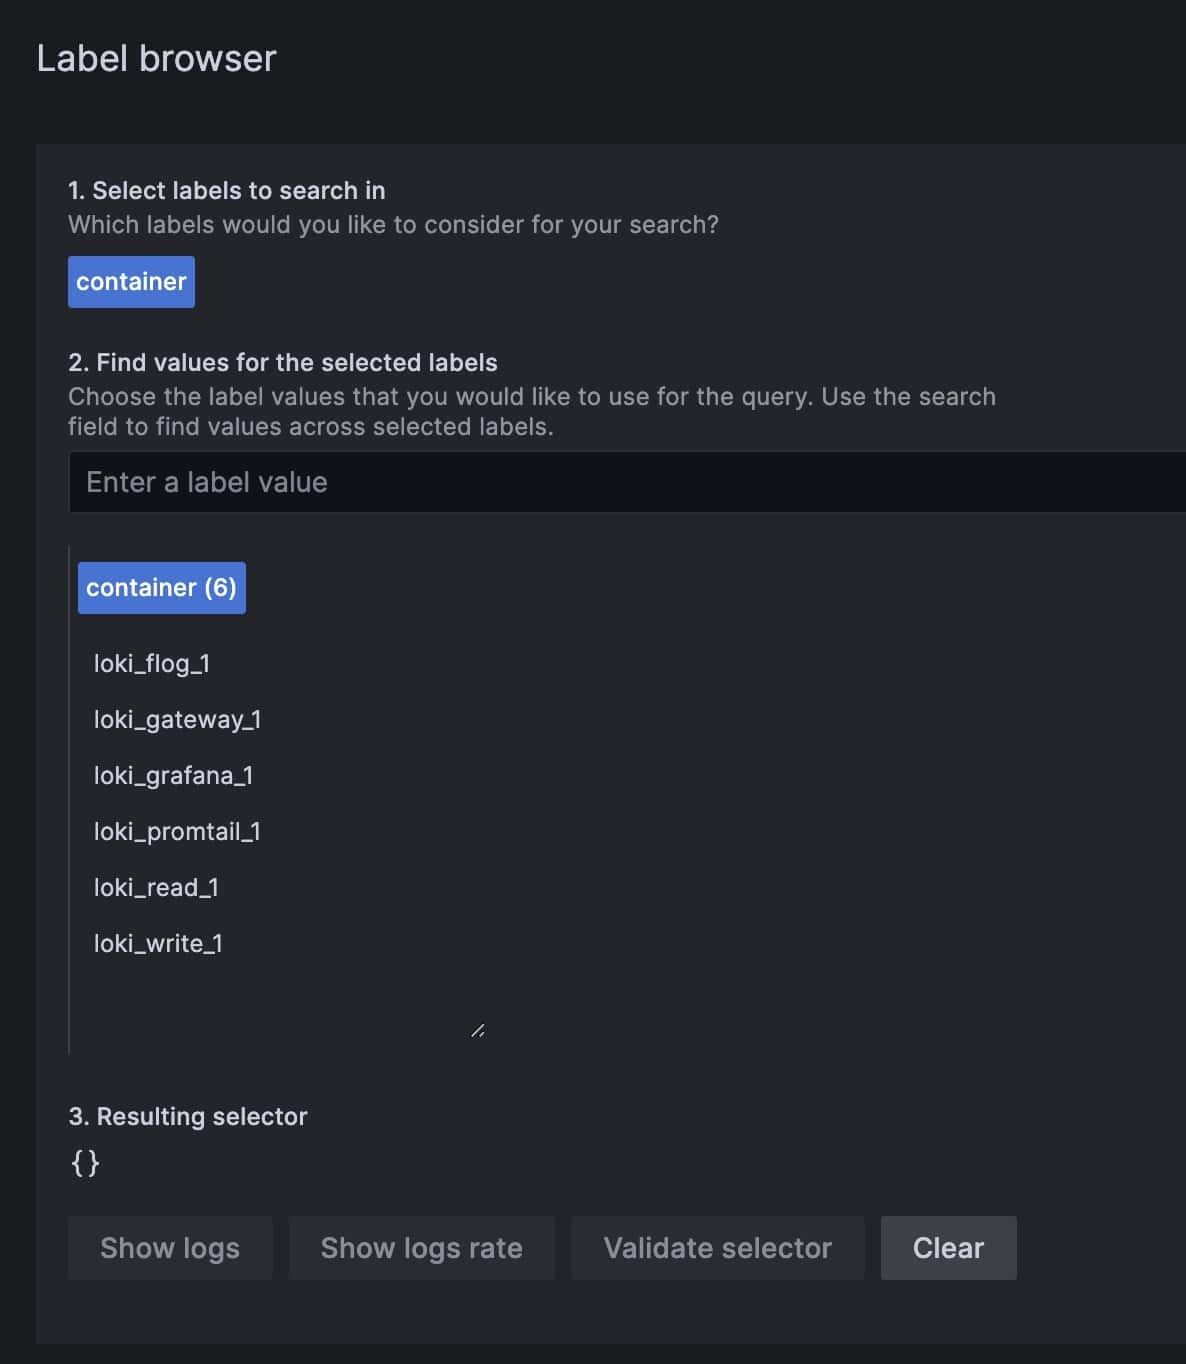
We can notice that we have a container name for each of our deployed applications. We can select one or more and click Show logs to view the log messages from those containers:
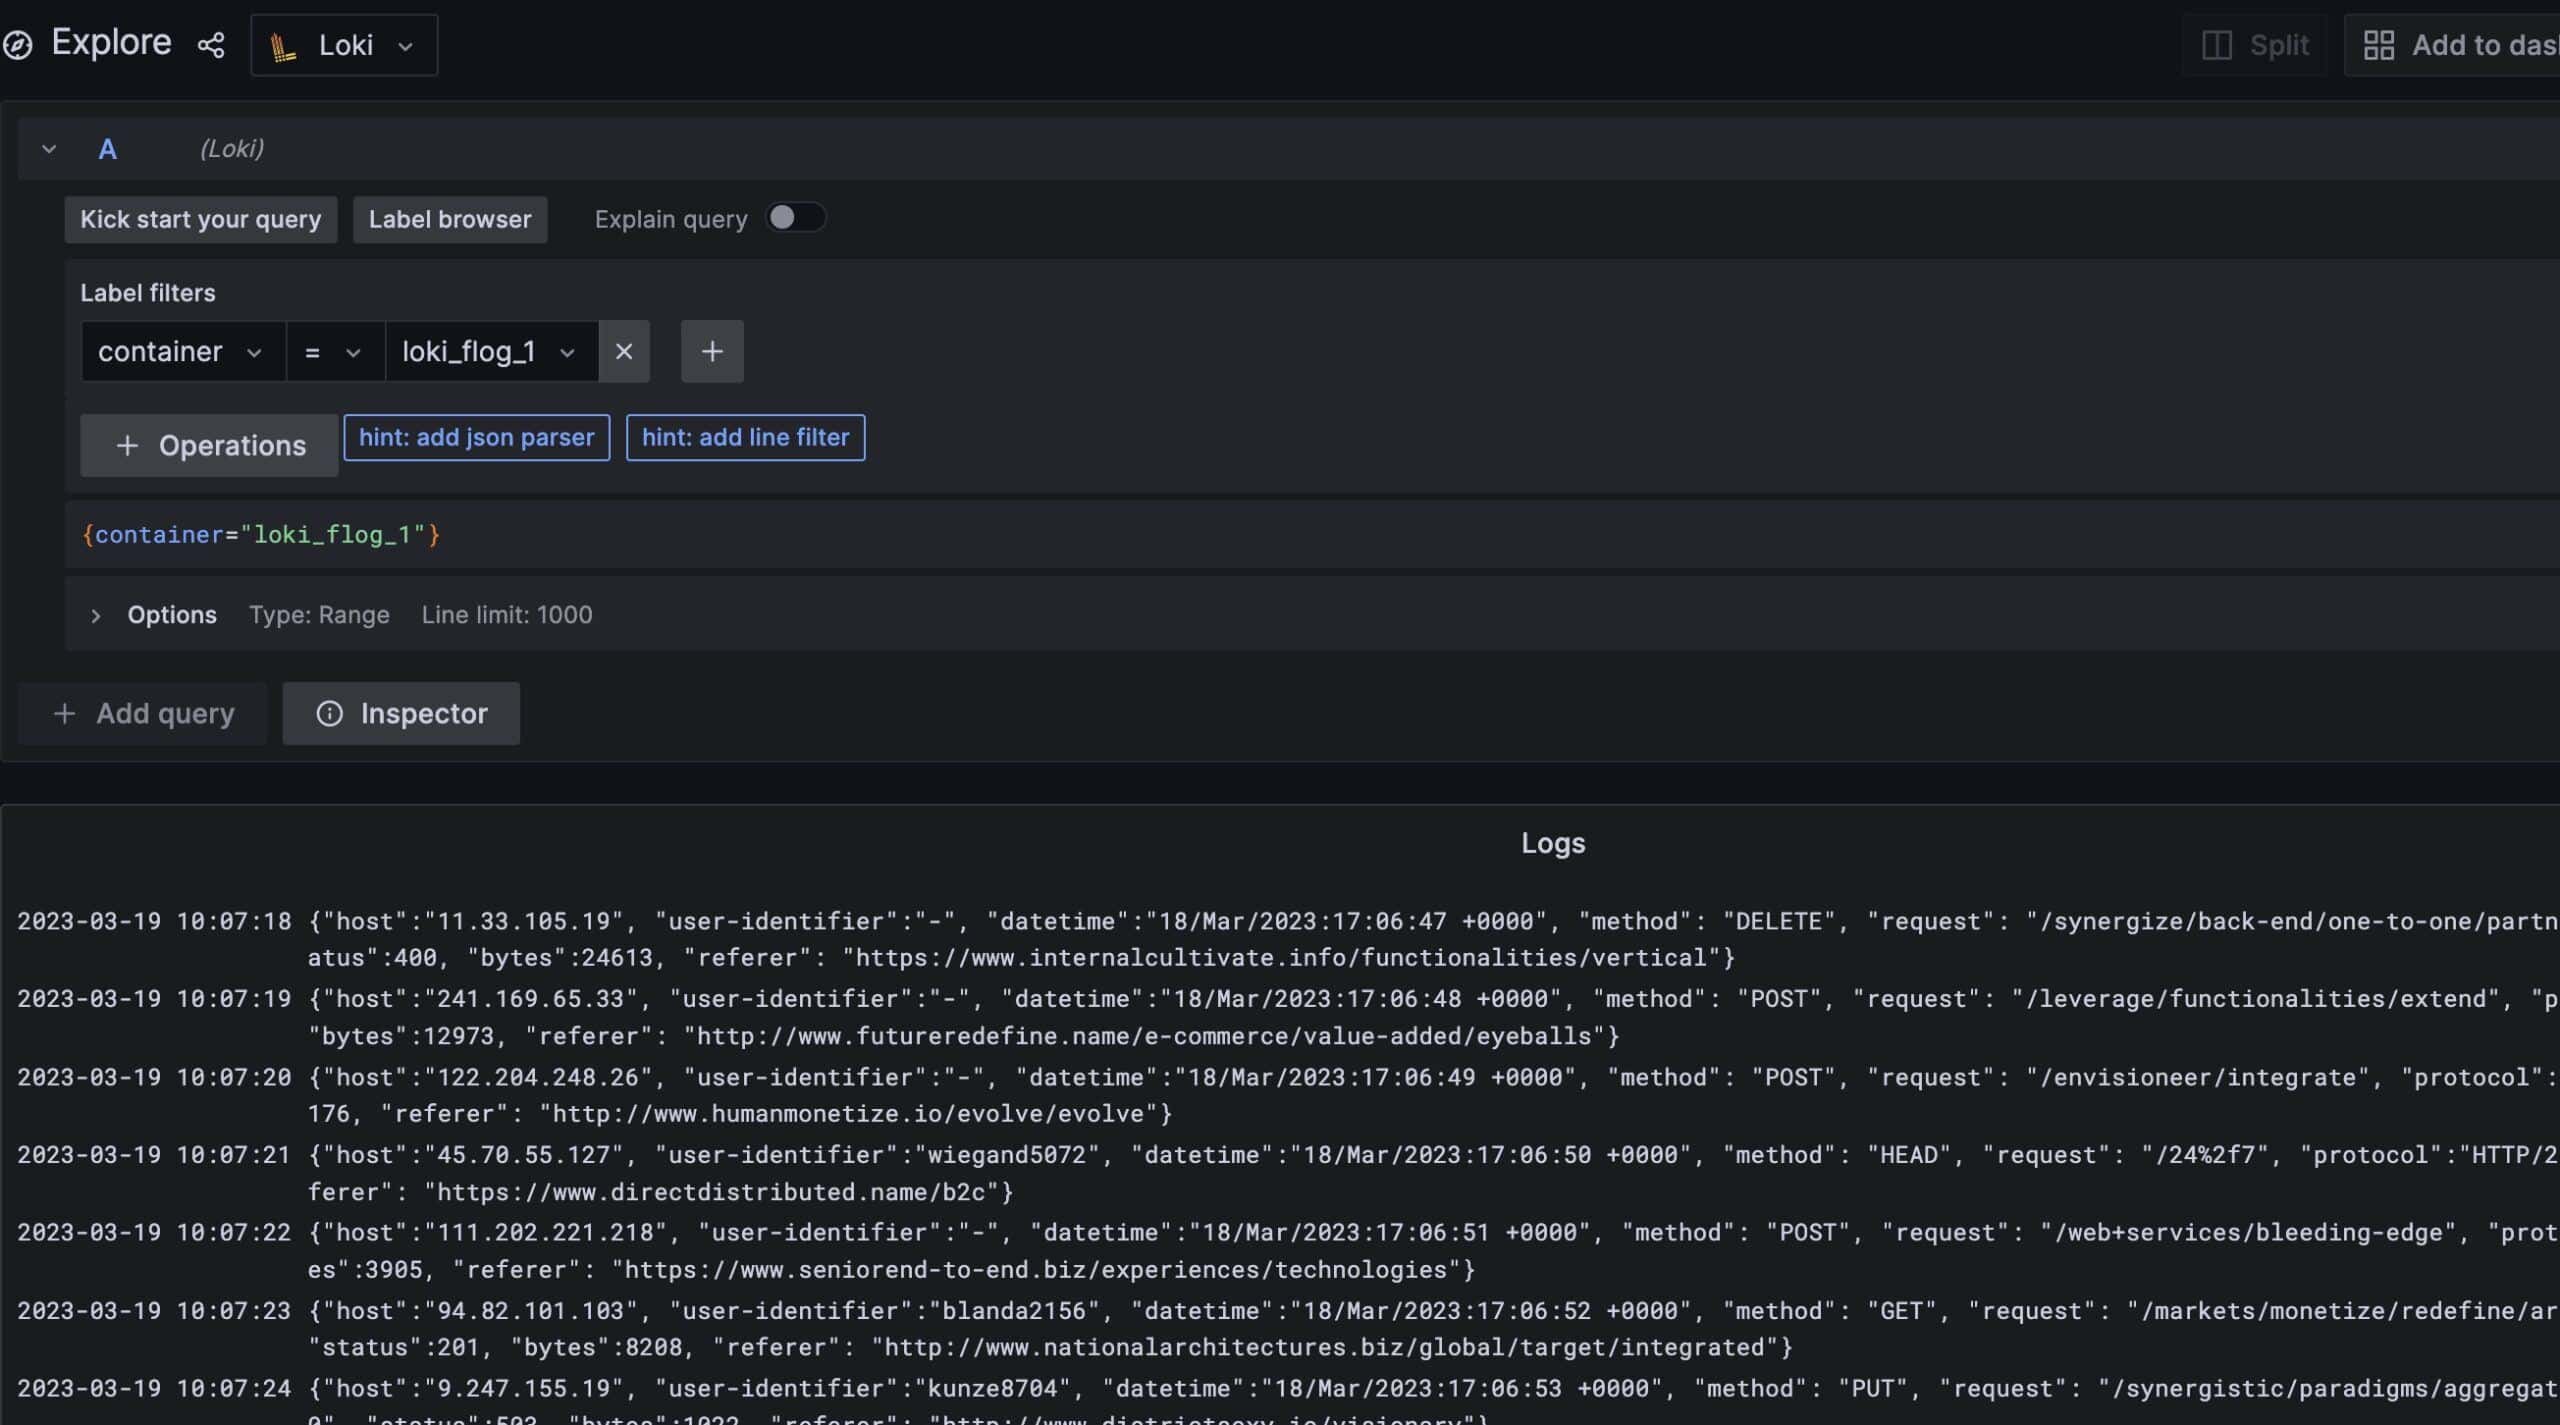
Behind the scenes, viewing messages relies on standard Grafana queries. The above is equivalent to the following Grafana query:
{container="loki_flog_1"}4. Searching Messages
As mentioned earlier, Loki doesn’t index full message content. While this does allow it to ingest large numbers of messages quickly with minimal storage, it also means querying the log messages isn’t straightforward.
Luckily, at its core, Grafana is a visualization and query engine. As such, it has several built-in mechanisms that we can use to search logs.
4.1. JSON Filter
For log messages that are already in a JSON format, we can use the json filter to parse out fields and then query on them.
For example, our sample flog application generates JSON messages for fake HTTP requests. Let’s find messages for all POST requests:
{container="loki_flog_1"} | json http_method="method" | http_method = `POST`This query grabs all log messages from the flog container, parses the method field into a new label, and then shows only messages where the method is POST.
4.2. Line Filters
For messages that aren’t in JSON format, we can use a line filter to find the same messages as above:
{container="loki_flog_1"} |= `"method": "POST"`This approach is an exact query. This means all characters, including white space, have to match exactly.
4.3. Regular Expressions
Finally, we can use a regular expression to filter log messages. This works by parsing specific parts of a log message into new labels, then filtering on those labels:
{container="loki_flog_1"} | regexp `"method": "(?P<http_method>.*)", "request"` | http_method = `POST`In this case, the regular expressions are based on the Go language and require at least one named group.
5. Conclusion
In this article, we looked at Loki, a log aggregation system that’s part of the Grafana observability stack. It’s capable of ingesting millions of log messages from different sources.
It behaves differently from other log aggregation systems by not indexing entire log messages. Instead, it uses metadata to attach labels to each message. Then, using the existing search capabilities of Grafana, we can search and filter log messages for specific data.