

Mocking is an essential part of unit testing, and the Mockito library makes it easy to write clean and intuitive unit tests for your Java code.
Get started with mocking and improve your application tests using our Mockito guide:
Handling concurrency in an application can be a tricky process with many potential pitfalls. A solid grasp of the fundamentals will go a long way to help minimize these issues.
Get started with understanding multi-threaded applications with our Java Concurrency guide:
Spring 5 added support for reactive programming with the Spring WebFlux module, which has been improved upon ever since. Get started with the Reactor project basics and reactive programming in Spring Boot:
Since its introduction in Java 8, the Stream API has become a staple of Java development. The basic operations like iterating, filtering, mapping sequences of elements are deceptively simple to use.
But these can also be overused and fall into some common pitfalls.
To get a better understanding on how Streams work and how to combine them with other language features, check out our guide to Java Streams:
Explore Spring Boot 3 and Spring 6 in-depth through building a full REST API with the framework:
Yes, Spring Security can be complex, from the more advanced functionality within the Core to the deep OAuth support in the framework.
I built the security material as two full courses - Core and OAuth, to get practical with these more complex scenarios. We explore when and how to use each feature and code through it on the backing project.
You can explore the course here:
Spring Data JPA is a great way to handle the complexity of JPA with the powerful simplicity of Spring Boot.
Get started with Spring Data JPA through the guided reference course:
Refactor Java code safely — and automatically — with OpenRewrite.
Refactoring big codebases by hand is slow, risky, and easy to put off. That’s where OpenRewrite comes in. The open-source framework for large-scale, automated code transformations helps teams modernize safely and consistently.
Each month, the creators and maintainers of OpenRewrite at Moderne run live, hands-on training sessions — one for newcomers and one for experienced users. You’ll see how recipes work, how to apply them across projects, and how to modernize code with confidence.
Join the next session, bring your questions, and learn how to automate the kind of work that usually eats your sprint time.
1. Overview
In this tutorial, we’ll learn how to configure observability with Spring Boot 3. Observability is the ability to measure the internal state of a system only by its external outputs (logs, metrics, and traces). We can learn about the basics in “Observability in Distributed Systems.”
Furthermore, we must be aware that there are significant changes between Spring Boot 2 (Spring 5) and Spring Boot 3 (Spring 6). Spring 6 introduces Spring Observability, a new initiative that builds on Micrometer and Micrometer Tracing (formerly Spring Cloud Sleuth). It’s more for efficiently recording application metrics with Micrometer and implementing tracing through providers, such as OpenZipkin’s Brave or OpenTelemetry. Spring Observability scores over agent-based observability solutions, as it works seamlessly in natively compiled Spring applications, and more effectively provides better information.
Here, we’ll only capture the details concerning Spring Boot 3. If we want to migrate from Spring Boot 2, we can find detailed instructions here.
2. Micrometer Observation API
Micrometer is a project that provides a vendor-neutral application metrics facade. It defines concepts like meters, rate aggregation, counters, gauges, and timers that each vendor can adapt to their own concepts and tooling. One core part is the Observation API, which allows instrumenting the code once, and has multiple benefits.
It’s included as a dependency of several parts of the Spring Framework, so we need to know this API in order to understand how observation works in Spring Boot. We can do this with a simple example.
2.1. Observation and ObservationRegistry
From dictionary.com, an observation is “an act or instance of viewing or noting a fact or occurrence for some scientific or another special purpose.” In our code, we can observe single operations or complete HTTP request handling. Within these observations, we can take measurements, create spans for distributed tracing, or just log out additional information.
To create an observation, we need an ObservationRegistry:
ObservationRegistry observationRegistry = ObservationRegistry.create();
Observation observation = Observation.createNotStarted("sample", observationRegistry);
Observations have a lifecycle that’s as simple as this diagram shows:
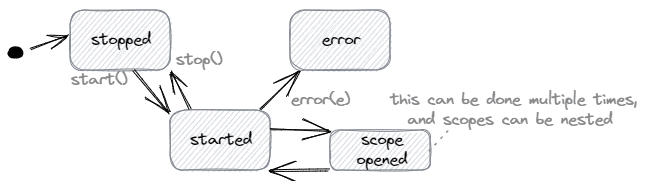
We can use the Observation type like this:
observation.start();
try (Observation.Scope scope = observation.openScope()) {
    // ... the observed action
} catch (Exception e) {
    observation.error(e);
    // further exception handling
} finally {
    observation.stop();
}
Or simply:
observation.observe(() -> {
    // ... the observed action
});
2.2. ObservationHandler
The data-collecting code is implemented as an ObservationHandler. This handler gets notified about the Observation‘s lifecycle events, and therefore provides callback methods. A simple handler that just prints out the events can be implemented this way:
public class SimpleLoggingHandler implements ObservationHandler<Observation.Context> {

    private static final Logger log = LoggerFactory.getLogger(SimpleLoggingHandler.class);

    @Override
    public boolean supportsContext(Observation.Context context) {
        return true;
    }

    @Override
    public void onStart(Observation.Context context) {
        log.info("Starting");
    }

    @Override
    public void onScopeOpened(Observation.Context context) {
        log.info("Scope opened");
    }

    @Override
    public void onScopeClosed(Observation.Context context) {
        log.info("Scope closed");
    }

    @Override
    public void onStop(Observation.Context context) {
        log.info("Stopping");
    }

    @Override
    public void onError(Observation.Context context) {
        log.info("Error");
    }
}
We then register the ObservationHandler at the ObservationRegistry before creating the Observation:
observationRegistry
  .observationConfig()
  .observationHandler(new SimpleLoggingHandler());
For simple logging, an implementation already exists. For instance, to simply log events to the console, we can use:
observationRegistry
  .observationConfig()
  .observationHandler(new ObservationTextPublisher(System.out::println));
To use timer samples and counters, we can configure this:
MeterRegistry meterRegistry = new SimpleMeterRegistry();
observationRegistry
  .observationConfig()
  .observationHandler(new DefaultMeterObservationHandler(meterRegistry));

// ... observe using Observation with name "sample"

// fetch maximum duration of the named observation
Optional<Double> maximumDuration = meterRegistry.getMeters().stream()
  .filter(m -> "sample".equals(m.getId().getName()))
  .flatMap(m -> StreamSupport.stream(m.measure().spliterator(), false))
  .filter(ms -> ms.getStatistic() == Statistic.MAX)
  .findFirst()
  .map(Measurement::getValue);
3. Spring Integration
3.1. Actuator
We get the best integration in a Spring Boot app with the Actuator dependency:
<dependency>
    <groupId>org.springframework.boot</groupId>
    <artifactId>spring-boot-starter-actuator</artifactId>
</dependency>
It contains an ObservationAutoConfiguration that provides an injectable instance of ObservationRegistry (if it doesn’t already exist), and configures ObservationHandlers for collecting metrics and traces.
For example, we can use the registry to create a custom observation within a service:
@Service
public class GreetingService {

    private ObservationRegistry observationRegistry;

    // constructor

    public String sayHello() {
        return Observation
          .createNotStarted("greetingService", observationRegistry)
          .observe(this::sayHelloNoObserver);
    }

    private String sayHelloNoObserver() {
        return "Hello World!";
    }
}
Furthermore, it registers ObservationHandler beans at the ObservationRegistry. We only need to provide the beans:
@Configuration
public class ObservationTextPublisherConfiguration {

    private static final Logger log = LoggerFactory.getLogger(ObservationTextPublisherConfiguration.class);

    @Bean
    public ObservationHandler<Observation.Context> observationTextPublisher() {
        return new ObservationTextPublisher(log::info);
    }
}
3.2. Web
For MVC there is a filter (org.springframework.web.filter.ServerHttpObservationFilter) that we can use for HTTP server observations. When Actuator is part of our application, this filter is already registered and active. If not, we need to configure it:
@Configuration
public class ObservationFilterConfiguration {

    // if an ObservationRegistry is configured
    @ConditionalOnBean(ObservationRegistry.class)
    // if we do not use Actuator
    @ConditionalOnMissingBean(ServerHttpObservationFilter.class)
    @Bean
    public ServerHttpObservationFilter observationFilter(ObservationRegistry registry) {
        return new ServerHttpObservationFilter(registry);
    }
}
For WebFlux, there is such a filter too (org.springframework.web.filter.reactive.ServerHttpObservationFilter), but this has been deprecated since Spring Framework version 6.1 (Spring Boot 3.2). Instead, a WebHttpHandlerBuilder is created. With Actuator, this is auto-configured too.
3.3. AOP
The Micrometer Observation API also declares an @Observed annotation with an aspect implementation based on AspectJ. To get this to work, we need to add the AOP dependency to our project:
<dependency>
    <groupId>org.springframework.boot</groupId>
    <artifactId>spring-boot-starter-aop</artifactId>
</dependency>
Then we’ll register the aspect implementation as a Spring-managed bean:
@Configuration
public class ObservedAspectConfiguration {

    @Bean
    public ObservedAspect observedAspect(ObservationRegistry observationRegistry) {
        return new ObservedAspect(observationRegistry);
    }
}
Now, instead of creating an Observation in our code, we can write the GreetingService shortly:
@Observed(name = "greetingService")
@Service
public class GreetingService {

    public String sayHello() {
        return "Hello World!";
    }
}
In combination with Actuator, we can read out the pre-configured metrics (after we’ve invoked the service at least once) using http://localhost:8080/actuator/metrics/greetingService and we’ll get a result like this:
{
    "name": "greetingService",
    "baseUnit": "seconds",
    "measurements": [
        {
            "statistic": "COUNT",
            "value": 15
        },
        {
            "statistic": "TOTAL_TIME",
            "value": 0.0237577
        },
        {
            "statistic": "MAX",
            "value": 0.0035475
        }
    ],
    ...
}
4. Testing Observations
Micrometer Observability API provides a module that allows us to write tests. To do so, we need to add this dependency:
<dependency>
    <groupId>io.micrometer</groupId>
    <artifactId>micrometer-observation-test</artifactId>
    <scope>test</scope>
</dependency>
The micrometer-bom is part of the managed dependencies of Spring Boot, so we don’t need to specify any version.
Because the whole observability auto-configuration is disabled for tests by default, we need to re-enable it using @AutoConfigureObservability whenever we want to test the default observations.
4.1. TestObservationRegistry
We can use a TestObservationRegistry that allows AssertJ-based assertions. As such, we have to replace the ObservationRegistry, which is already in the context, with the TestObservationRegistry instance.
So, for example, if we want to test the observation of the GreetingService, we can use this test setup:
@ExtendWith(SpringExtension.class)
@ComponentScan(basePackageClasses = GreetingService.class)
@EnableAutoConfiguration
@Import(ObservedAspectConfiguration.class)
@AutoConfigureObservability
class GreetingServiceObservationIntegrationTest {

    @Autowired
    GreetingService service;
    @Autowired
    TestObservationRegistry registry;

    @TestConfiguration
    static class ObservationTestConfiguration {

        @Bean
        TestObservationRegistry observationRegistry() {
            return TestObservationRegistry.create();
        }
    }

    // ...
}
We can also configure this using JUnit Meta Annotations:
@Documented
@Inherited
@Retention(RetentionPolicy.RUNTIME)
@Target(ElementType.TYPE)
@Import({
  ObservedAspectConfiguration.class,
  EnableTestObservation.ObservationTestConfiguration.class
})
@AutoConfigureObservability
public @interface EnableTestObservation {

    @TestConfiguration
    class ObservationTestConfiguration {

        @Bean
        TestObservationRegistry observationRegistry() {
            return TestObservationRegistry.create();
        }
    }
}
Next, we need to add the annotation to our test class:
@ExtendWith(SpringExtension.class)
@ComponentScan(basePackageClasses = GreetingService.class)
@EnableAutoConfiguration
@EnableTestObservation
class GreetingServiceObservationIntegrationTest {

    @Autowired
    GreetingService service;
    @Autowired
    TestObservationRegistry registry;

    // ...
}
Then we can invoke the service, and check that the observation was done:
import static io.micrometer.observation.tck.TestObservationRegistryAssert.assertThat;

// ...

@Test
void testObservation() {
    // invoke service
    service.sayHello();
    assertThat(registry)
      .hasObservationWithNameEqualTo("greetingService")
      .that()
      .hasBeenStarted()
      .hasBeenStopped();
}
4.2. Observation Handler Compatibility Kits
To test our ObservationHandler implementations, there are a couple of base classes (so-called Compatibility Kits) that we can inherit from in our tests:
- NullContextObservationHandlerCompatibilityKit tests that the observation handler works correctly in case of null value parameters.
- AnyContextObservationHandlerCompatibilityKit tests that the observation handler works correctly in case of an unspecified test context parameter. This also includes the NullContextObservationHandlerCompatibilityKit.
- ConcreteContextObservationHandlerCompatibilityKit tests that the observation handler works correctly in case of a context kind of test context.
The implementation is simple:
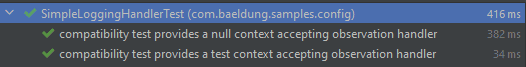
public class SimpleLoggingHandlerUnitTest
  extends AnyContextObservationHandlerCompatibilityKit {

    SimpleLoggingHandler handler = new SimpleLoggingHandler();

    @Override
    public ObservationHandler<Observation.Context> handler() {
        return handler;
    }
}
This will lead to the following output:
5. Micrometer Tracing
The former Spring Cloud Sleuth project has moved to Micrometer, the core to Micrometer Tracing since Spring Boot 3. We can find the definition of Micrometer Tracing in the documentation:
Micrometer Tracing provides a simple facade for the most popular tracer libraries, letting you instrument your JVM-based application code without vendor lock-in. It is designed to add little to no overhead to your tracing collection activity while maximizing the portability of your tracing effort.
We can use it standalone, but it also integrates with the Observation API by providing ObservationHandler extensions.
5.1. Integration Into Observation API
To use Micrometer Tracing, we need to add the following dependency to our project. The version is managed by Spring Boot:
<dependency>
    <groupId>io.micrometer</groupId>
    <artifactId>micrometer-tracing</artifactId>
</dependency>
Next, we need one of the supported tracers (currently OpenZipkin Brave or OpenTelemetry). We then have to add a dependency for the vendor-specific integration into Micrometer Tracing:
<dependency>
    <groupId>io.micrometer</groupId>
    <artifactId>micrometer-tracing-bridge-brave</artifactId>
</dependency>
or
<dependency>
    <groupId>io.micrometer</groupId>
    <artifactId>micrometer-tracing-bridge-otel</artifactId>
</dependency>
Spring Actuator has auto-configuration for both tracers, i.e., it registers the vendor-specific objects and the Micrometer Tracing ObservationHandler implementations, delegating these objects into the application context. So there’s no need for further configuration steps.
5.2. Test Support
For testing purposes, we need to add the following dependency to our project. The version is managed by Spring Boot:
<dependency>
    <groupId>io.micrometer</groupId>
    <artifactId>micrometer-tracing-test</artifactId>
    <scope>test</scope>
</dependency>
Then we can use the SimpleTracer class to collect and verify tracing data during tests. To get it to work, we’ll replace the original, vendor-specific Tracer with the SimpleTracer in the application context. And we also have to remember to enable the auto-configuration for tracing by using @AutoConfigureObservability.
So the minimal test configuration for tracing could look like this:
@ExtendWith(SpringExtension.class)
@EnableAutoConfiguration
@AutoConfigureObservability
public class GreetingServiceTracingIntegrationTest {

    @TestConfiguration
    static class ObservationTestConfiguration {
        @Bean
        TestObservationRegistry observationRegistry() {
            return TestObservationRegistry.create();
        }
        @Bean
        SimpleTracer simpleTracer() {
            return new SimpleTracer();
        }
    }

    @Test
    void shouldTrace() {
        // test
    }
}
Or, if we use the JUnit meta-annotation:
@Documented
@Inherited
@Retention(RetentionPolicy.RUNTIME)
@Target(ElementType.TYPE)
@AutoConfigureObservability
@Import({
  ObservedAspectConfiguration.class,
  EnableTestObservation.ObservationTestConfiguration.class
})
public @interface EnableTestObservation {

    @TestConfiguration
    class ObservationTestConfiguration {

        @Bean
        TestObservationRegistry observationRegistry() {
            return TestObservationRegistry.create();
        }

        @Bean
        SimpleTracer simpleTracer() {
            return new SimpleTracer();
        }
    }
}
We can then test our GreetingService by the following sample test:
import static io.micrometer.tracing.test.simple.TracerAssert.assertThat;

// ...

@Autowired
GreetingService service;
@Autowired
SimpleTracer tracer;

// ...

@Test
void testTracingForGreeting() {
    service.sayHello();
    assertThat(tracer)
      .onlySpan()
      .hasNameEqualTo("greeting-service#say-hello")
      .isEnded();
}
6. Conclusion
In this article, we explored the Micrometer Observation API and the integration into Spring Boot 3. We learned that Micrometer is an API for vendor-independent instrumentation, and that Micrometer Tracing is an extension. We also determined that Actuator has a set of pre-configured observations and tracings, and that observability auto-configuration is disabled for tests by default.


