

Learn through the super-clean Baeldung Pro experience:
>> Membership and Baeldung Pro.
No ads, dark-mode and 6 months free of IntelliJ Idea Ultimate to start with.
Learn through the super-clean Baeldung Pro experience:
>> Membership and Baeldung Pro.
No ads, dark-mode and 6 months free of IntelliJ Idea Ultimate to start with.
The Vim editor is a popular command-line editor in the Linux world, known for its command-oriented user interface.
In this tutorial, we’ll explore how to debug our code using Vim and the GNU Debugger. For this purpose, we’ll use the Termdebug plugin. First, we’ll create a very simple C project with Vim and debug it with Termdebug.
Our project consists of 3 source files and will calculate Fibonacci numbers. The user enters a sequence number and the program prints the corresponding Fibonacci value.
We start by creating the header file fibonacci.h:
int fibonacci(int n);Here we declare the function that calculates the value of a Fibonacci number. Next, we create the fibonacci() function in the file fibonaccihelper.c:
#include "fibonacci.h"
#include <stdio.h>
int fibonacci(int n) {
    if(n <= 1) return n;
    return fibonacci(n-1) + fibonacci(n-2);
}
Finally, we create our main() function in fibonacci.c:
#include "fibonacci.h"
#include <stdio.h>
#include <stdlib.h>
int main(int argc, char* argv[]) {
    printf("F%d: %d", atoi(argv[1]), fibonacci(atoi(argv[1])));
}
The program accepts one argument: the number whose Fibonacci sequence we want to calculate.
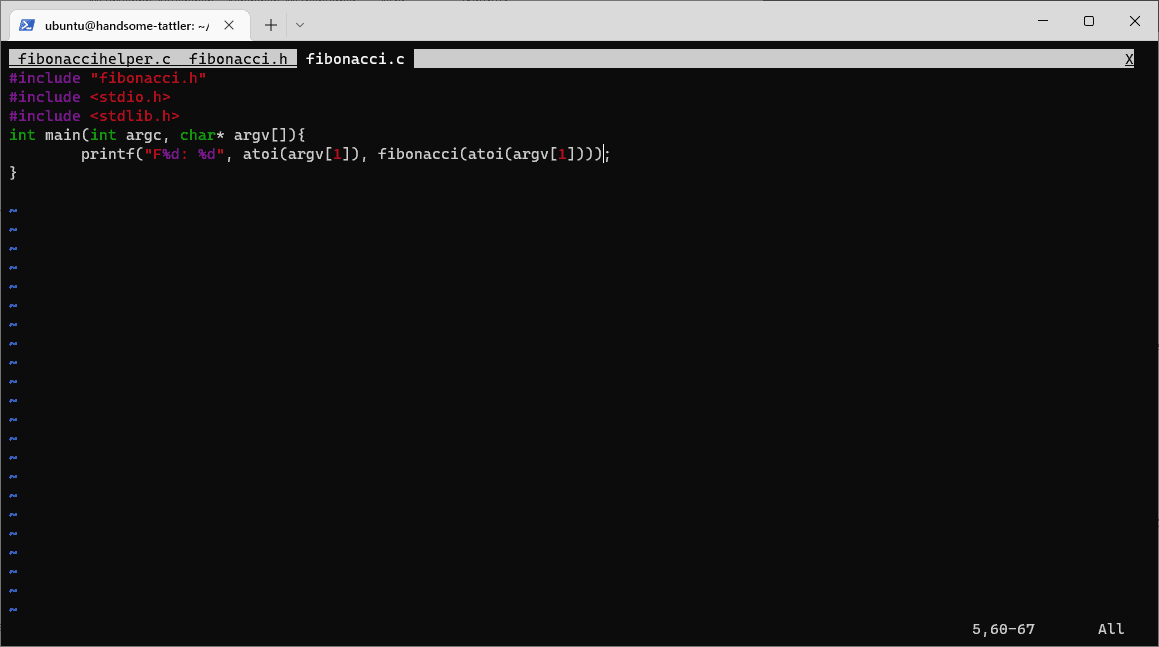
A nice feature of the Vim editor is tabs. We can edit a file in a separate tab by entering the Vim command tabedit:
:tabedit fibonacci.cEffectively, the Vim editor opens fibonacci.c, if it exists, in a separate tab inside Vim. If we haven’t created the file yet, Vim opens an empty tab where we can enter our code and then save it under the name fibonacci.c. So, we create and save our three source files in separate tabs:
We should note that we can change tabs via the :nextn and :nextp Vim commands, or we can enable tab transition with the mouse by typing :set mouse=a.
We compile our program with the gcc command using the -g option, to produce debugging information for the GNU debugger. We can compile our program without exiting the Vim editor by typing:
:! gcc -g fibonacci.c fibonaccihelper.c fibonacci.h -o fibonacciAs a result, we compiled our three source files and produced a single executable with the name fibonacci.
The Termdebug plugin handles the integration of gdb with the Vim editor. This plugin is available since version 8.1 of Vim and it’s part of its terminal window feature.
Indeed, on the latest Ubuntu systems, the Termdebug plugin comes pre-installed with the Vim editor, even though it’s not loaded when we open the editor. So, our first step is to load the plugin with the packadd command:
:packadd termdebugThen, we start the plugin by simply typing its name:
:TermdebugThe capital T is important since the command is case-sensitive. Effectively, the Termdebug plugin opens in the active tab and splits it into three vertical views:
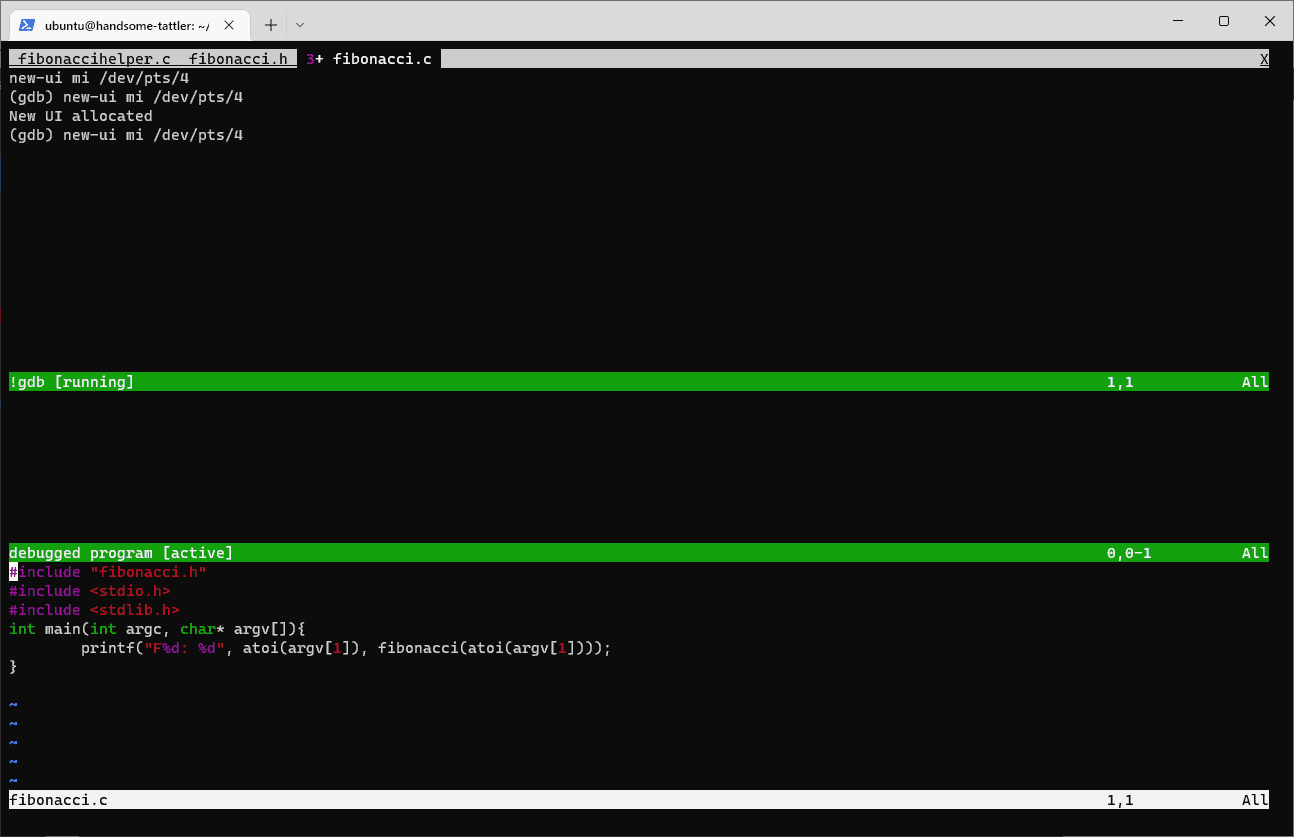
The first view is where the gdb command is executed. Here, we can type debug commands so that we can start the debugging process, set breakpoints, move to the next line, and more. Our source code is displayed in the third view.
We can navigate the cursor between the three views via Ctrl+w and w. Moreover, we can exit the Termdebug plugin by navigating to the debug view and typing quit or just q.
The Vim editor and the Termdebug plugin allow us to rearrange the placement of the three views we discussed. For example, if we prefer to have the source code on the right side, we navigate to the source code view and type Ctrl+w and L.
Another handy feature is the line numbers in our source code. They are useful when setting breakpoints. To make line numbers appear, we navigate to the source code view and type the command :set numbers.
In case we use the terminal from a Linux machine with a graphical interface, we have the option to enable the mouse by entering the command :set mouse=a, as we already noted earlier. This way we’ll be able to use the mouse to navigate between debugging views and control the debug process with buttons that appear in the source code view.
Let’s apply these changes to customize the layout to our preferences:
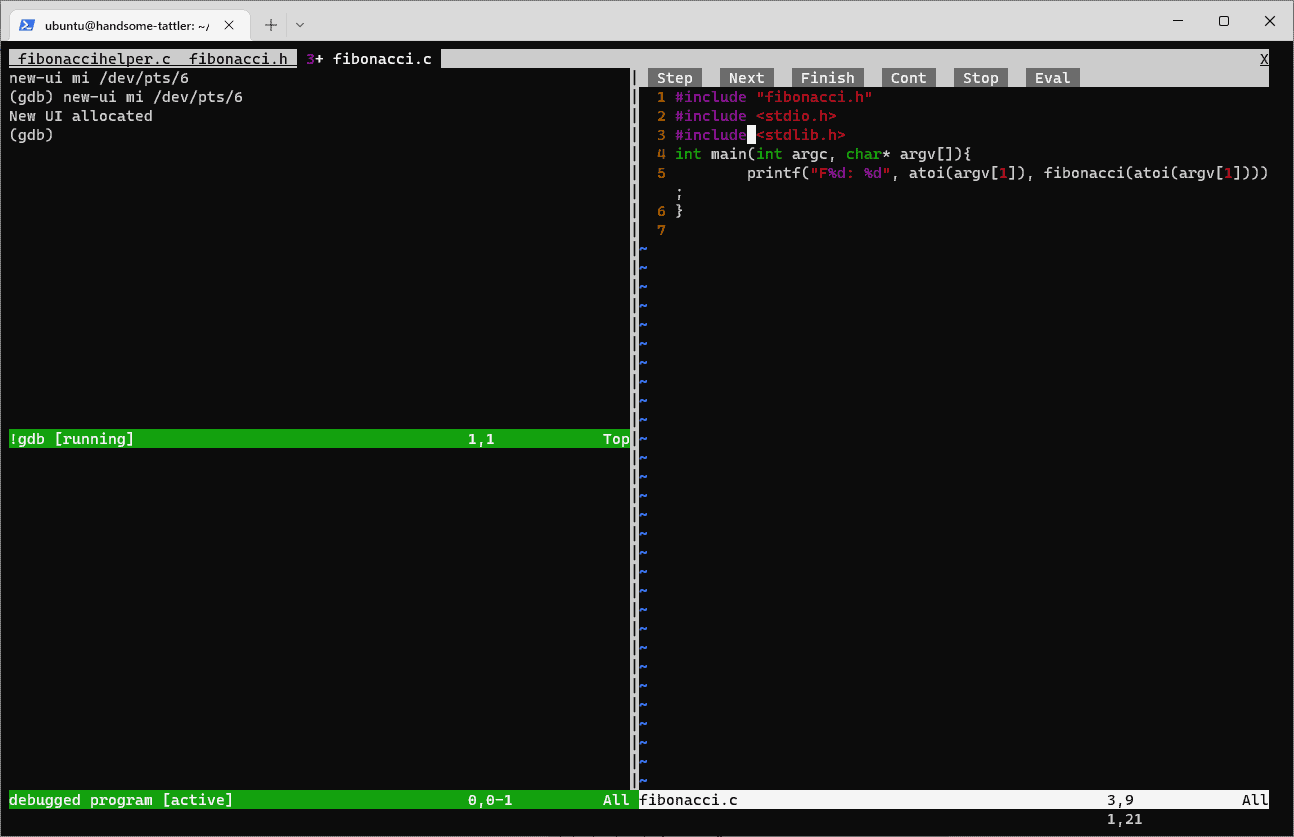
We may need to close and reopen the plugin, to see the Step, Next, and Finish buttons. Moreover, we can store our preferences in our .vimrc file so that we don’t have to re-enter them every time we open the Vim editor.
So, we’ve set up our environment successfully and did some layout customizations for our convenience. Now, we are ready to start debugging our program.
Before starting the debug process, we first have to load our executable in the debugger’s command line:
(gdb) file fibonacci
Reading symbols from fibonacci...
When we compiled our source code, we named our executable file fibonacci. So, with the command file fibonacci, the debugger loads our executable.
The next step is to set breakpoints. We set breakpoints with the break command followed by a line number:
(gdb) break 5
Breakpoint 1 at 0x117d: file fibonacci.c, line 5.
As we can see, we’ve set a breakpoint on line 5 of the main() function. When we set a breakpoint, the Termdebug plugin places a special mark on the corresponding line.
Everything’s in place to execute the program. We start it with the debugger’s run command:
(gdb) run 5
Starting program: /home/ubuntu/vimgdb/fibonacci 5
Breakpoint 1, main (argc=2, argv=0x7ffffffe458) at fibonacci.c:5
5                  printf("F%d: %d", atoi(argv[1]), fibonacci(atoi(argv[1])));
Our program accepts one argument: the Fibonacci number we want to calculate. Here we want to calculate the fifth (5) Fibonacci number. Our program has halted at the breakpoint we set, and we’re ready to examine the state of our variables:
(gdb) print argc
$1 = 2
Here, we evaluate the argc variable with the print command. The debugger correctly responds that the variable holds the value 2.
The step command, or s, moves the debugger to the next line. We use the same command to step into a function:
(gdb) step
__GI_atoi (nptr=0x7fffffffe6f4 "5") at atoi.c:26
26      atoi.c: No such file or directory.
As can be seen, the debugger steps into the atoi function, which is not of much interest to us. So, we set a breakpoint to the fibonacci() function, in the file fibonaccihelper.c, to check the execution of that function too:
(gdb) break fibonacci
Breakpoint 5 at 0x5555555551cd: file fibonaccihelper.c, line 3.
In the above example, we set a breakpoint to the fibonacci function by explicitly entering the function name after the break command. Moreover, we can move the execution to the next breakpoint with the continue command, or just c:
(gdb) continue
Continuing.
Breakpoint 5, fibonacci (n=0) at fibonaccihelper.c:3
3       int fibonacci(int n){
Now, we can see that the program execution is blocked in the fibonacci() function, in line 3 of the fibonaccihelper.c file. The corresponding file is opened on the left of our screen, with line 3 highlighted:

Finally, we may use the kill command to exit the program. If we want to exit the plugin to edit our source code, we can enter the quit command or simply q.
In this article, we created an example C project with the Vim editor and demonstrated the Termdebug plugin for debugging our code. We showed how we can use this environment to run a program with the debugger, step to the next line or into a function, print the value of a variable, continue program execution, and exit.