

Yes, we're now running our only Summer Sale. All Courses are 30% off until 20th July, 2026:
Learn through the super-clean Baeldung Pro experience:
>> Membership and Baeldung Pro.
No ads, dark-mode and 6 months free of IntelliJ Idea Ultimate to start with.
1. Introduction
The ASCII character encoding scheme assigns standard numerical values to letters, numbers, and symbols for text representation in computers. Subsequently, it can provide interoperability and simplify programming. Because of this, it’s widely used in text-based file formats. Sometimes, due to the communication medium or for ease, we might choose ASCII characters as our means of representing art or diagrams and visual data.
In this tutorial, we’ll discuss how to draw ASCII diagrams in Linux.
First, we’ll explore command-line diagram generators like Graph-Easy, jp2a, ADia, and Groff. Lastly, we’ll discuss ASCII Draw which is a desktop-based editor.
2. Using Command-Line Methods
Command-line ASCII diagram editors in Linux provide a lightweight, terminal-compatible solution for creating text-based visual representations. Additionally, with benefits such as scripting, version control, and efficient resource usage, command-line ASCII diagram editors can be invaluable.
In this section, we’ll see some command-line tools for drawing ASCII diagrams.
2.1. Using Graph-Easy
Graph-Easy facilitates the generation of ASCII art representations of graphs and charts from textual descriptions. In addition, this tool provides a fairly quick and simple means to visualize relationships and structures in a text-based format.
Since Graph-Easy isn’t available by default on most Linux installations, we can install it using the apt command:
$ sudo apt install libgraph-easy-perlOnce, the installation is complete, we can access Graph-Easy from the terminal.
Now, let’s draw an ASCII diagram:
$ echo "[ A ] -- car --> [ B ],[ C ] -- car --> [ D ],[ E ]" | graph-easy
The above command generates an ASCII-directed graph featuring nodes A, B, C, D, and E. Notably, the arrows establish connections from A to B and C to D. Subsequently, we use the square brackets [] to represent nodes in the graph. Also, the edges are labeled with car.
Importantly, we pipe the instructions in quotation marks to the graph-easy command to generate its ASCII diagram:
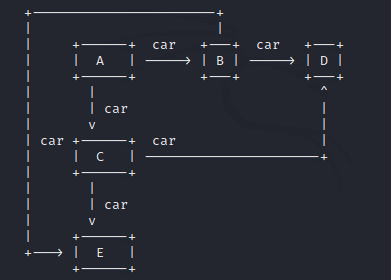
Hence, the resulting output visually illustrates these relationships in ASCII text-based format.
2.2. Using jp2a
Another approach to creating ASCII diagrams uses jp2a.
jp2a is a command-line tool used to convert JPEG images into ASCII art, representing the image with ASCII characters in a text format. Subsequently, it offers a lightweight and quick way to create visual representations of images in environments where graphical tools may be limited.
However, jp2a converts diagrams into their ASCII forms by mapping ASCII characters to different brightness levels in the image.
To use jp2a, we install it first:
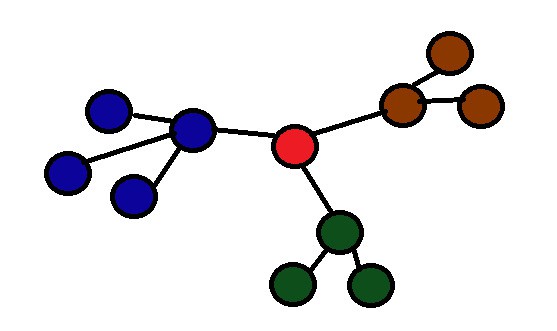
$ sudo apt-get install jp2aLet’s look at the sample image that we’re converting to an ASCII diagram:
To convert, we use the jp2a command along with the redirection operator:
$ jp2a image.jpg > output.txtNow, let’s view the output.txt file:
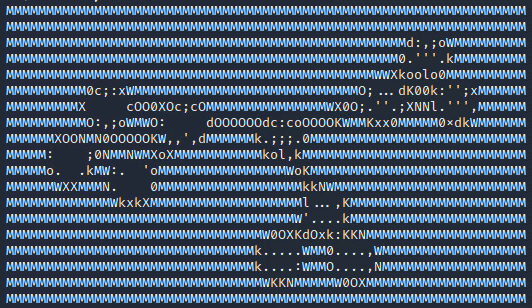
Of course, we can customize the result with different switches and options provided by the tool. To summarize, we applied jp2a to convert a diagram into an ASCII format.
2.3. Using ADia
One more approach to creating interesting ASCII visuals uses the ADia tool.
ADia is a language to create ASCII diagrams. It renders diagrams from a fairly human-readable language. Currently, it only supports sequence diagrams using ASCII characters.
To install adia, we use the pip package manager:
$ pip install adiaAfter the installation, we use the adia command with a here document to draw an ASCII sequence diagram:
$ adia << EOF
diagram: Foo
sequence:
foo -> bar: Hello
EOF
As we hit the Return key, we get the ASCII sequence diagram:
+-----+      +-----+
| foo |      | bar |
+-----+      +-----+
   |            |
   |~~~Hello~~~>|
   |            |
   |<-----------|
   |            |
+-----+      +-----+
| foo |      | bar |
+-----+      +-----+
In the above code, we passed the contents of our code to adia via a here document. Now, let’s examine the instructions we included:
- diagram: Foo specifies the name of the diagram as Foo
- sequence: indicates the start of the sequence diagram
- foo -> bar: Hello represents a message flow from the participant foo to the participant bar with the message content Hello
Everything between << EOF and the matching EOF is treated as input for the adia command.
2.4. Using Groff
Groff, short for GNU roff, is a typesetting system and text formatting tool, part of the GNU Project. Linux users leverage it to process plain text input and produce formatted output for various devices, such as printers or screens. In addition, it’s available on many Linux distributions by default.
Of course, we can use Groff to create simple ASCII diagrams. In particular, to create an ASCII diagram, we create and populate a .roff file:
$ cat diagram.roff
.\" Simple ASCII Diagram using Groff
.PS
box "foo" "Hello" -> "bar"
.PE
In the above file, the first line is a comment in the Groff language. After that, we use .PS and .PE to indicate the beginning and end of a drawing region in Groff. Anything between these two commands will be treated as drawing commands.
Next, we use the actual drawing command box “foo” “Hello” -> “bar”:
- box is a command to draw a box
- “foo” and “bar” are labels for the boxes
- “Hello” is the label for the arrow connecting the two boxes
- -> specifies the direction of the arrow
To run this script, we use the groff command:
$ groff -Tascii -p diagram.roff
+------+
| foo  |
|Hello |
+-bar--+
We run the groff command to invoke the Groff typesetting system. In addition, the -Tascii option specifies the ASCII output format. Next, we use the -p preprocessor, which indicates the use of PIC markup language to generate an ASCII diagram. Lastly, we include the input file for Groff.
3. Using ASCII Draw
ASCII Draw is an open-source tool used for drawing ASCII diagrams. In addition, it has a graphical user interface which makes it fairly easy and simple to use for beginners.
Since ASCII Draw isn’t available by default on many systems, we use Flatpak to install it:
$ flatpak install flathub io.github.nokse22.asciidrawNow, let’s open ASCII Draw and create a diagram:
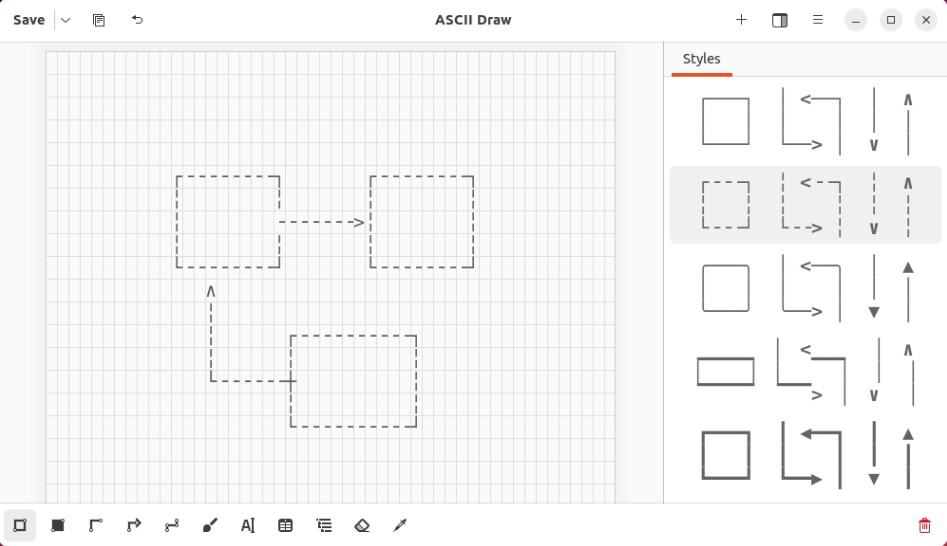
When open, we can use different tools from the menu bar and draw a neat ASCII diagram.
Due to its graphical nature and grid snapping, the tool is fairly easy to use as long as we’re working within a graphical user interface (GUI) environment.
4. Conclusion
In this article, we discussed how to draw ASCII diagrams in the shell along with one option for a desktop environment.
First, we explored the command-line diagram generators in Linux, including Graph-Easy, jp2a, ADia, and Groff. Lastly, we discussed a desktop-based tool to draw ASCII diagrams.
To conclude, each method here has its advantages and disadvantages. Therefore, the appropriate method to create ASCII diagrams depends on the specific needs and preferences of the users.