

Learn through the super-clean Baeldung Pro experience:
>> Membership and Baeldung Pro.
No ads, dark-mode and 6 months free of IntelliJ Idea Ultimate to start with.
Learn through the super-clean Baeldung Pro experience:
>> Membership and Baeldung Pro.
No ads, dark-mode and 6 months free of IntelliJ Idea Ultimate to start with.
In this tutorial, we’re going to first discuss the atop and sar commands in Linux for historical analysis of memory usage. Then, we move forward with the Zabbix monitoring tool.
Monitoring system resources is crucial for the optimum performance of a server. Memory usage, in particular, is a key indicator of system performance and stability.
Linux does not inherently store long-term, detailed system resource utilization data. For instance, tools like top, htop, and free provide real-time snapshots of this information. But they don’t store the data over time.
However, tools like atop and sysstat are specifically designed to collect and store this system performance data. They essentially create a historical record of system behavior.
Also, tools like Nagios, Zabbix, or Prometheus can be configured to collect memory usage metrics at regular intervals and store them in a database. This allows for historical analysis and visualization.
atop is an advanced system and process monitor tool that provides real-time and historical data on system performance.
To install atop on Ubuntu, we use the package manager:
$ sudo apt install atopatop automatically starts logging operation after installation. It starts storing log data at the location /var/log/atop/atop_xxx. The file names are formatted in the pattern ccyymmdd (year, month, day). Thus, we replace ccyymmdd with the actual date of the log file we want to examine.
We can also modify the log file location using the -w option. In the above panel, atop shows system-wide memory usage. Whereas in the below panel, statistics are displayed on a per-process basis.
Let’s take the example of monitoring system performance based on memory. Basically, we use the -m (memory details) option here:
$ atop -m
cpu |  sys       0% |  user      1%  |  irq       0% |  idle     99%  |  cpu002 w  0% |  curscal  11%  |
cpu |  sys       0% |  user      1%  |  irq       0% |  idle     99%  |  cpu007 w  0% |  curscal  11%  |
As well, we can read the report of memory usage for a given period of time. For example, let’s read the data from 4:00 pm to 4:30 pm:
$ atop -r /var/log/atop/atop_20240811 -b 1600 -e 1630 -M
...
MEM |  tot    23.4G |  free   16.9G  |  cache   2.9G |  buff  185.2M  |  slab  363.9M |  numnode    1  |
SWP |  tot     5.6G |  free    5.6G  |  swcac   0.0M |  zstor   0.0M  |  vmcom  22.0G |  vmlim  17.3G  |
...
The option -M indicates memory consumption. Also, 1600 is the start time and 1630 is the end time for the date of August 11, 2024.
atopsar is a tool for generating reports of performance at the system level. Specifically, it can use the raw files written by atop or run standalone.
For example, let’s see the memory utilization for 5 minutes at an interval of 10 seconds:
$ atopsar -m 10 5
...
-------------------------- analysis date: 2024/08/19 --------------------------
15:48:45  memtotal memfree buffers cached dirty slabmem  swptotal swpfree _mem_
15:48:55    23947M  18381M    163M  2686M    0M    353M     5721M   5721M
15:49:05    23947M  18388M    163M  2679M    0M    353M     5721M   5721M
...
On the other hand, we can also read a log file stored by atop:
$ atopsar -m -r /var/log/atop/atop_20240820
...
-------------------------- analysis date: 2024/08/20 --------------------------
16:10:08  memtotal memfree buffers cached dirty slabmem  swptotal swpfree _mem_
16:20:08    23947M  18192M    163M  3200M    0M    354M     5721M   5721M
16:30:08    23947M  17931M    166M  3228M    4M    360M     5721M   5721M
...
The above command also shows the memory usage for August 20, 2024.
The sar command, short for System Activity Report, can be used to gather data on CPU, memory usage, disk activity, and more.
sar is part of sysstat package. So let’s install the package:
$ sudo apt install sysstatTo start collecting data with sar, we need to activate it. This is done by setting the ENABLED variable to true within the /etc/default/sysstat configuration file:
$ cat /etc/default/sysstat
#
# ...
# and /etc/cron.daily/sysstat files
#
# Should sadc collect system activity informations? Valid values
# are "true" and "false". Please do not put other values, they
# will be overwritten by debconf!
ENABLED="true"
After that, we start and enable the systat service:
$ sudo systemctl enable sysstat && sudo systemctl start sysstatThus, the sysstat service now automatically collects performance data. It stores the files in the /var/log/sysstat directory.
Let’s see the memory statistics for every 1 second for 5 times:
$ sar -r 1 5
Linux 6.5.0-45-generic (juveriya) 	12/08/24 	_x86_64_ ...
12:44:25 PM IST kbmemfree   kbavail kbmemused  %memused kbbuffers ...
12:44:26 PM IST  17886756  20239612   3191684     13.02    174032 ...
...
Similarly, we can see memory usage data for the 12th day of the current month:
$ sar -r -f /var/log/sysstat/sa12
Linux 6.5.0-45-generic (juveriya) 	12/08/24 	_x86_64_	(8 CPU)
12:36:21 PM IST  LINUX RESTART	(8 CPU)
12:40:01 PM IST kbmemfree   kbavail kbmemused  %memused kbbuffers  kbcached  ...
01:08:22 PM IST  18160240  20511336   2937300     11.98    175492   2863472 ...
Average:     18160240  20511336   2937300     11.98    175492   2863472  ...
Notably, the saxx file is a binary-type file. Normal text editors can’t display them in a usable manner.
While both atop and sar offer valuable insights into system performance, they come with certain limitations. For example, when analyzing data over extended periods, log files can become large. Thus, manually parsing through them to find specific trends or issues can be time-consuming. Similarly, they lack real-time alerts or a user-friendly interface for visualizing trends over time.
This is where Zabbix stands out and provides an ideal monitoring solution. Zabbix not only provides continuous, real-time monitoring but also offers a robust platform for alerting, trending, and analyzing system metrics.
Zabbix is a powerful enterprise-grade monitoring platform. It supports various metrics collection. For example, it includes CPU, disk, network, and memory usage analysis. As well, it provides real-time monitoring, historical data storage, and alerting options.
Zabbix uses a client-server architecture. Here, the server component collects data from multiple agents installed on different hosts. This architecture allows centralized monitoring of a network of machines. Thus, it makes it easier to manage and troubleshoot system resources.
Installing Zabbix involves setting up several components:
Let’s install each component one by one.
Before we install Zabbix, let’s ensure that the Ubuntu server is up-to-date:
$ sudo apt-get update
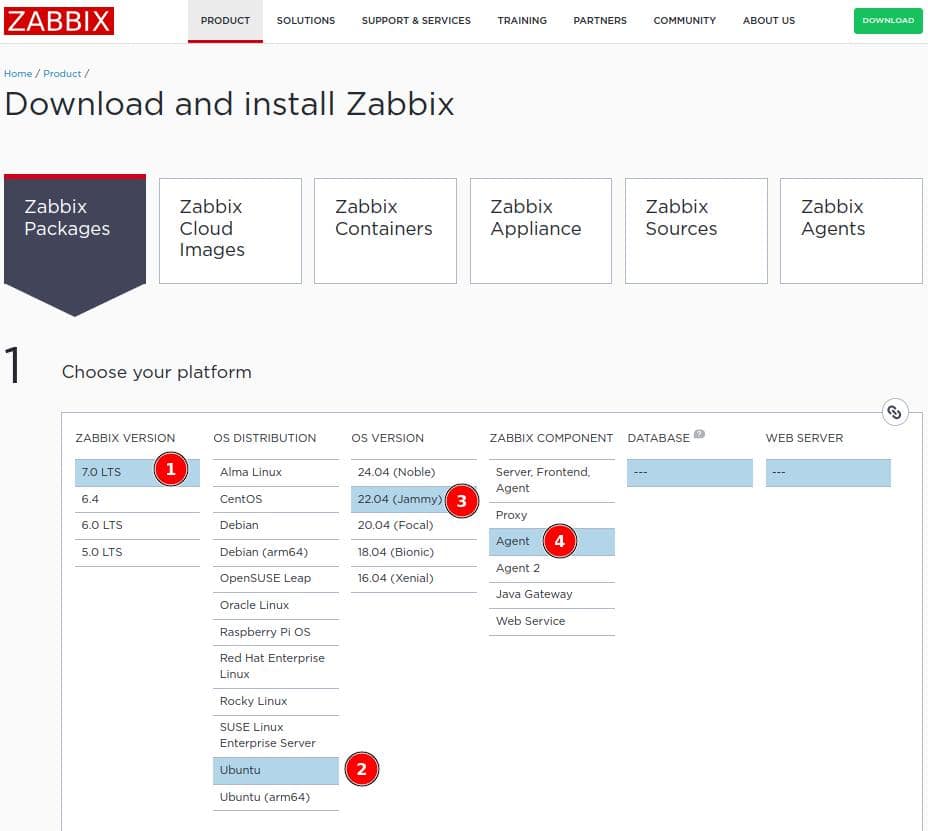
$ sudo apt-get upgradeNext, we go to the Zabbix download page. Here, we select the desired version of Zabbix depending on the OS and components to install. Similarly, we select the database and web server to use:
Finally, we can now follow the on-screen instructions to proceed further.
First, we add the Zabbix repository to the system:
$ sudo wget https://repo.zabbix.com/zabbix/7.0/ubuntu/pool/main/z/zabbix-release/zabbix-release_7.0-2+ubuntu22.04_all.deb
$ sudo dpkg -i zabbix-release_7.0-2+ubuntu22.04_all.deb
$ sudo apt update
Then, we install the Zabbix server, frontend, and other components:
$ sudo apt install mysql-server zabbix-server-mysql zabbix-frontend-php zabbix-apache-conf zabbix-sql-scriptsAlso, we can optionally install the Zabbix agent here. In this way, we can collect data about the Zabbix server status itself. But for now, we’ll not install the agent on the server.
Next, we login to the database:
$ sudo mysqlNext, we create a database zabbix and add a user named zabbix to avoid logging in as the root user:
mysql> create database zabbix character set utf8mb4 collate utf8mb4_bin;
mysql> create user zabbix@localhost identified by 'password';
mysql> grant all privileges on zabbix.* to zabbix@localhost;
mysql> set global log_bin_trust_function_creators = 1;
mysql> quit;
Further, we import the initial schema and data to the database zabbix using the password we created above:
$ sudo sh -c 'zcat /usr/share/zabbix-sql-scripts/mysql/server.sql.gz | mysql --default-character-set=utf8mb4 -uzabbix -p zabbix'Then, we disable the log_bin_trust_function_creators option:
$ sudo mysql -uroot -p
password
mysql> set global log_bin_trust_function_creators = 0;
mysql> quit;
Next, we edit the Zabbix server configuration file to connect to the database. In this file, we update the database details:
$ cat /etc/zabbix/zabbix_server.conf
DBName=zabbix
DBUser=zabbix
DBPassword=our_password
Moving on, we restart the Zabbix server process and enable it to start automatically at system boot:
$ sudo systemctl restart zabbix-server
$ sudo systemctl enable zabbix-server
Next, we move on to configuring the Zabbix frontend.
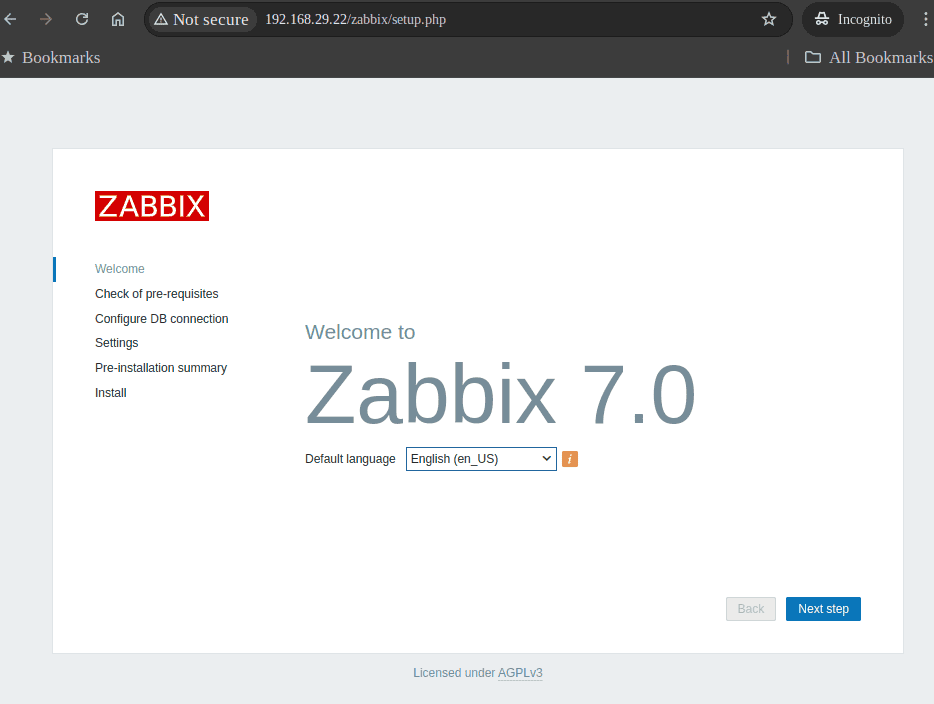
Now, we open a web browser and go to http://server_ip/zabbix:
If the above page doesn’t appear, we can try restarting the web server.
In the next step, we see the pre-requisite for Zabbix installation:

We should make sure that all the items are OK.
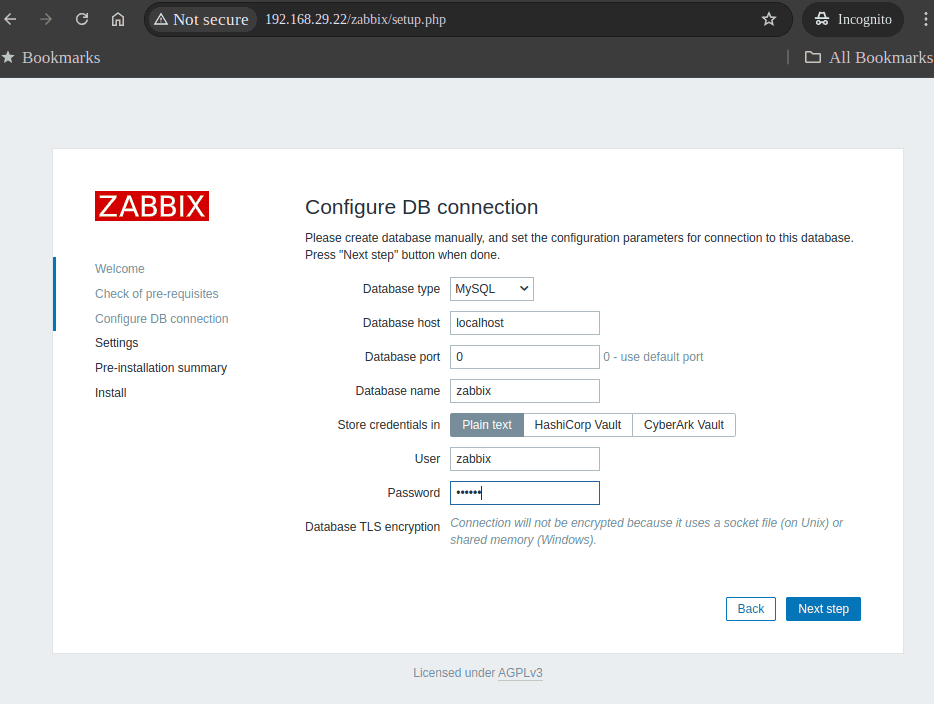
Following the setup wizard, we fill in the database information we set up earlier (DBName, DBUser, DBPassword):
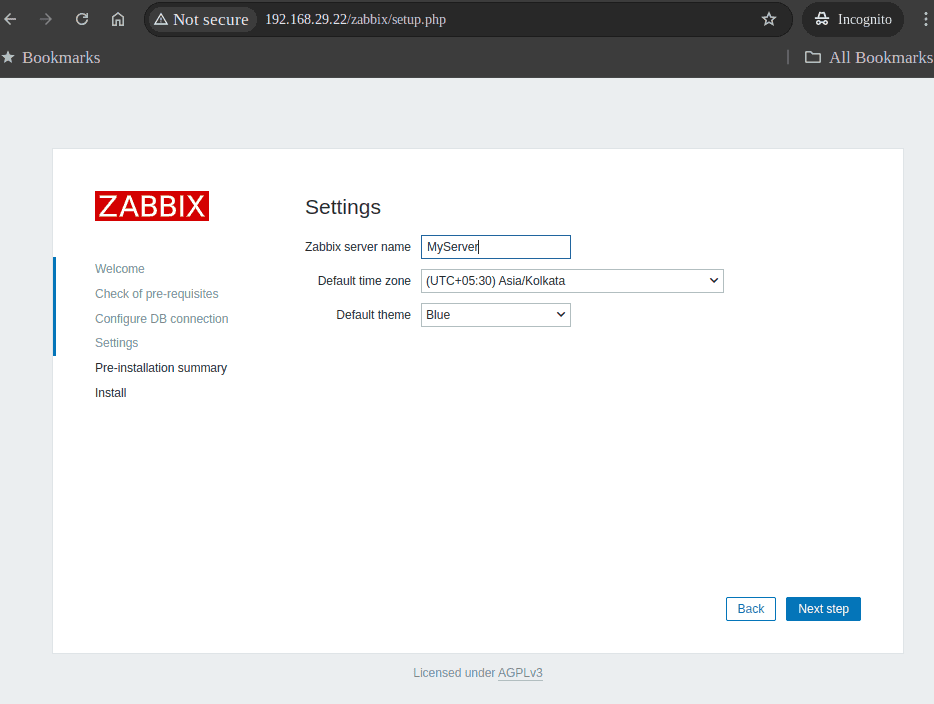
Now, we enter a name for the Zabbix server and select a timezone:
Further, we review the installation. Then we click Next step:

Thus, the installation is now complete.

After completing the setup, we log in to the Zabbix web interface with the default credentials:

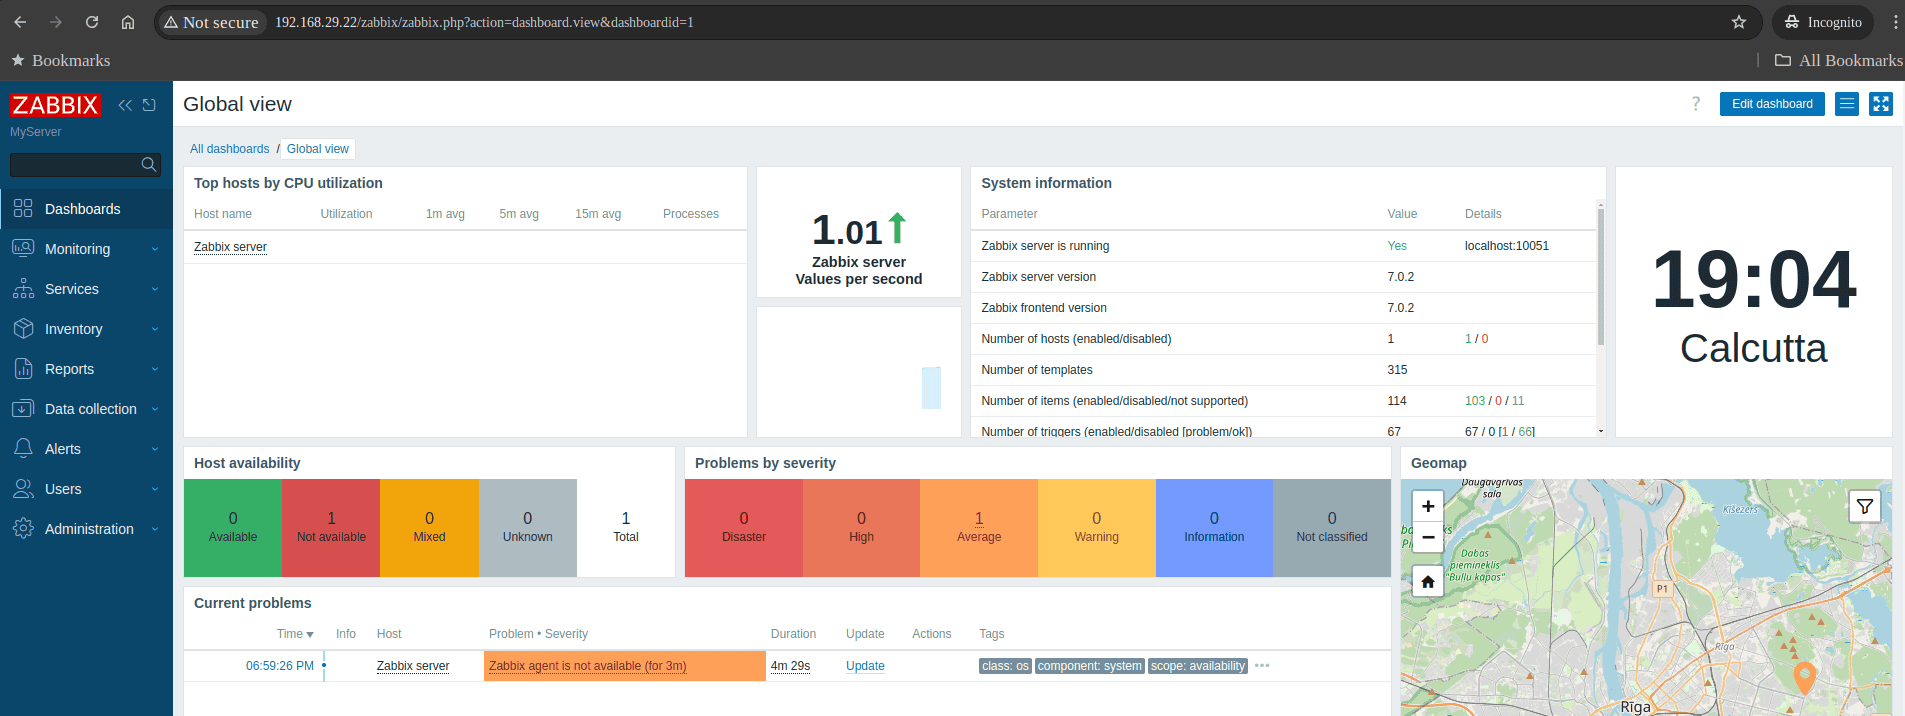
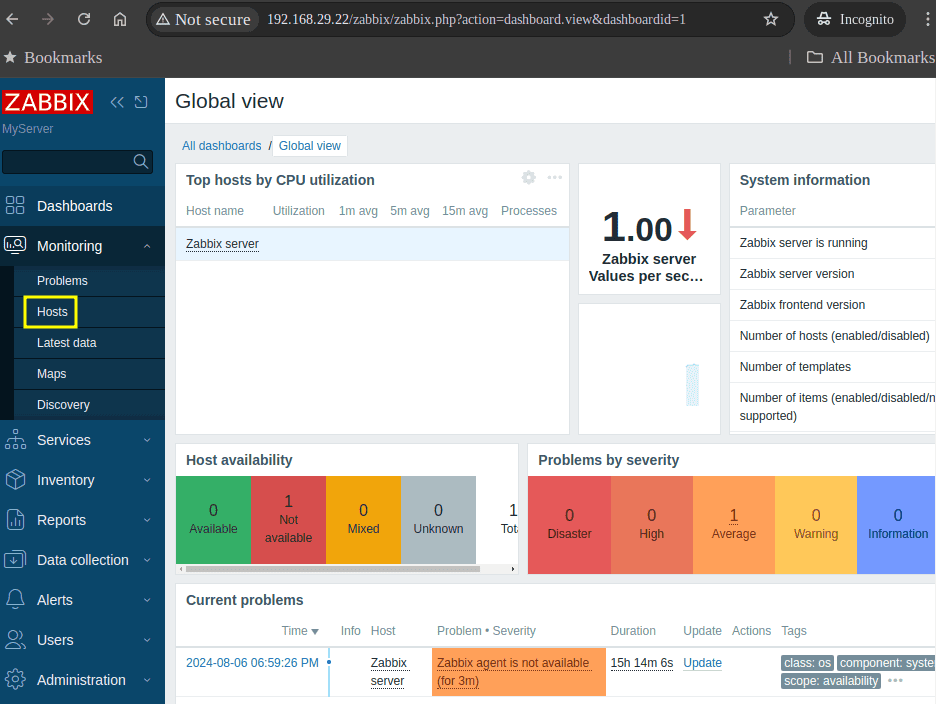
We can now see the Zabbix frontend homepage:
Next, we move on to installing the agent component on the target host.
Let’s ssh to our target host and add the package repository for the agent. The steps are similar to that of the server. First, we select the Zabbix server version and the OS distribution and version. Then, under the Zabbix component, we select the option Agent:
Just as we did in the case of the server, we’ll add the repository for the Agent:
$ sudo wget https://repo.zabbix.com/zabbix/7.0/ubuntu/pool/main/z/zabbix-release/zabbix-release_7.0-2+ubuntu22.04_all.deb
$ sudo dpkg -i zabbix-release_7.0-2+ubuntu22.04_all.deb
$ sudo apt update
Then, we use the apt command to install the package:
$ sudo apt install zabbix-agentFinally, we start and enable the process:
$ sudo systemctl restart zabbix-agent
$ sudo systemctl enable zabbix-agent
Next, we move on to adding a host for monitoring.
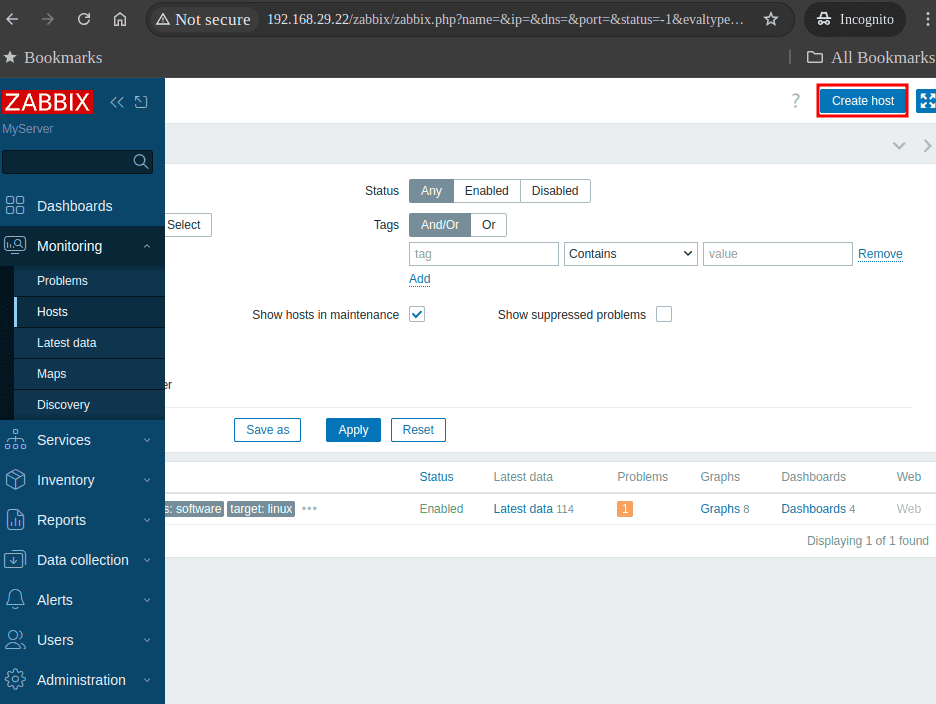
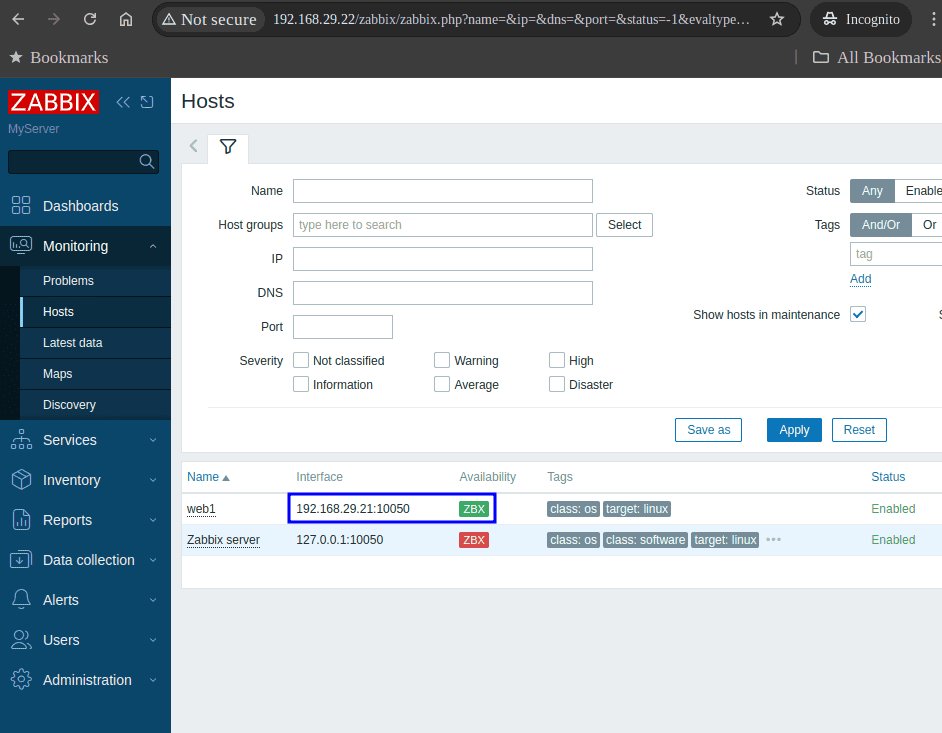
On the left sidebar on the frontend webpage, we select the Hosts option:
On the new page, we click the option Create host:
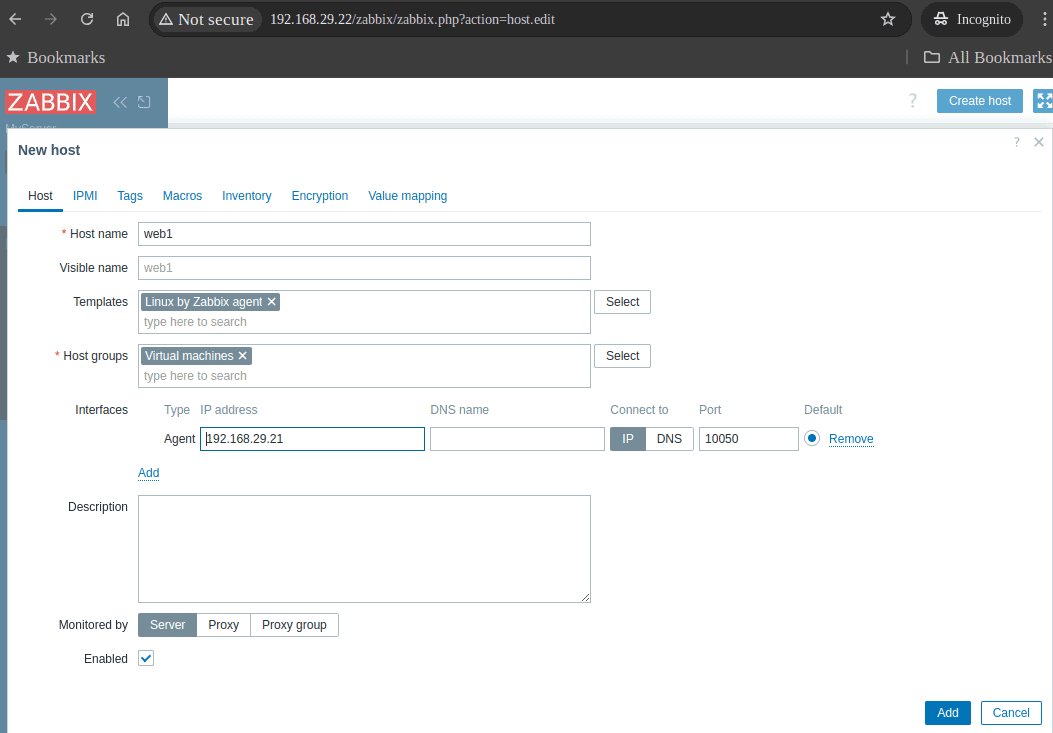
Further, we fill in the details of the host. Hence, we add the hostname and IP address of the server. Under the Templates option, we select the option Linux by Zabbix agent:
We also added the host to a group from the pre-defined list. After adding the host, we wait for the host to become available. As a matter of fact, the availability option turns green when the host becomes available:
Finally, we can go to the Graphs option and select the options related to memory usage. Thus, we can see the memory usage statistics of the host:
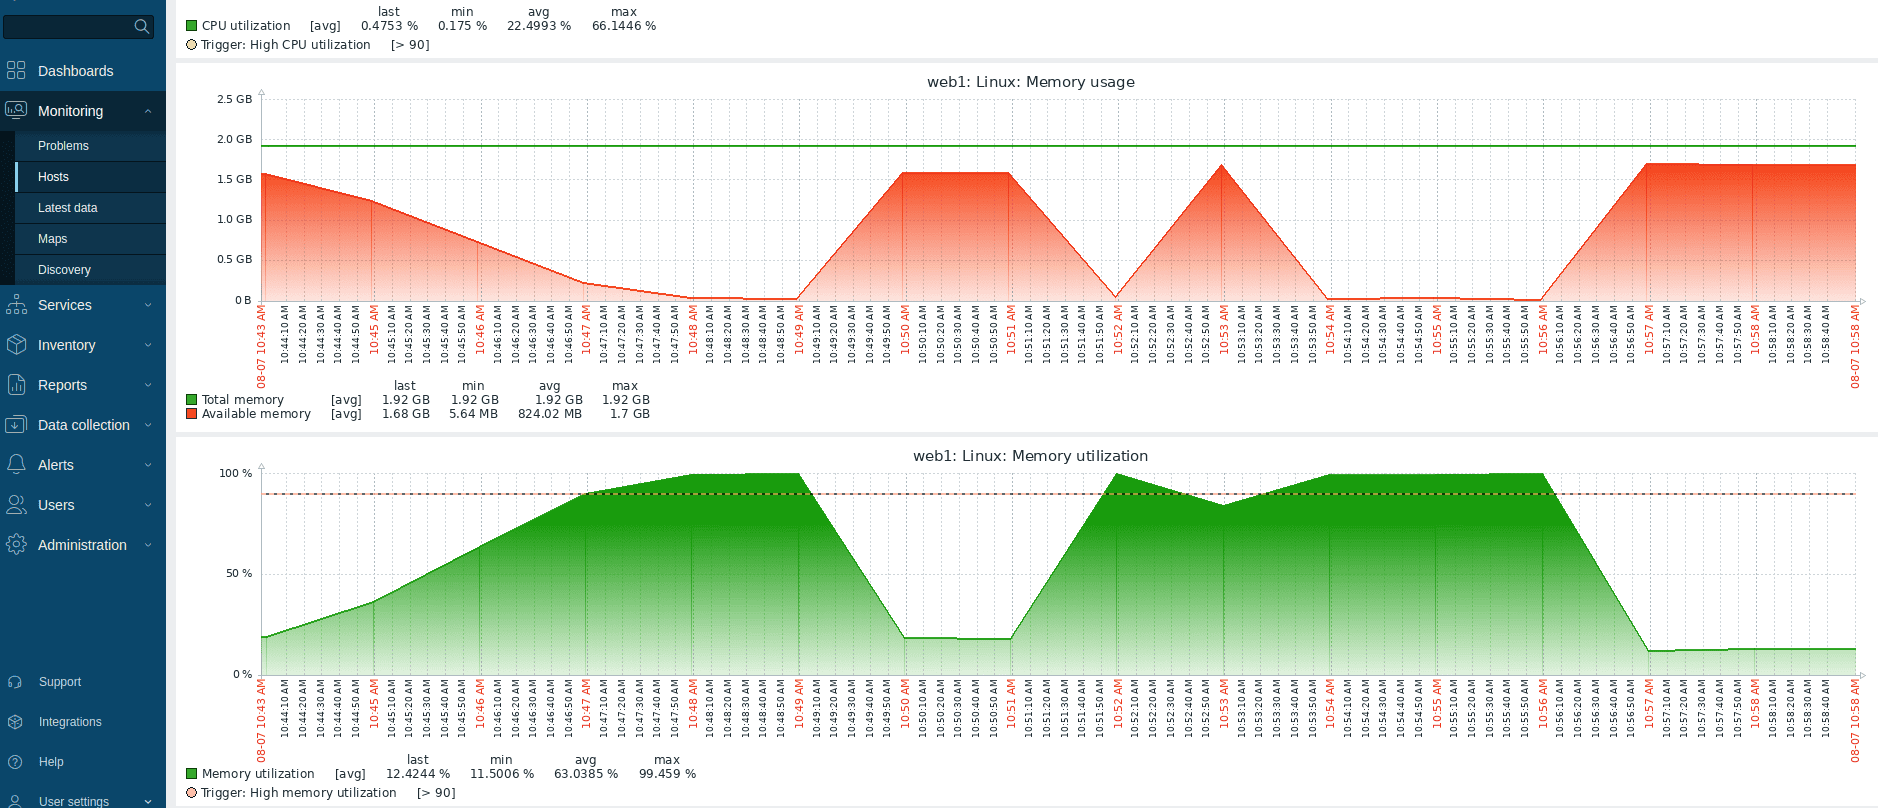
In this way, we can add more hosts for monitoring. Also, to test fluctuations in VM memory usage and observe the changes in our Zabbix graphs, we can simulate a high memory load on the VM. For example, we can use tools like stress to generate high load.
In this article, we saw how to keep and check memory usage history in Linux. Overall, we saw three ways for this:
While atop and sysstat offer command-line solutions for collecting and analyzing memory data, Zabbix provides a centralized platform for comprehensive monitoring.