

Learn through the super-clean Baeldung Pro experience:
>> Membership and Baeldung Pro.
No ads, dark-mode and 6 months free of IntelliJ Idea Ultimate to start with.
Last updated: March 18, 2024
Learn through the super-clean Baeldung Pro experience:
>> Membership and Baeldung Pro.
No ads, dark-mode and 6 months free of IntelliJ Idea Ultimate to start with.
Monitoring the system’s performance is an important administration task. Therefore, we can assess the system’s health, track down bottlenecks, and estimate the hardware capabilities. However, as we gather data on an almost continuous basis, the amount of data involved is enormous. So, we need to use efficient tools to both collect and present the data,
In this tutorial, we’ll learn about sar and the data that it produces.
sar stands for System Activity Report. We can use it to retrieve data about CPU, memory usage, disk activity, and many others. Let’s notice that the command is a part of the sysstat package. Thus, we need to install it first:
$ sudo apt-get install sysstatThen, let’s enable data collecting by editing the default configuration file:
$ sudo joe /etc/default/sysstatNow, we need to add:
ENABLED="true"As sysstat is a systemd-controlled service, let’s enable and start it:
$ sudo systemctl enable sysstat
$ sudo systemctl start sysstat
Now let’s check the service’s status:
$ systemctl status sysstat
● sysstat.service - Resets System Activity Data Collector
     Loaded: loaded (/lib/systemd/system/sysstat.service; enabled; vendor prese>
     Active: active (exited) since Sun 2022-10-09 10:51:07 CEST; 28min ago
       Docs: man:sa1(8)
             man:sadc(8)
             man:sar(1)
    Process: 756 ExecStart=/usr/lib/sysstat/debian-sa1 --boot (code=exited, sta>
   Main PID: 756 (code=exited, status=0/SUCCESS)
# ...
Then, let’s ask sar for the service’s version:
$ sar -V
sysstat version 12.2.0
(C) Sebastien Godard (sysstat <at> orange.fr)
Finally, let’s check the command syntax:
$ sar --help
Usage: sar [ options ] [ <interval> [ <count> ] ]
# ...
As we’ll use Ubuntu 20.04 LTS throughout this tutorial, let’s notice that some configuration details are specific for the Debian-like distributions.
Now, let’s note that sar can provide both current and past data about the system activity. In addition, the default statistic is the collective activity of all CPUs.
For current data, we should provide an interval between gathering consecutive data samples. Moreover, we can limit the number of samples with the count option. So, let’s show 5 samples of the CPUs activity counters every 10 seconds, with count = 5 and interval = 10:
$ sar 10 5
Linux 5.4.0-58-generic (ubuntu) 	10/09/2022 	_x86_64_	(4 CPU)

11:38:07 AM     CPU     %user     %nice   %system   %iowait    %steal     %idle
11:38:17 AM     all      0.50      0.00      0.20      0.03      0.00     99.27
11:38:27 AM     all      0.30      0.00      0.10      0.03      0.00     99.57
11:38:37 AM     all      0.28      0.00      0.10      0.98      0.00     98.65
11:38:47 AM     all      2.76      0.00      1.03      2.44      0.00     93.77
11:38:57 AM     all      1.17      0.00      0.50      0.07      0.00     98.26
Average:        all      1.00      0.00      0.39      0.71      0.00     97.91
Now, as an example of historical data, let’s show the corresponding figures for the current day. Thus, let’s drop interval and count:
$ sar
Linux 5.4.0-58-generic (ubuntu) 	10/07/2022 	_x86_64_	(4 CPU)

04:24:50 PM  LINUX RESTART	(4 CPU)

04:35:01 PM     CPU     %user     %nice   %system   %iowait    %steal     %idle
04:46:03 PM     all     14.56      0.63     43.90      7.26      0.00     33.65
04:55:01 PM     all      5.99      0.95      1.44     33.89      0.00     57.72
# ...
Average:        all     38.80      0.31     30.72      1.87      0.00     28.30
We should notice the difference – the collecting interval is now 10 minutes. In addition, we’ve got the information about the system start time.
The sysstat service collects data on a daily basis. We should look for the data files in the /var/log/sysstat folder:
$ ls -1l /var/log/sysstat
total 2024
-rw-r--r-- 1 root root  42236 Oct  6 21:05 sa06
-rw-r--r-- 1 root root  59424 Oct  7 20:25 sa07
-rw-r--r-- 1 root root 430080 Oct  8 21:21 sa08
-rw-r--r-- 1 root root 248156 Oct  9 18:29 sa09
-rw-r--r-- 1 root root  35344 Oct 10 07:37 sa10
-rw-r--r-- 1 root root  28456 Oct 11 16:47 sa11
-rw-r--r-- 1 root root  62411 Oct  7 16:32 sar06
-rw-r--r-- 1 root root  82639 Oct  8 10:06 sar07
-rw-r--r-- 1 root root 629738 Oct  9 10:56 sar08
-rw-r--r-- 1 root root 366246 Oct 10 07:23 sar09
-rw-r--r-- 1 root root  52082 Oct 11 16:39 sar10
Let’s notice the presence of two types of files, sa, and sar. The former is a binary file containing raw performance data, while the latter is an ASCII file. Further, the number at the file name end denotes the day of the month. So, sa09 keeps performance statistics taken on October 9th. Finally, we can regard the sar text files as the reports for yesterday.
Now, let’s show the data from n days ago by passing this number as an option. In addition, let’s notice the current date in the prompt:
11.10.2022 $ sar -2
#Linux 5.4.0-58-generic (ubuntu) 	10/09/2022 	_x86_64_	(4 CPU)

10:51:07 AM  LINUX RESTART	(4 CPU)

10:53:01 AM     CPU     %user     %nice   %system   %iowait    %steal     %idle
10:55:01 AM     all      3.83      5.65      2.24     29.29      0.00     58.99
11:05:01 AM     all     12.60      0.30      2.69      5.72      0.00     78.68
# ...
Average:        all     14.07      0.44      3.53      1.40      0.00     80.56
Instead of providing the relative time shift, let’s print data for a particular day. So, we should the f option to point to the sa file of a given day. Thus, for the October 6th:
11.10.2022 $ sar -f /var/log/sysstat/sa06
Linux 5.4.0-58-generic (ubuntu) 	10/06/2022 	_x86_64_	(4 CPU)

07:14:29 PM  LINUX RESTART	(4 CPU)

07:15:01 PM     CPU     %user     %nice   %system   %iowait    %steal     %idle
07:25:01 PM     all     11.06      2.28      2.70      2.72      0.00     81.25
07:36:20 PM     all      3.35      0.00      1.32     15.94      0.00     79.38
07:45:07 PM     all      2.15      0.00      1.37     62.65      0.00     33.82
# ...
Average: all 4.25 0.33 1.25 13.06 0.00 81.11Now let’s be more specific about the time range within one day. So, we can use the s option for the statistic’s start time and e for the end one. We should use the hh:mm:ss 24-hour time format. Moreover, we need to read data from a file for these options to work. So, let’s inspect the period between 12:41:01 and 12:27:00 on October 9th:
11.10.2022 $ LC_TIME=en_UK.utf8 sar -s 12:41:01 -e 17:27:00 -f /var/log/sysstat/sa09
Linux 5.4.0-58-generic (ubuntu) 	10/09/22 	_x86_64_	(4 CPU)

12:41:01        CPU     %user     %nice   %system   %iowait    %steal     %idle
12:43:01        all      0.58      0.00      0.24      0.86      0.00     98.32
12:45:01        all      0.36      0.00      0.19      0.20      0.00     99.24
17:21:25        all      1.90      0.00      1.15     28.59      0.00     68.36
17:23:01        all      0.85      0.00      0.36      1.22      0.00     97.57
17:25:01        all      0.36      0.00      0.20      0.15      0.00     99.29
Average:        all      0.99      0.00      0.50      4.25      0.00     94.25
Let’s emphasize that the sar output is locale-sensitive. Consequently, the time’s been displayed in the 12-hour (AM/PM) format so far. However, as we want to avoid the time format confusion, we set the 24-hour format locally for the sar call with LC_TIME=en_UK.utf8.
Let’s inspect the /etc/cron.d/sysstat file, which defines the sysstat entries for cron:
$ cat /etc/cron.d/sysstat
# The first element of the path is a directory where the debian-sa1
# script is located
PATH=/usr/lib/sysstat:/usr/sbin:/usr/sbin:/usr/bin:/sbin:/bin

# Activity reports every 10 minutes everyday
5-55/10 * * * * root command -v debian-sa1 > /dev/null && debian-sa1 1 1

# Additional run at 23:59 to rotate the statistics file
59 23 * * * root command -v debian-sa1 > /dev/null && debian-sa1 60 2
So the first entry says to write one sample every 10th minute between the 5th and 55th minute of each hour. The next entry flushes the statistics files around midnight.
Consequently, if we want to change the frequency of data sampling to one every two minutes, we should edit the first entry:
# Activity reports every 2 minutes everyday
1-59/10 * * * * root command -v debian-sa1 > /dev/null && debian-sa1 1 1
Let’s notice that we’ve adjusted the minute’s range to 1-59. Otherwise, we’d get a gap around the full hours.
Now let’s look through a choice of statistics offered by sar. As an example, we’re going to show 3 samples of current activities with 2 seconds intervals. Regardless, we can deal with historical data in the same way. Let’s notice that the meaning of each field is explained in the command’s manual.
With the P option followed by a number, we can access statistics for the individual processors. So, let’s monitor the first one:
$ sar -P 0 2 3
Linux 5.4.0-58-generic (ubuntu) 	10/12/2022 	_x86_64_	(4 CPU)

08:49:09 PM     CPU     %user     %nice   %system   %iowait    %steal     %idle
08:49:11 PM       0      1.50      0.00      0.50      0.00      0.00     98.00
08:49:13 PM       0      1.50      0.00      1.50      0.00      0.00     97.00
08:49:15 PM       0      1.50      0.00      1.50      0.00      0.00     97.00
Average:          0      1.50      0.00      1.17      0.00      0.00     97.33
In addition, we can pass ALL instead of the CPU’s number to obtain the global and single processor activity as well:
$ sar -P ALL 1 1
Linux 5.4.0-58-generic (ubuntu) 	10/14/2022 	_x86_64_	(4 CPU)

05:16:02 AM     CPU     %user     %nice   %system   %iowait    %steal     %idle
05:16:03 AM     all      0.75      0.00      0.50      0.00      0.00     98.76
05:16:03 AM       0      0.00      0.00      1.00      0.00      0.00     99.00
05:16:03 AM       1      1.98      0.00      0.00      0.00      0.00     98.02
05:16:03 AM       2      0.00      0.00      0.00      0.00      0.00    100.00
05:16:03 AM       3      0.99      0.00      0.99      0.00      0.00     98.02

Average:        CPU     %user     %nice   %system   %iowait    %steal     %idle
Average:        all      0.75      0.00      0.50      0.00      0.00     98.76
Average:          0      0.00      0.00      1.00      0.00      0.00     99.00
Average:          1      1.98      0.00      0.00      0.00      0.00     98.02
Average:          2      0.00      0.00      0.00      0.00      0.00    100.00
Average: 3 0.99 0.00 0.99 0.00 0.00 98.02Now, let’s inspect the memory usage with the r option:
$ sar -r 2 3
Linux 5.4.0-58-generic (ubuntu) 	10/12/2022 	_x86_64_	(4 CPU)

09:40:28 PM kbmemfree   kbavail kbmemused  %memused kbbuffers  kbcached  kbcommit   %commit  kbactive   kbinact   kbdirty
09:40:30 PM    427832    949428   2135052     54.53     84428   1086344   8663392    103.59   2467672    646532       132
09:40:32 PM    427392    948996   2136052     54.55     84428   1085784   8659580    103.55   2466984    646588       132
09:40:34 PM    429468    951080   2136004     54.55     84436   1083748   8659580    103.55   2466440    644904       196
Average: 428231 949835 2135703 54.54 84431 1085292 8660851 103.56 2467032 646008 153Next, let’s use the S option for swap usage:
$ sar -S 2 3
Linux 5.4.0-58-generic (ubuntu) 	10/12/2022 	_x86_64_	(4 CPU)

09:41:23 PM kbswpfree kbswpused  %swpused  kbswpcad   %swpcad
09:41:25 PM   3684888    762340     17.14     28660      3.76
09:41:27 PM   3684888    762340     17.14     28660      3.76
09:41:29 PM   3684888    762340     17.14     28660      3.76
Average: 3684888 762340 17.14 28660 3.76Subsequently, let’s check the overall I/O activity with b:
$ sar -b 2 3
Linux 5.4.0-58-generic (ubuntu) 	10/12/2022 	_x86_64_	(4 CPU)

09:42:09 PM       tps      rtps      wtps      dtps   bread/s   bwrtn/s   bdscd/s
09:42:11 PM      0.00      0.00      0.00      0.00      0.00      0.00      0.00
09:42:13 PM     12.50      0.00     12.50      0.00      0.00    124.00      0.00
09:42:15 PM      0.50      0.00      0.50      0.00      0.00    440.00      0.00
Average: 4.33 0.00 4.33 0.00 0.00 188.00 0.00Now, let’s measure the network activity with the n option. Moreover, we’re going to use the keyword IP to show the IPv4 network traffic:
$ sar -n IP 2 3
Linux 5.4.0-58-generic (ubuntu) 	10/12/2022 	_x86_64_	(4 CPU)

09:42:54 PM    irec/s  fwddgm/s    idel/s     orq/s   asmrq/s   asmok/s  fragok/s fragcrt/s
09:42:56 PM      0.00      0.00      0.00      0.00      0.00      0.00      0.00      0.00
09:42:58 PM      1.00      0.00      1.00      1.00      0.00      0.00      0.00      0.00
09:43:00 PM      6.50      0.00      6.50      6.50      0.00      0.00      0.00      0.00
Average: 2.50 0.00 2.50 2.50 0.00 0.00 0.00 0.00Finally, let’s report the task queue length and the load averages with q:
$ sar -q 2 3
Linux 5.4.0-58-generic (ubuntu) 	10/12/2022 	_x86_64_	(4 CPU)

09:43:54 PM   runq-sz  plist-sz   ldavg-1   ldavg-5  ldavg-15   blocked
09:43:56 PM         0       901      0.86      0.98      0.93         0
09:43:58 PM         0       901      0.86      0.98      0.93         0
09:44:00 PM         0       901      0.86      0.98      0.93         0
Average: 0 901 0.86 0.98 0.93 0The sar command provides plenty of data, which stems from many performance indicators and many time points combined together. Consequently, we can find the graphical data presentation very helpful.
The isag command comes in a package of the same name. So, let’s take a look at its GUI:
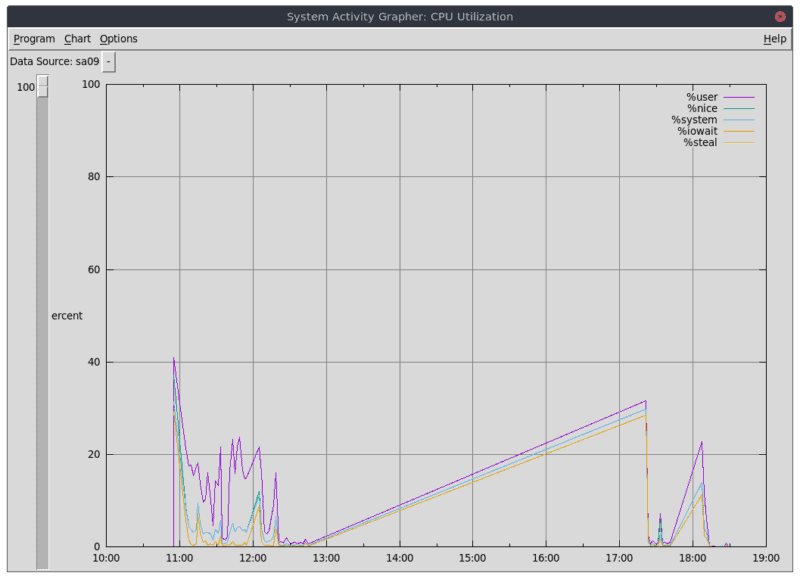
Now, let’s notice that the command reads the sa files in the native sar binary format. Consequently, we need to select the appropriate file with the Data Source widget to display the statistics of the corresponding day. Further, we can use Chart to select the performance indicator to display. Finally, isag offers the export of the chart in JPG format.
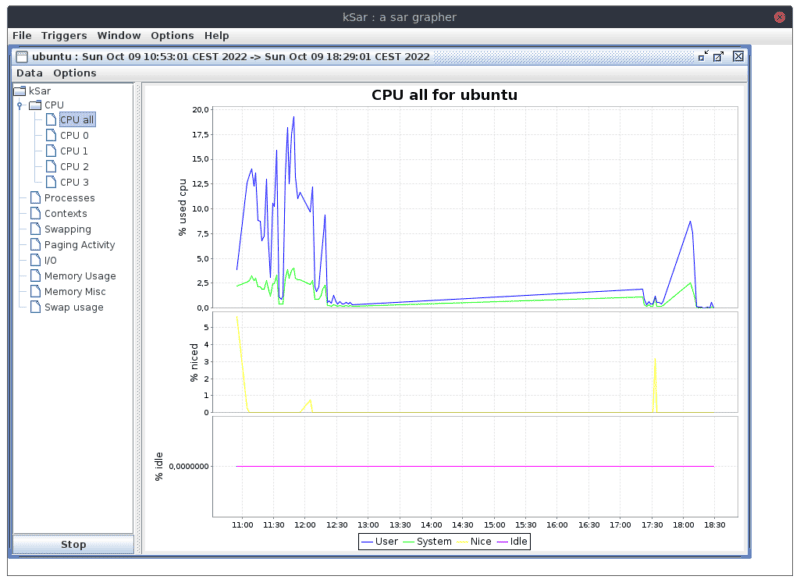
kSar is a third-party, BSD-licensed, java written utility to visualize the sar data. So, let’s download version 5.0.6 and extract it. As kSar accepts only text files, we need to prepare the sa09text.txt file first:
$ LC_ALL=C sar -A -f /var/log/sysstat/sa09 > sa09text.txtNext, let’s start the program in its folder:
$ java -jar kSar.jarThen we’re going to read our file in the Data menu. Next, we can select different statistics in the tree widget on the left:
Let’s notice the Data menu allows us to read local and remote files as well. In addition, we can use a command to create a text file:
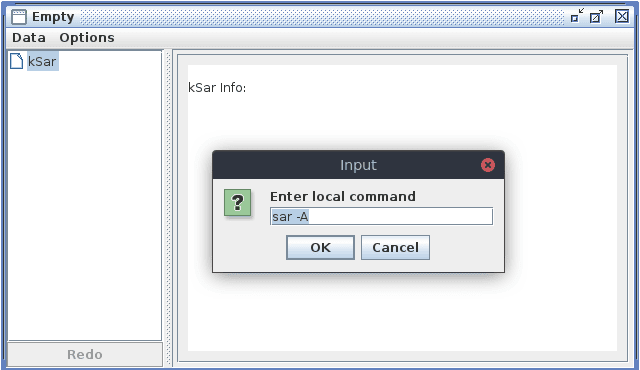
As we haven’t provided the name of the sa file, we’re going to create today’s statistics. Finally, let’s notice that we have various graphical formats at our disposal. For example, we can export all activities into a single, multipage pdf file.
In this article, we used the sar command to report various kernel activities. First, we learned how to install and configure the sysstat service. Then, we gathered the current system statistics. Subsequently, we retrieved the historical data and configured the way they were collected.
Next, we did an overview of a selection of statistics offered by sar. Finally, we learned about graphical frontends to display sar data.