

Learn through the super-clean Baeldung Pro experience:
>> Membership and Baeldung Pro.
No ads, dark-mode and 6 months free of IntelliJ Idea Ultimate to start with.
Last updated: October 10, 2024
Learn through the super-clean Baeldung Pro experience:
>> Membership and Baeldung Pro.
No ads, dark-mode and 6 months free of IntelliJ Idea Ultimate to start with.
Load testing is critical in many systems that exhibit a high amount of queries or parallel use.
In this tutorial, we’ll see how to use the ApacheBench (ab) tool for load testing.
For the purpose of this tutorial, we used a Ubuntu 22.04 machine and a basic Apache Web server installation on a virtual machine. We used this setup for tests with ApacheBench.
The ApacheBench utility is a command-line tool for load-testing Web servers. Basically, it simulates concurrent requests to a Web server. In this way, we can check how much traffic a server can handle without performance loss.
Initially developed to test the Apache HTTP server, ApacheBench can now be used for benchmarking other HTTP servers as well.
There are several primary advantages of using ab:
In general, users can often easily get acquainted with the tool and interpret its results.
Primarily, load testing evaluates how a system, application, or server performs under expected and peak user loads.
Specifically, load testing has some key goals:
Thus, load testing assesses how a system performs when subjected to varying user loads. Then, it gives the performance result in terms of response time, throughput, and resource utilization (CPU, main and secondary memory, and others).
With this in mind, let’s see how we can install and configure ApacheBench.
ApacheBench is a part of the apache2-utils package. Usually, we can install it using a native package manager like apt:
$ sudo apt install apache2-utils
After deploying ApacheBench, we can check the software version:
$ ab -V
This is ApacheBench, Version 2.3...
...
Similarly, we can explore available options with the -help sub-command:
$ ab -help
Usage: ab [options] [http[s]://]hostname[:port]/path
...
 -d Do not show percentiles served table.
-S Do not show confidence estimators and warnings.
-q Do not show progress when doing more than 150 request
...
Let’s now look at the meaning of ApacheBench results.
ApacheBench generates various metrics after a load test.
Let’s take a sample output to see and explore these metrics:
...
Concurrency Level:      50
Time taken for tests:   3.732 seconds
Requests per second:    13.40 [#/sec] (mean)
Time per request:       74.642 [ms] (mean, across all concurrent requests)
Transfer rate:          1103.90 [Kbytes/sec] received
...
Connection Times (ms)
min mean[+/-sd] median max
Connect: 0 4 0.8 4 4
Processing: 217 1004 523.9 1048 1926
Waiting: 209 998 524.1 1040 1921
Total: 218 1008 523.8 1052 1926
...
Some of the above stats are crucial for understanding the server performance:
Additionally, there are different connection times:
Furthermore, each timing distribution includes four key metrics: min, mean, standard deviation (+/- sd), median, and max.
Learning the metrics beforehand can help us interpret variations in results. In the same way, we get acquainted with what each metric means.
Let’s take some example use cases to test a server’s ability to handle traffic.
ab follows a simple syntax for load testing:
$ ab [options] [URL]Thus, we set the target Web address and specify the options to add.
Moreover, if using a plain Web address or URL, we put a trailing / at the end:
$ ab baeldung.com/
This is ApacheBench, Version 2.3 <$Revision: 1879490 $>
Copyright 1996 Adam Twiss, Zeus Technology Ltd,
...
Benchmarking baeldung.com (be patient).....done
...
Server Software:        ...
Server Hostname:        baeldung.com
Server Port:            ...
...
Thus, we avoid any errors while running the tests.
Next, let’s see options to carry out in-depth testing:
$ ab -n 500 -c 50 http://192.168.29.20/
...
Benchmarking 192.168.29.20 (be patient)
Completed 100 requests
Completed 200 requests
Completed 300 requests
Completed 400 requests
...
Server Software: Apache/2.4.52
Server Hostname: 192.168.29.20
Server Port: 80
...
The above command performs load testing according to the parameters and values:
Notably, the concurrency value should be smaller than the total number of requests.
ApacheBench is designed to test a single Web server. However, we can input multiple URLs. These are then load-tested one by one.
Particularly, using the parallel command we can target all URLs:
$ (echo "http://192.168.29.20/"; echo "https://www.baeldung.com/") | parallel 'ab -n 100 -c 10 {}'
...
Benchmarking 192.168.29.20 (be patient).....done
Server Software: Apache/2.4.52
Server Hostname: 192.168.29.20
Server Port: 80
...
Benchmarking www.baeldung.com (be patient).....done
Server Software:        cloudflare
Server Hostname:        www.baeldung.com
...
Alternatively, we can store the URL list in a file, say urls.txt:
$ cat urls.txt
https://baeldung.com/
http://192.168.29.20/
Then, we run the benchmarking test in parallel:
$ cat urls.txt | parallel 'ab -c 10 -n 100 {}'
...
Server Software: Apache/2.4.52
Server Hostname: 192.168.29.20
...
Server Software: cloudflare
Server Hostname: baeldung.com
...
As a result, 100 requests are sent to each target.
The -s option in ApacheBench sets the timeout period (in seconds):
$ ab -n 500 -c 50 -s 10 http://192.168.29.20/As a result, if the server takes longer than the specified time to respond, the request is aborted. In the above example, if any request takes longer than 10 seconds, ApacheBench aborts that request and continues with the rest.
Notably, the default timeout period is 30 seconds.
The -t option sets the maximum test duration (in seconds). Thus, ApacheBench keeps sending requests for the specified amount of time:
$ ab -t 300 -c 100 http://192.168.29.20/Consequently, the above test runs for 300 seconds.
However, the upper limit is set by -n 50000. So, if 50000 requests are served before the set timelimit, the test aborts.
In this case, we simulated a continuous load to see how well the server handles a sustained period of traffic.
Conveniently, we can save the output of a test to a file via the -g option:
$ ab -n 500 -c 50 -s 30 -g data.tsv http://192.168.29.20/As a result, we get a TSV (Tab-Separated Values) file data.tsv.
Next, we use the Gnuplot program to plot the given data.
Let’s create a file, plot.p, containing the plot script:
$ cat plot.p
# Set the output file type and name
set terminal png size 1024,768
set output 'response_time.png'
set title 'Apache Benchmark Result'
set xlabel 'Request Number'
set ylabel 'Time (ms)' # Plot the data
set grid
plot "data.tsv" using 9 with linespoints title 'ttime', "data.tsv" using 8 with points title 'dtime', "data.tsv" using 7 with lines title 'ctime'
Then, we run the Gnuplot program to generate the plot image:
$ gnuplot plot.pAs a result, we get a file response_time.png, showing the plot image:
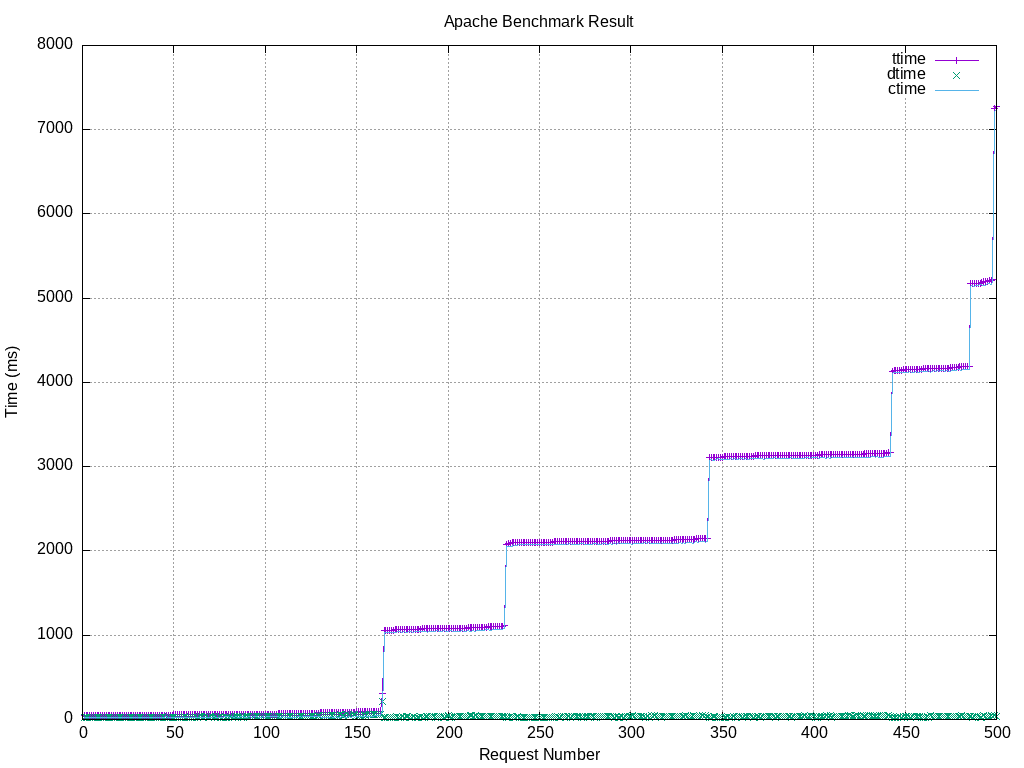
As a result, the above graph shows the ttime, dtime, and ctime using the output file.
While ApacheBench is a valuable tool, it has certain limitations:
These are some of the limitations of ApacheBench to check potential bottlenecks during benchmarking tests.
In this article, we saw how to use ApacheBench for load testing. First, we introduced the ApacheBench tool and the purpose of load testing. Then, we saw the installation of the tool. Further, we understood the meaning of some of the metrics.
In the practical section, we saw different use cases of the ApacheBench tool such as basic usage, parameter customization, benchmarking multiple URLs, and others.
Finally, we looked at the limitations associated with the tool.