

Mocking is an essential part of unit testing, and the Mockito library makes it easy to write clean and intuitive unit tests for your Java code.
Get started with mocking and improve your application tests using our Mockito guide:
Handling concurrency in an application can be a tricky process with many potential pitfalls. A solid grasp of the fundamentals will go a long way to help minimize these issues.
Get started with understanding multi-threaded applications with our Java Concurrency guide:
Spring 5 added support for reactive programming with the Spring WebFlux module, which has been improved upon ever since. Get started with the Reactor project basics and reactive programming in Spring Boot:
Since its introduction in Java 8, the Stream API has become a staple of Java development. The basic operations like iterating, filtering, mapping sequences of elements are deceptively simple to use.
But these can also be overused and fall into some common pitfalls.
To get a better understanding on how Streams work and how to combine them with other language features, check out our guide to Java Streams:
Explore Spring Boot 3 and Spring 6 in-depth through building a full REST API with the framework:
Yes, Spring Security can be complex, from the more advanced functionality within the Core to the deep OAuth support in the framework.
I built the security material as two full courses - Core and OAuth, to get practical with these more complex scenarios. We explore when and how to use each feature and code through it on the backing project.
You can explore the course here:
Spring Data JPA is a great way to handle the complexity of JPA with the powerful simplicity of Spring Boot.
Get started with Spring Data JPA through the guided reference course:
Refactor Java code safely — and automatically — with OpenRewrite.
Refactoring big codebases by hand is slow, risky, and easy to put off. That’s where OpenRewrite comes in. The open-source framework for large-scale, automated code transformations helps teams modernize safely and consistently.
Each month, the creators and maintainers of OpenRewrite at Moderne run live, hands-on training sessions — one for newcomers and one for experienced users. You’ll see how recipes work, how to apply them across projects, and how to modernize code with confidence.
Join the next session, bring your questions, and learn how to automate the kind of work that usually eats your sprint time.
1. Introduction
One of the core benefits of Java is the automated memory management with the help of the built-in Garbage Collector (or GC for short). The GC implicitly takes care of allocating and freeing up memory, and thus is capable of handling the majority of memory leak issues.
While the GC effectively handles a good portion of memory, it doesn’t guarantee a foolproof solution to memory leaking. The GC is pretty smart, but not flawless. Memory leaks can still sneak up, even in the applications of a conscientious developer.
There might still be situations where the application generates a substantial number of superfluous objects, thus depleting crucial memory resources, and sometimes resulting in the whole application’s failure.
Memory leaks are a genuine problem in Java. In this tutorial, we’ll learn what the potential causes of memory leaks are, how to recognize them at runtime, and how to deal with them in our application.
2. What Is a Memory Leak
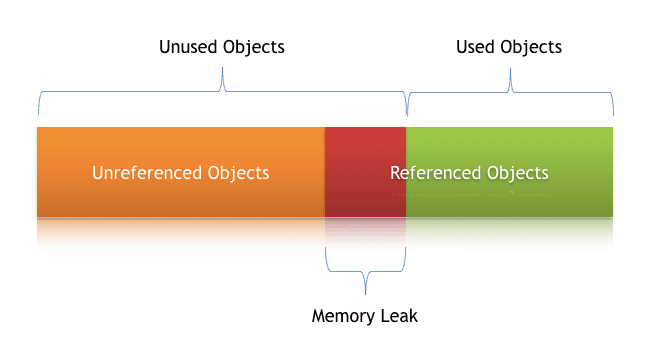
A Memory Leak is a situation where there are objects present in the heap that are no longer used, but the garbage collector is unable to remove them from memory, and therefore, they’re unnecessarily maintained.
A memory leak is bad because it blocks memory resources and degrades system performance over time. If not dealt with, the application will eventually exhaust its resources, finally terminating with a fatal java.lang.OutOfMemoryError.
There are two different types of objects that reside in Heap memory, referenced and unreferenced. Referenced objects are those that still have active references within the application, whereas unreferenced objects don’t have any active references.
The garbage collector removes unreferenced objects periodically, but it never collects the objects that are still being referenced. This is where memory leaks can occur:
Symptoms of a Memory Leak
- Severe performance degradation when the application is continuously running for a long time
- OutOfMemoryError heap error in the application
- Spontaneous and strange application crashes
- The application is occasionally running out of connection objects.
Let’s have a closer look at some of these scenarios and how to deal with them.
3. Types of Memory Leaks in Java
In any application, memory leaks can occur for numerous reasons. In this section, we’ll discuss the most common ones.
3.1. Memory Leak Through static Fields
The first scenario that can cause a potential memory leak is heavy use of static variables.
In Java, static fields have a life that usually matches the entire lifetime of the running application (unless ClassLoader becomes eligible for garbage collection).
Let’s create a simple Java program that populates a static List:
public class StaticFieldsMemoryLeakUnitTest {
public static List<Double> list = new ArrayList<>();
public void populateList() {
for (int i = 0; i < 10000000; i++) {
list.add(Math.random());
}
Log.info("Debug Point 2");
}
public static void main(String[] args) {
Log.info("Debug Point 1");
new StaticFieldsDemo().populateList();
Log.info("Debug Point 3");
}
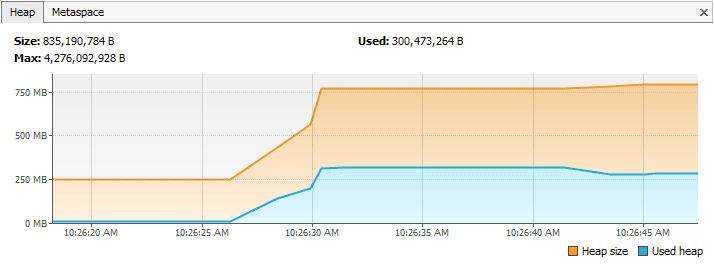
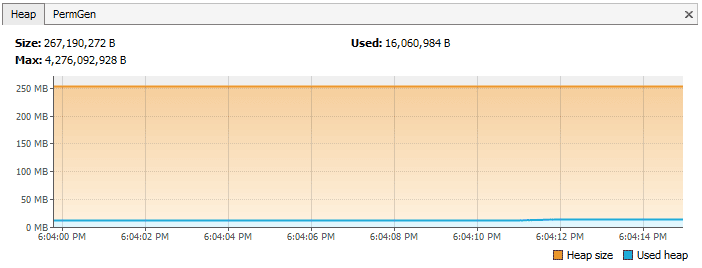
}If we analyze the Heap memory during this program execution, then we’ll see that between debug points 1 and 2, the heap memory increased as expected.
But when we leave the populateList() method at the debug point 3, the heap memory isn’t yet garbage collected, as we can see in this VisualVM response:
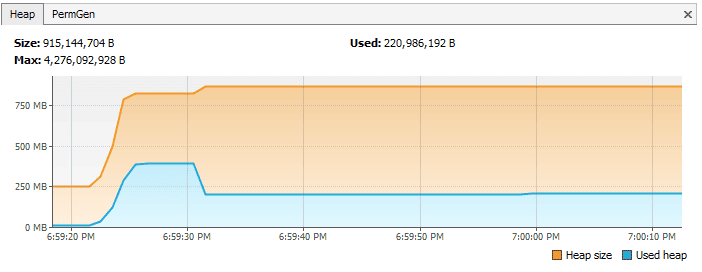
However, if we just drop the keyword static in line number 2 of the above program, then it’ll bring a drastic change to the memory usage, as shown in this Visual VM response:
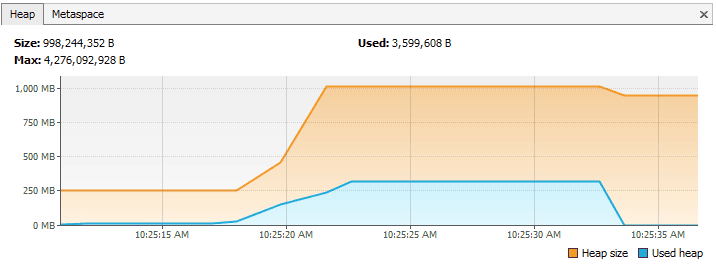
The first part until the debug point is almost the same as what we obtained in the case of static. But this time, after we leave the populateList() method, all the memory of the list is garbage collected because we don’t have any reference to it.
So we need to pay very close attention to our usage of static variables. If collections or large objects are declared as static, then they remain in the memory throughout the lifetime of the application, thus blocking vital memory that could otherwise be used elsewhere.
How to Prevent It?
- Minimize the use of static variables.
- When using singletons, rely upon an implementation that lazily loads the object, instead of eagerly loading.
3.2. Through Unclosed Resources
Whenever we make a new connection or open a stream, the JVM allocates memory for these resources. A few examples of this include database connections, input streams, and session objects.
Forgetting to close these resources can block the memory, thus keeping them out of the reach of the GC. This can even happen in case of an exception that prevents the program execution from reaching the statement that’s handling the code to close these resources.
In either case, the open connection left from the resources consumes memory, and if we don’t deal with them, they can deteriorate performance, and even result in an OutOfMemoryError.
How to Prevent It?
- Always use finally block to close resources.
- The code (even in the finally block) that closes the resources shouldn’t have any exceptions itself.
- When using Java 7+, we can make use of the try-with-resources block.
3.3. Improper equals() and hashCode() Implementations
When defining new classes, a very common oversight is not writing proper overridden methods for the equals() and hashCode() methods.
HashSet and HashMap use these methods in many operations, and if they’re not overridden correctly, they can become a source for potential memory leak problems.
Let’s take an example of a trivial Person class, and use it as a key in a HashMap:
public class Person {
    public String name;

    public Person(String name) {
        this.name = name;
    }
}
Now we’ll insert duplicate Person objects into a Map that uses this key.
Remember that a Map can’t contain duplicate keys:
@Test
public void givenMap_whenEqualsAndHashCodeNotOverridden_thenMemoryLeak() {
    Map<Person, Integer> map = new HashMap<>();
    for(int i=0; i<100; i++) {
        map.put(new Person("jon"), 1);
    }
    Assert.assertFalse(map.size() == 1);
}
Here we’re using Person as a key. Since Map doesn’t allow duplicate keys, the numerous duplicate Person objects that we inserted as a key shouldn’t increase the memory.
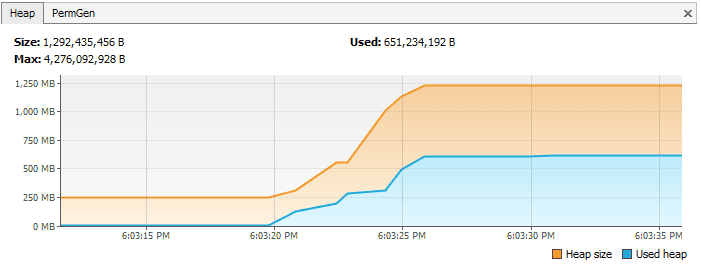
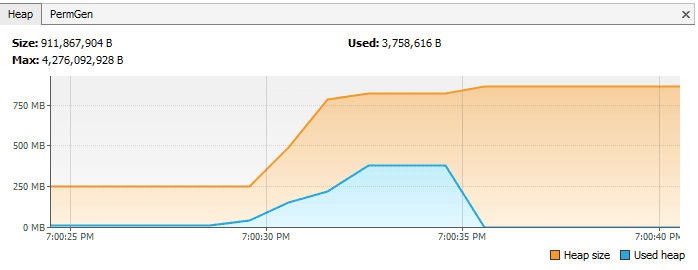
But since we haven’t defined the proper equals() method, the duplicate objects pile up and increase the memory, which is why we see more than one object in the memory. The Heap Memory in VisualVM for this looks like:
However, if we’d overridden the equals() and hashCode() methods properly, then only one Person object would exist in this Map.
Let’s take a look at the proper implementations of equals() and hashCode() for our Person class:
public class Person {
    public String name;

    public Person(String name) {
        this.name = name;
    }

    @Override
    public boolean equals(Object o) {
        if (o == this) return true;
        if (!(o instanceof Person)) {
            return false;
        }
        Person person = (Person) o;
        return person.name.equals(name);
    }

    @Override
    public int hashCode() {
        int result = 17;
        result = 31 * result + name.hashCode();
        return result;
    }
}
And in this case, the following assertions would be true:
@Test
public void givenMap_whenEqualsAndHashCodeNotOverridden_thenMemoryLeak() {
Map<Person, Integer> map = new HashMap<>();
for(int i=0; i<2; i++) {
map.put(new Person("jon"), 1);
}
Assert.assertTrue(map.size() == 1);
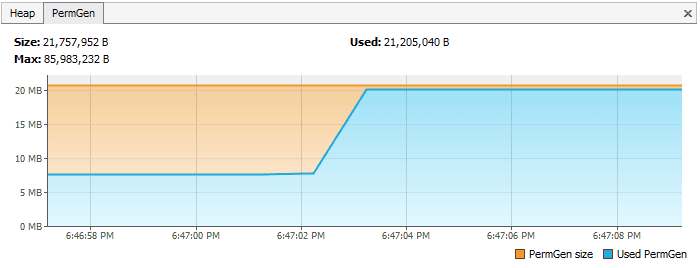
}After properly overriding equals() and hashCode(), the Heap Memory for the same program looks like:
Another option is using an ORM tool like Hibernate, which uses the equals() and hashCode() methods to analyze the objects and saves them in the cache.
The chance of memory leaks is quite high if these methods aren’t overridden because Hibernate wouldn’t be able to compare objects and would fill its cache with duplicate objects.
How to Prevent It?
- As a rule of thumb, when defining new entities, always override the equals() and hashCode() methods.
- It’s not enough to just override, these methods must be overridden in an optimal way as well.
For more information, visit our tutorials Generate equals() and hashCode() with Eclipse and Guide to hashCode() in Java.
3.4. Inner Classes That Reference Outer Classes
Every non-static inner class, including anonymous classes, automatically maintains a hidden reference to the instance of the class that created it. This reference is generated by the compiler and allows the inner class to access fields and methods of the enclosing class.
On its own, this behavior does not create a memory leak.
The Java garbage collector determines whether an object can be reclaimed based on reachability. If an object cannot be reached from any garbage collection (GC) root, it becomes eligible for collection, even if it participates in a circular reference. As a result, if both an outer object and its inner object are no longer reachable, they will be removed during garbage collection.
A problem appears only when an inner class instance is kept alive by something with a longer lifetime. Because the inner instance implicitly refers back to its enclosing object, retaining the inner object also prevents the outer object from being collected.
Let’s consider the following example:
public class Outer {
    private byte[] largeData = new byte[10_000_000];

    class Worker extends Thread {
        @Override
        public void run() {
            while (true) {
                // long-running task
            }
        }
    }

    public void start() {
        new Worker().start();
    }
}
In this scenario, the running thread acts as a GC root. As long as the thread is active, the Worker instance remains reachable. Since Worker is a non-static inner class, it implicitly holds a reference to the outer instance. Consequently, the Outer object, along with its large data array, cannot be reclaimed while the thread is running.
If the Worker class were declared as static, it would no longer carry a reference to the Outer instance. In that case, once the Outer object becomes otherwise unreachable, it could be garbage collected normally.
To prevent this issue, we should follow these practices:
- Make inner classes static when they do not require access to instance members of the enclosing class
- Avoid keeping inner class instances in static variables or other long-lived containers
- Be careful with threads, listeners, executors, and callback registrations
- Always clean up or unregister long-lived components when they are no longer needed.
The important takeaway is that non-static inner classes are not inherently dangerous. Memory retention occurs only when a long-lived reference to the inner object indirectly keeps the enclosing object alive.
3.5. Through finalize() Methods
Use of finalizers is yet another source of potential memory leak issues. Whenever a class’ finalize() method is overridden, then objects of that class aren’t instantly garbage collected. Instead, the GC queues them for finalization, which occurs at a later point in time.
Additionally, if the code written in the finalize() method isn’t optimal, and if the finalizer queue can’t keep up with the Java garbage collector, then sooner or later our application is destined to meet an OutOfMemoryError.
To demonstrate this, let’s imagine that we have a class for which we’ve overridden the finalize() method, and that the method takes a little bit of time to execute. When a large number of objects of this class get garbage collected, it looks like this in VisualVM:
However, if we just remove the overridden finalize() method, then the same program gives the following response:
How to Prevent It?
- We should always avoid finalizers.
For more detail about finalize(), we can refer to section 3 (Avoiding Finalizers) in our Guide to the finalize Method in Java.
3.6. Interned Strings
The Java String pool went through a major change in Java 7 when it was transferred from PermGen to HeapSpace. However, for applications operating on version 6 and below, we need to be more attentive when working with large Strings.
If we read a massive String object, and call intern() on that object, it goes to the string pool, which is located in PermGen (permanent memory), and will stay there as long as our application runs. This blocks the memory and creates a major memory leak in our application.
The PermGen for this case in JVM 1.6 looks like this in VisualVM:
In contrast, if we just read a string from a file in a method, and don’t intern it, then the PermGen looks like:
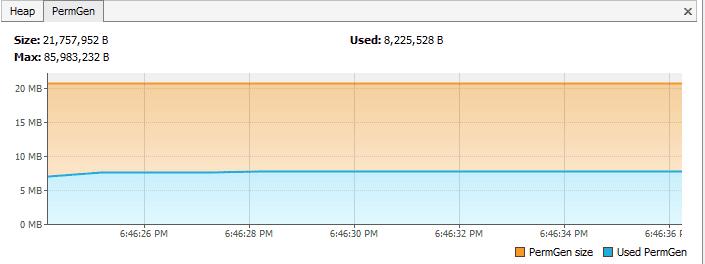
How to Prevent It?
- The simplest way to resolve this issue is by upgrading to the latest Java version, as String pool moved to HeapSpace starting with Java version 7.
- If we’re working on large Strings, we can increase the size of the PermGen space to avoid any potential OutOfMemoryErrors:
-XX:MaxPermSize=512m
3.7. Using ThreadLocals
ThreadLocal (discussed in detail in the Introduction to ThreadLocal in Java tutorial) is a construct that gives us the ability to isolate state to a particular thread, and thus allows us to achieve thread safety.
When using this construct, each thread will hold an implicit reference to its copy of a ThreadLocal variable and will maintain its own copy, instead of sharing the resource across multiple threads, as long as the thread is alive.
Despite its advantages, the use of ThreadLocal variables is controversial, as they’re infamous for introducing memory leaks if not used properly. Joshua Bloch once commented on thread local usage that:
“Sloppy use of thread pools in combination with sloppy use of thread locals can cause unintended object retention, as has been noted in many places. But placing the blame on thread locals is unwarranted.”
Memory Leaks with ThreadLocals
ThreadLocals are supposed to be garbage collected once the holding thread is no longer alive. But the problem arises when we use ThreadLocals along with modern application servers.
Modern application servers use a pool of threads to process requests, instead of creating new ones (for example, the Executor in the case of Apache Tomcat). Moreover, they also use a separate classloader.
Since Thread Pools in application servers work on the concept of thread reuse, they’re never garbage collected; instead, they’re reused to serve another request.
If any class creates a ThreadLocal variable, but doesn’t explicitly remove it, then a copy of that object will remain with the worker Thread even after the web application is stopped, thus preventing the object from being garbage collected.
How to Prevent It?
- It’s good practice to clean-up ThreadLocals when we’re no longer using them. ThreadLocals provide the remove() method, which removes the current thread’s value for this variable.
- Don’t use ThreadLocal.set(null) to clear the value. It doesn’t actually clear the value, but will instead look up the Map associated with the current thread and set the key-value pair as the current thread and null, respectively.
- It’s best to consider ThreadLocal a resource that we need to close in a finally block, even in the case of an exception::
try {
    threadLocal.set(System.nanoTime());
    //... further processing
}
finally {
    threadLocal.remove();
}
4. Other Strategies for Dealing With Memory Leaks
Although there’s no one-size-fits-all solution when dealing with memory leaks, there are some ways by which we can minimize these leaks.
4.1. Enable Profiling
Java profilers are tools that monitor and diagnose the memory leaks through the application. They analyze what’s going on internally in our application, like how we allocate memory.
Using profilers, we can compare different approaches and find areas where we can optimally use our resources.
Throughout section 3 of this tutorial, we used Java VisualVM. Please check out our Guide to Java Profilers to learn about different types of profilers, like Mission Control, JProfiler, YourKit, Java VisualVM, and the Netbeans Profiler.
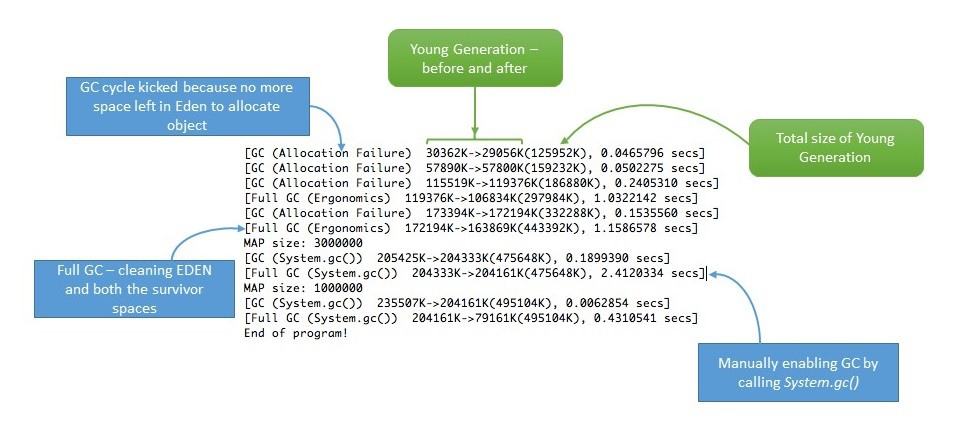
4.2. Verbose Garbage Collection
By enabling verbose garbage collection, we can track the detailed trace of the GC. To enable this, we need to add the following to our JVM configuration:
-verbose:gcBy adding this parameter, we can see the details of what’s happening inside the GC:
4.3. Use Reference Objects to Avoid Memory Leaks
We can also resort to reference objects in Java that come built-in with the java.lang.ref package to deal with memory leaks. Using the java.lang.ref package, instead of directly referencing objects, we use special references to objects that allow them to be easily garbage collected.
Reference queues make us aware of the actions the Garbage Collector performs. For more information, we can read the Soft References in Java tutorial, specifically section 4.
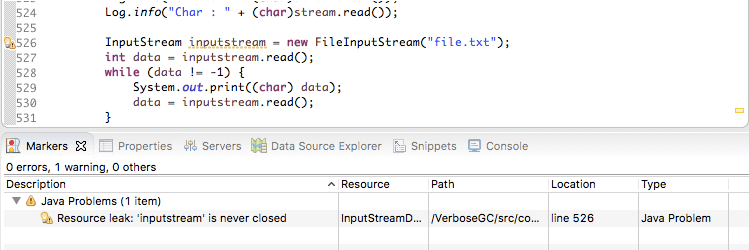
4.4. Eclipse Memory Leak Warnings
For projects on JDK 1.5 and above, Eclipse shows warnings and errors whenever it encounters obvious cases of memory leaks. So when developing in Eclipse, we can regularly visit the “Problems” tab and be more vigilant about memory leak warnings (if any):
4.5. Benchmarking
We can measure and analyze the Java code’s performance by executing benchmarks. This way, we can compare the performance of alternative approaches to do the same task. This can help us choose the best approach, and may help us conserve memory.
For more information about benchmarking, please head over to our Microbenchmarking with Java tutorial.
4.6. Code Reviews
Finally, we always have the classic, old-school way of doing a simple code walk-through.
In some cases, even this trivial looking method can help in eliminating some common memory leak problems.
5. Conclusion
In layman’s terms, we can think of a memory leak as a disease that degrades our application’s performance by blocking vital memory resources. And like all other diseases, if not cured, it can result in fatal application crashes over time.
Memory leaks are tricky to solve, and finding them requires intricate mastery and command over the Java language. While dealing with memory leaks, there’s no one-size-fits-all solution, as leaks can occur through a wide range of diverse events.
However, if we resort to best practices and regularly perform rigorous code walk-throughs and profiling, we can minimize the risk of memory leaks in our application.


