

Mocking is an essential part of unit testing, and the Mockito library makes it easy to write clean and intuitive unit tests for your Java code.
Get started with mocking and improve your application tests using our Mockito guide:
Handling concurrency in an application can be a tricky process with many potential pitfalls. A solid grasp of the fundamentals will go a long way to help minimize these issues.
Get started with understanding multi-threaded applications with our Java Concurrency guide:
Spring 5 added support for reactive programming with the Spring WebFlux module, which has been improved upon ever since. Get started with the Reactor project basics and reactive programming in Spring Boot:
Since its introduction in Java 8, the Stream API has become a staple of Java development. The basic operations like iterating, filtering, mapping sequences of elements are deceptively simple to use.
But these can also be overused and fall into some common pitfalls.
To get a better understanding on how Streams work and how to combine them with other language features, check out our guide to Java Streams:
Explore Spring Boot 3 and Spring 6 in-depth through building a full REST API with the framework:
Yes, Spring Security can be complex, from the more advanced functionality within the Core to the deep OAuth support in the framework.
I built the security material as two full courses - Core and OAuth, to get practical with these more complex scenarios. We explore when and how to use each feature and code through it on the backing project.
You can explore the course here:
Spring Data JPA is a great way to handle the complexity of JPA with the powerful simplicity of Spring Boot.
Get started with Spring Data JPA through the guided reference course:
Refactor Java code safely — and automatically — with OpenRewrite.
Refactoring big codebases by hand is slow, risky, and easy to put off. That’s where OpenRewrite comes in. The open-source framework for large-scale, automated code transformations helps teams modernize safely and consistently.
Each month, the creators and maintainers of OpenRewrite at Moderne run live, hands-on training sessions — one for newcomers and one for experienced users. You’ll see how recipes work, how to apply them across projects, and how to modernize code with confidence.
Join the next session, bring your questions, and learn how to automate the kind of work that usually eats your sprint time.
Yes, we're now running our only Summer Sale. All Courses are 30% off until 20th July, 2026:
Yes, we're now running our only Summer Sale. All Courses are 30% off until 20th July, 2026:
1. Overview
Using a Java application, we sometimes face issues with memory consumption. In general, we can categorize all problems into those based on heap memory usage and those based on non-heap memory usage.
In this article, we’ll review different tools that we can use to monitor non-heap memory utilization.
2. Using jcmd
jcmd is a JDK tool we can use to send diagnostic and troubleshooting commands to a running Java process. We utilize it to inspect system properties, trigger garbage collection, dump heap and thread information, and manage JIT compilation.
To monitor non-heap memory using jcmd, we need to enable native memory tracking. Then we can call jcmd to get the memory process information:
jcmd <pid> VM.native_memory
In the response, we can analyze all the non-heap sections we need:
-                        GC (reserved=359872KB, committed=70440KB)
                            (malloc=17792KB #582)
                            (mmap: reserved=342080KB, committed=52648KB)

-                  Compiler (reserved=168KB, committed=168KB)
                            (malloc=4KB #29)
                            (arena=165KB #5)

-                  Internal (reserved=221KB, committed=221KB)
                            (malloc=157KB #1202)
                            (mmap: reserved=64KB, committed=64KB)

-                     Other (reserved=4KB, committed=4KB)
                            (malloc=4KB #2)

-                    Symbol (reserved=1217KB, committed=1217KB)
                            (malloc=857KB #3546)
                            (arena=360KB #1)

-    Native Memory Tracking (reserved=141KB, committed=141KB)
                            (malloc=5KB #69)
                            (tracking overhead=136KB)

//shorten
In the output, we can see the heap memory consumption as well as the consumption of all non-heap memory types. The committed property indicates the consumption at the moment of the jcmd call.
3. Using jconsole
jconsole is a monitoring tool that complies with the JMX specification. We can use jconsole to monitor and manage Java applications in real-time in cases when we have access only to the JDK.
Jconsole provides a graphical interface to track memory usage, thread activity, CPU consumption, and MBeans. The tool connects to local or remote JVMs, helping us diagnose performance issues and optimize application behavior.
To run jconsole, we run the following command from the JDK bin folder:
<JDK_PATH>\bin\jconsoleOn the first screen, we select the local or remote process we want to connect to:
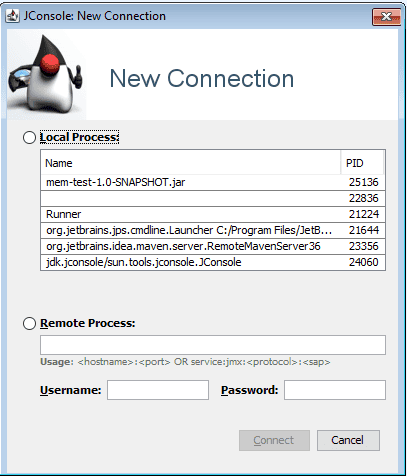
On the Memory tab, we select the Non-Heap Memory Usage chart. After that, we’re able to see the graph of the non-heap usage:

4. VisualVM
VisualVM is another visual tool that provides JVM monitoring capabilities. We use VisualVM to monitor CPU load, memory usage, thread activity, and heap dumps. VisualVM also supports analyzing thread dumps and profiling method execution to identify performance bottlenecks.
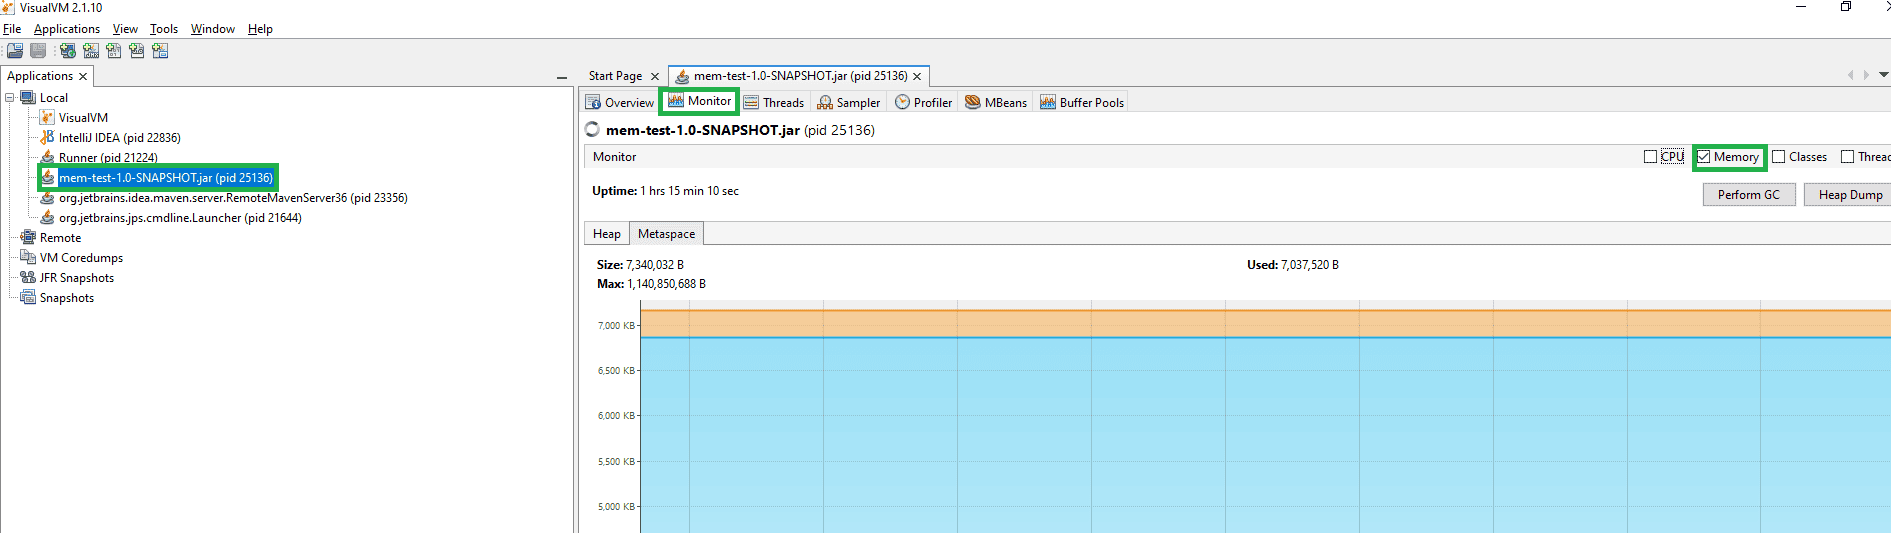
4.1. Monitor MetaSpace in Basic Monitor
In the basic VisualVM setup, we’re able to monitor the metaspace size using the Monitor tab:
To monitor other non-heap sections, we can install additional VisualVM plugins.
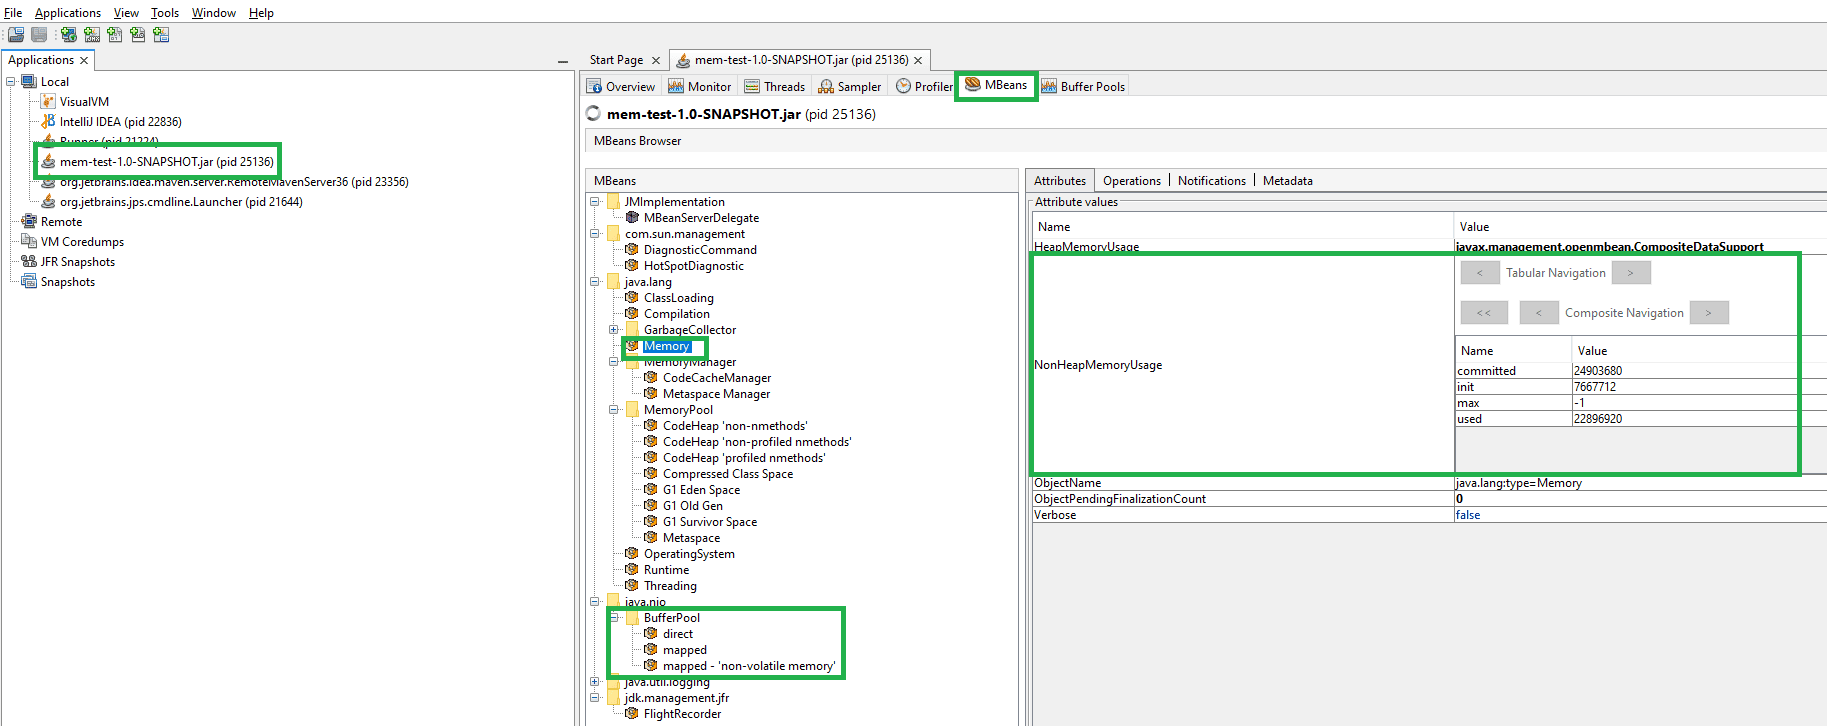
4.2. Monitor Non-heap Memory Using Mbeans Plugin
By adding the MBeans VisualVM plugin, we’ll see the new MBeans tab. On this tab, we can view the current non-heap memory usage in general and for specific memory sections in particular:
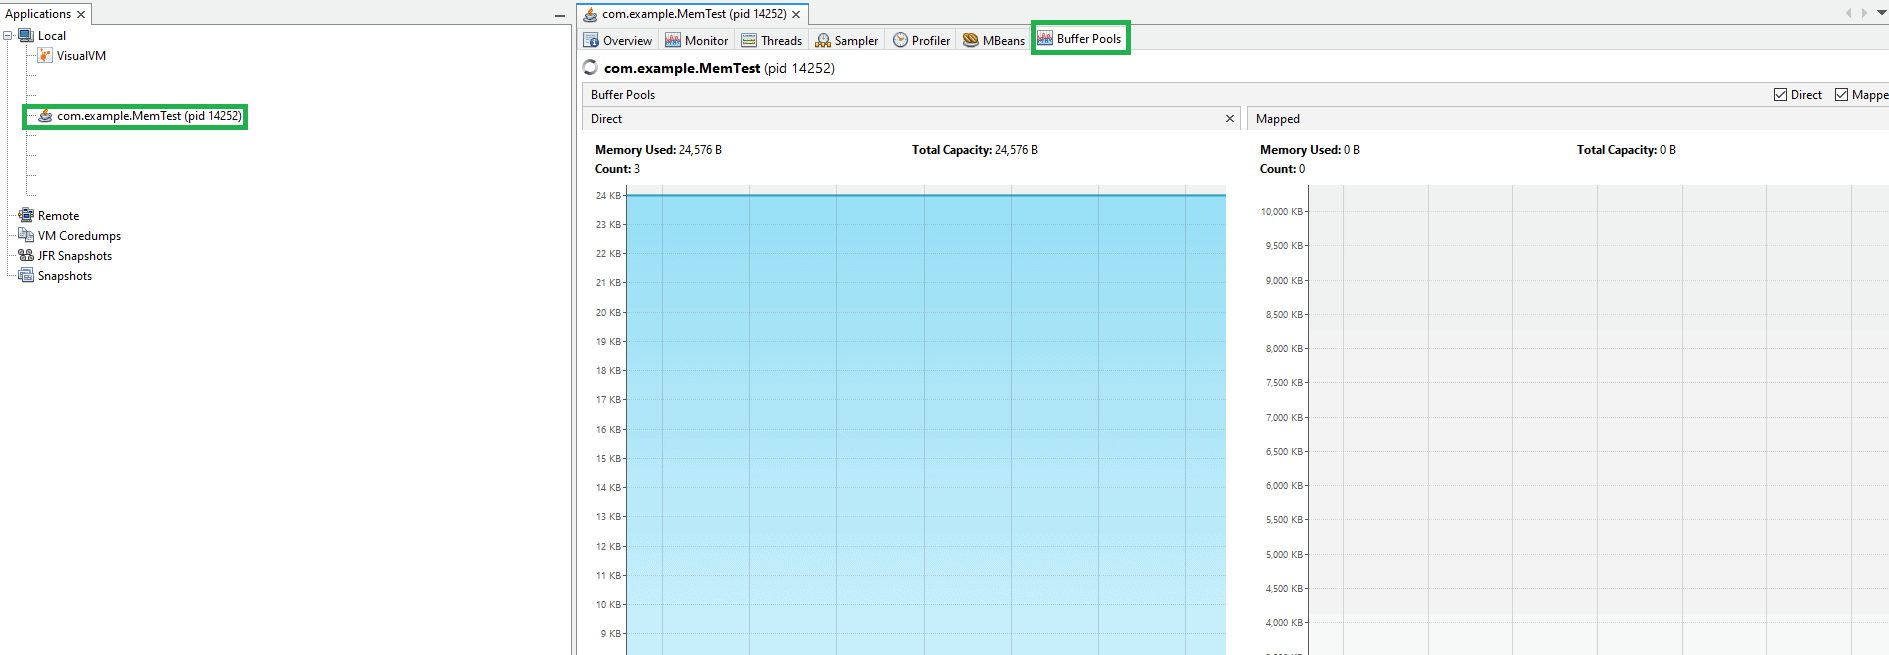
4.3. Monitor Direct Buffers Using Buffer Pools Plugin
Additionally, we can use the Buffer Monitor VisualVM plugin. After the installation we’ll see the new Buffer Pools tab, where we can view the current direct buffer memory and memory-mapped files usage:
5. Java Mission Control
Java Mission Control is one more visual tool that provides JVM monitoring and diagnostics capabilities. We utilize JMC to analyze application performance, monitor memory usage, inspect thread activity, and review garbage collection behavior.
JMC also supports profiling method executions and analyzing flight recordings to identify performance bottlenecks.
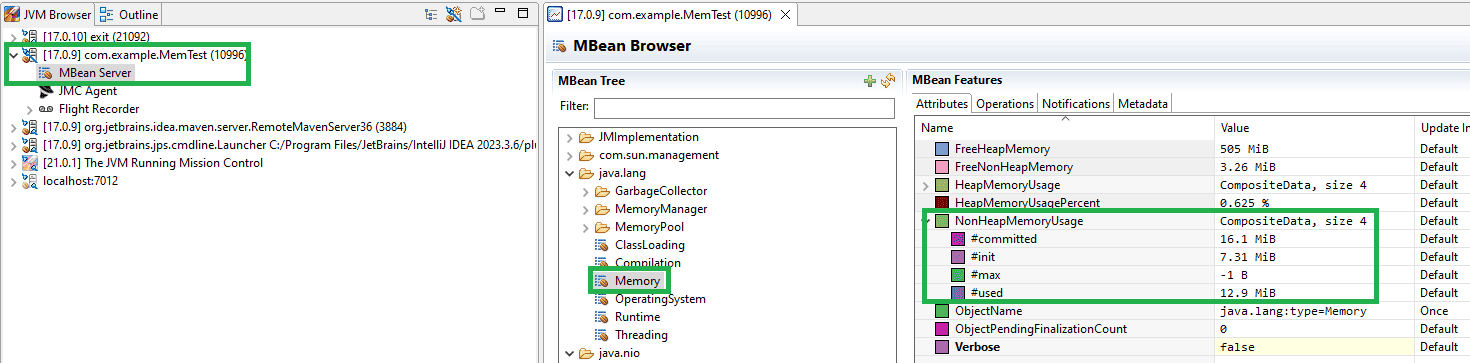
5.1. Non-Heap Memory Usage Using MBean Browser
Let’s connect to our application using the MBean Server. On the MBeans Browser tab, we can find the total utilization of non-heap memory. However, we should be aware that this number doesn’t include direct buffer memory consumption:
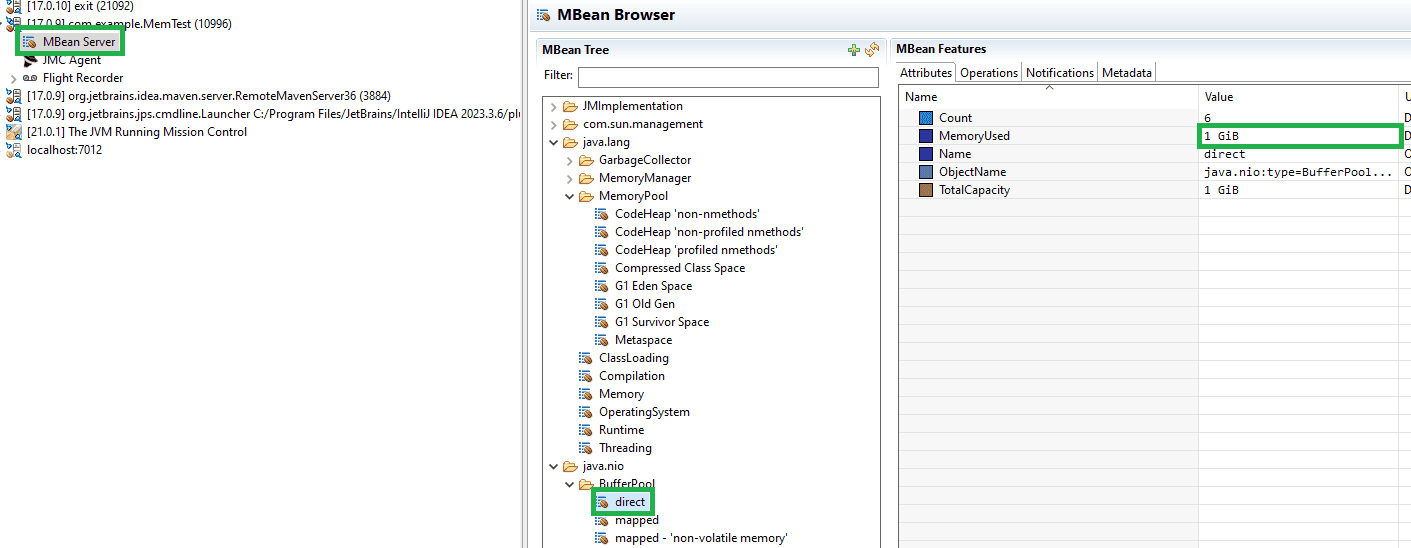
If we select the section under the BufferPool group, we can find the usage of direct pool memory:
5.2. Native Memory Tracking Using JFR Records
Since Java 20, we’re also able to record the Native Memory Tracking data continuously with JFR. Using the next command, we can prepare a flight recorder file with the needed events tracked:
java -XX:NativeMemoryTracking=detail -XX:StartFlightRecording=name=Profiling,filename=nmt-recording.jfr,settings=profile -jar path/ourapp.jarThen, we can open this file using Java Mission Control:
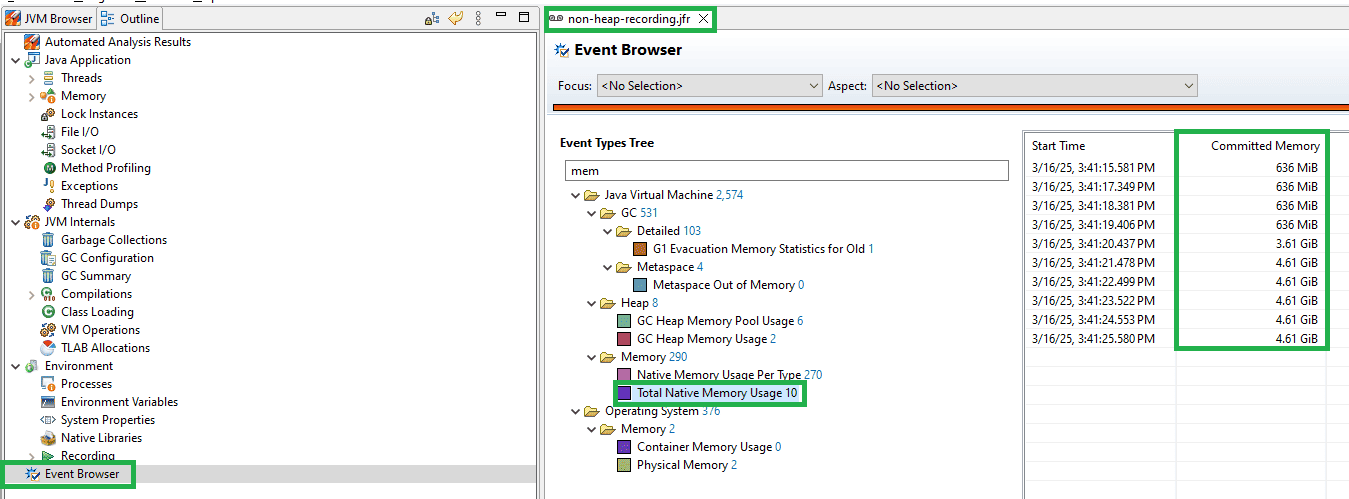
On the Event Browser tab of the recording, we can find the Event Types Tree. Inside it, we can find the Total Native Memory Usage event. If we select it, the right side of the screen displays the total amount of committed memory. This number includes both heap and non-heap memory consumption.
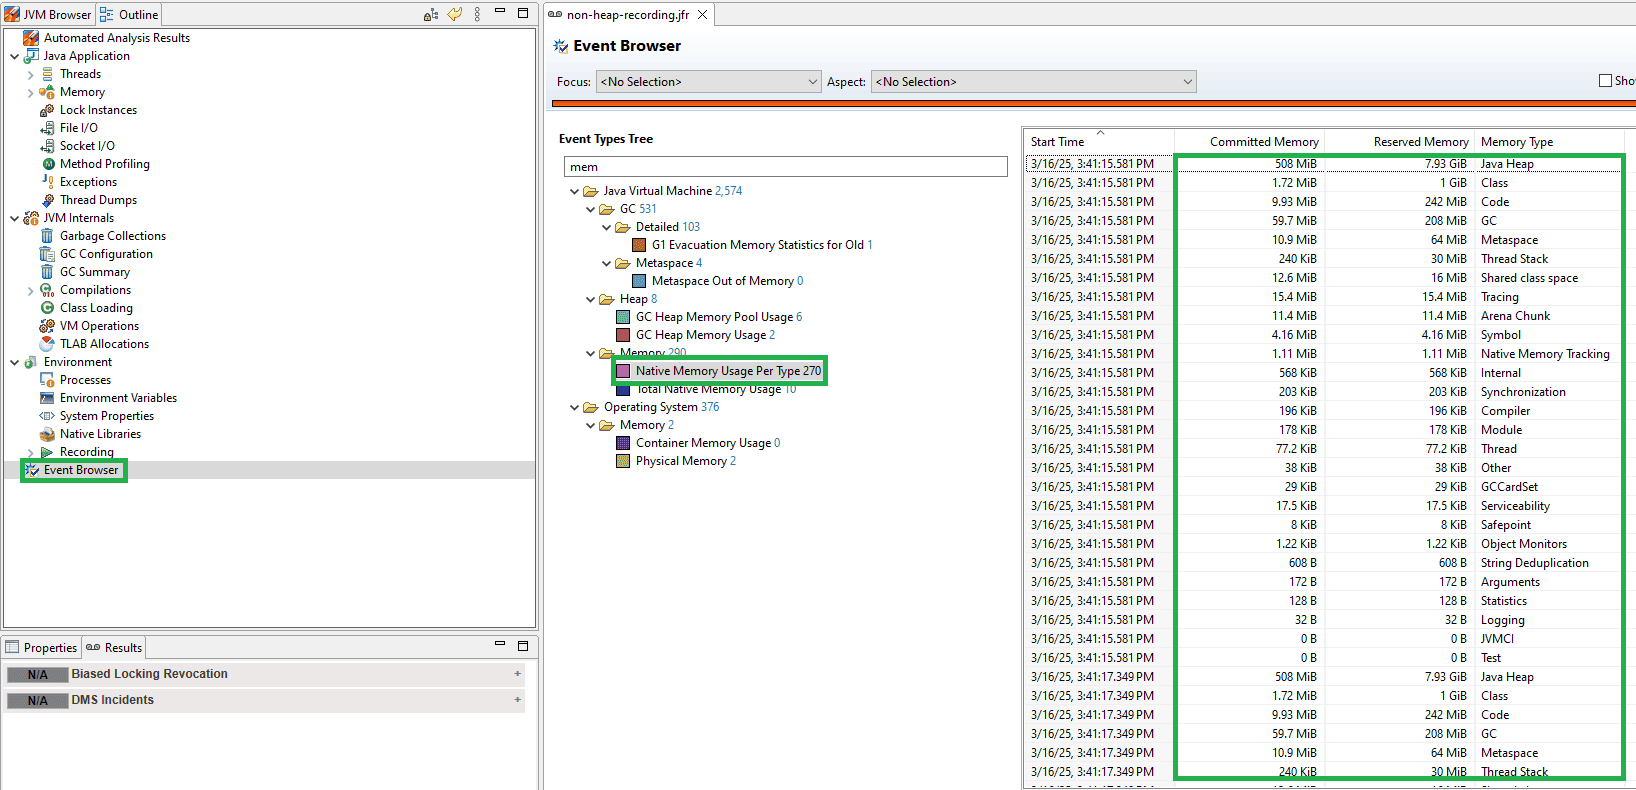
Additionally, we can choose the Native Memory Usage Per Type event. In this case, we see a breakdown of the consumption for all non-heap memory types:
6. JMX-DExporter
JMX-DExporter is a tool that exposes JMX metrics in a format compatible with Prometheus. We can use JMX-DExporter to collect JVM metrics such as memory usage, thread activity, garbage collection statistics, and more.
6.1. Metrics Endpoint Usage
To start using JMX-DExporter, first of all, we need to download the agent JAR. Then, we configure our exporter using jmx_exporter_config.yml:
startDelaySeconds: 0
lowercaseOutputName: true
lowercaseOutputLabelNames: true

rules:
  - pattern: "java.lang:type=Memory"
    name: "jvm_memory_usage_bytes"
    labels:
      area: "$2"
    type: GAUGE
In this example, we’ve configured the java.lang:type=Memory pattern. This means we want to export the MemoryMXBean data to our metrics endpoint. Now, we’re able to start our application with the JMX-DExporter attached to it:
java -javaagent:.path-to-agent-jar\jmx_prometheus_javaagent.jar=port:path-to-agent-jar\jmx_exporter_config.yml -jar .path-to-app\app.jarIn the start command, we specify the path to the downloaded agent JAR and the port on which the new metrics endpoint will be available. For this purpose, we use the javaagent parameter. Additionally, we specify the path to the configuration file and the JAR file of our application.
Now, if we call the http://localhost:port/metrics endpoint, we see the complete information provided by the memory MBean, including the non-heap memory usage data:
//shorten
jvm_memory_committed_bytes{area="nonheap"} 1.8546688E7
# HELP jvm_memory_init_bytes Initial bytes of a given JVM memory area.
# TYPE jvm_memory_init_bytes gauge
jvm_memory_init_bytes{area="heap"} 5.32676608E8
jvm_memory_init_bytes{area="nonheap"} 7667712.0
# HELP jvm_memory_max_bytes Max (bytes) of a given JVM memory area.
# TYPE jvm_memory_max_bytes gauge
jvm_memory_max_bytes{area="heap"} 8.518631424E9
jvm_memory_max_bytes{area="nonheap"} -1.0
//shorten
6.2. Integration With Prometheus
Prometheus is an open-source monitoring and alerting toolkit that we use to collect and store metrics as time series data. We can easily integrate our metrics endpoint with Prometheus.
After installing the Prometheus instance, we modify the prometheus.yml file with the following values:
scrape_configs:
  - job_name: "our_app"
    static_configs:
      - targets: ["localhost:port"]
In the job_name property, we specify how our Prometheus target will be named. In the targets property, we specify the host and port of our metrics endpoint.
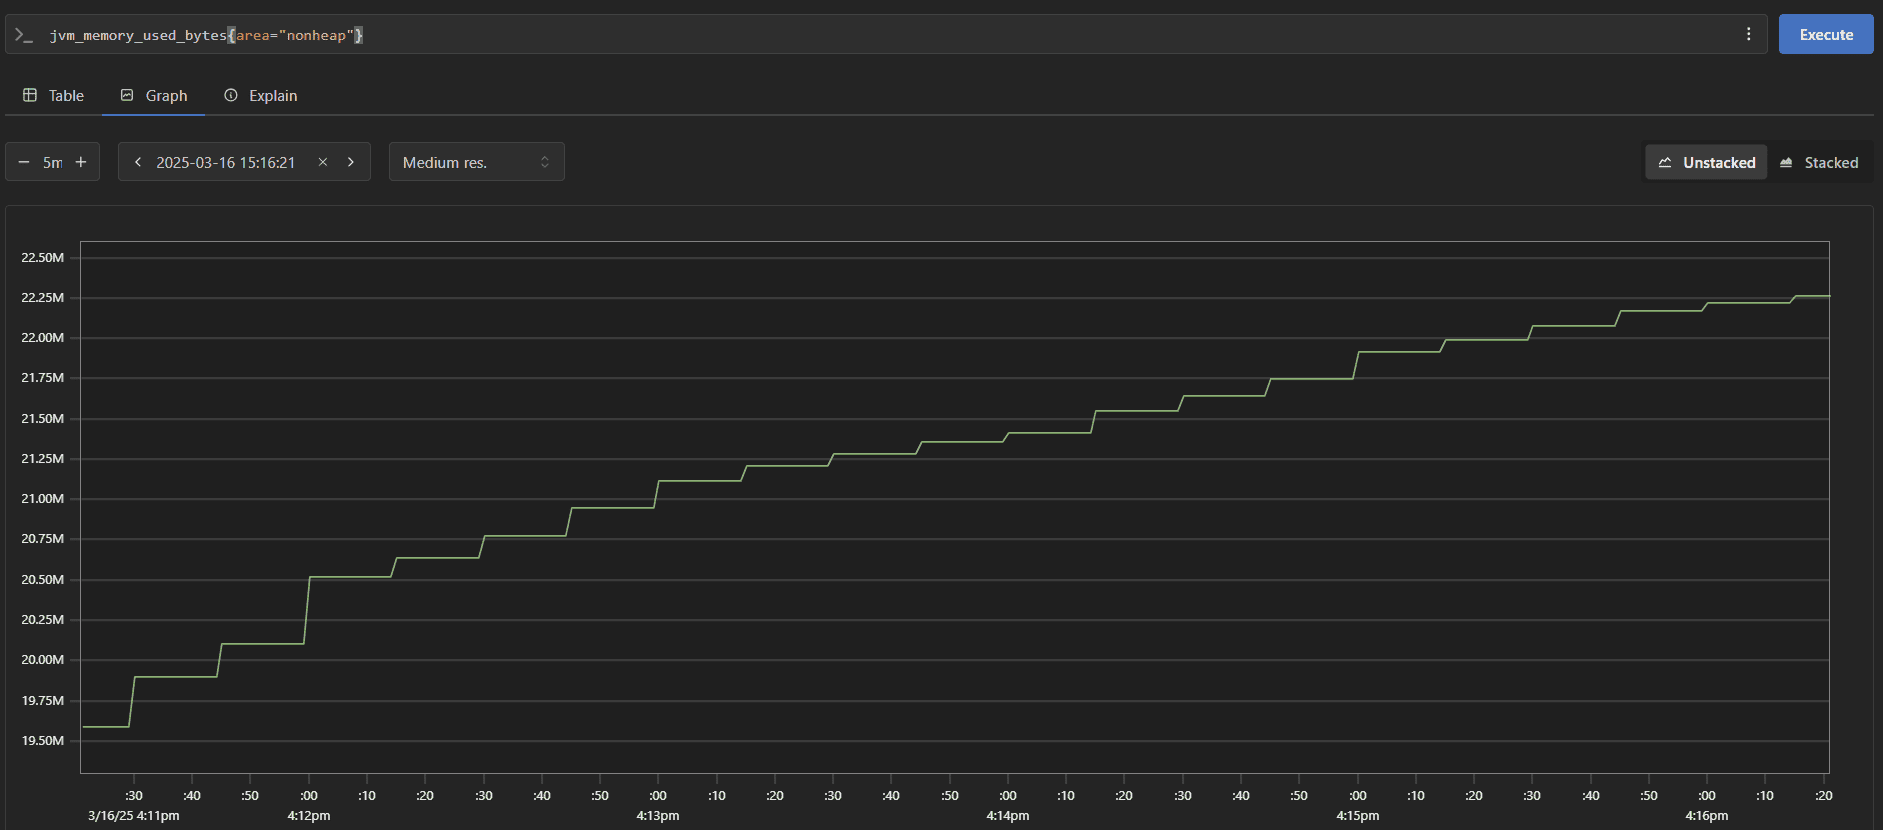
After making the configuration changes, we need to restart the Prometheus instance and open the console. In the input field, we can type any available metric, including the non-heap usage. After this, the memory metric graph will be shown on the screen:
7. Conclusion
In this tutorial, we reviewed a set of tools that help us monitor non-heap memory usage.
For simple cases, when we don’t need a detailed report and have access to the JDK, we can consider basic tools like directly using jcmd or the jconsole. For more complex cases, where detailed insights into specific memory types are needed, we can use flight recording and JMC.
To integrate our monitoring into Prometheus metrics, we can use the JMX-Exporter agent. The additional resource consumption of all monitoring tools should be taken into account in each specific case.


