

Mocking is an essential part of unit testing, and the Mockito library makes it easy to write clean and intuitive unit tests for your Java code.
Get started with mocking and improve your application tests using our Mockito guide:
Handling concurrency in an application can be a tricky process with many potential pitfalls. A solid grasp of the fundamentals will go a long way to help minimize these issues.
Get started with understanding multi-threaded applications with our Java Concurrency guide:
Spring 5 added support for reactive programming with the Spring WebFlux module, which has been improved upon ever since. Get started with the Reactor project basics and reactive programming in Spring Boot:
Since its introduction in Java 8, the Stream API has become a staple of Java development. The basic operations like iterating, filtering, mapping sequences of elements are deceptively simple to use.
But these can also be overused and fall into some common pitfalls.
To get a better understanding on how Streams work and how to combine them with other language features, check out our guide to Java Streams:
Explore Spring Boot 3 and Spring 6 in-depth through building a full REST API with the framework:
Yes, Spring Security can be complex, from the more advanced functionality within the Core to the deep OAuth support in the framework.
I built the security material as two full courses - Core and OAuth, to get practical with these more complex scenarios. We explore when and how to use each feature and code through it on the backing project.
You can explore the course here:
Spring Data JPA is a great way to handle the complexity of JPA with the powerful simplicity of Spring Boot.
Get started with Spring Data JPA through the guided reference course:
Refactor Java code safely — and automatically — with OpenRewrite.
Refactoring big codebases by hand is slow, risky, and easy to put off. That’s where OpenRewrite comes in. The open-source framework for large-scale, automated code transformations helps teams modernize safely and consistently.
Each month, the creators and maintainers of OpenRewrite at Moderne run live, hands-on training sessions — one for newcomers and one for experienced users. You’ll see how recipes work, how to apply them across projects, and how to modernize code with confidence.
Join the next session, bring your questions, and learn how to automate the kind of work that usually eats your sprint time.
Yes, we're now running our only Summer Sale. All Courses are 30% off until 20th July, 2026:
Yes, we're now running our only Summer Sale. All Courses are 30% off until 20th July, 2026:
1. Introduction
Java Flight Recorder (JFR) is a profiling and diagnostic tool that monitors the JVM and the programs that run on it. It’s a handy profiling tool developers use to monitor the state and performance of their applications.
This tutorial will focus on the new view command introduced in Java 21 for JFR.
2. Java Flight Recorder (JFR)
The Java Flight Recorder (JFR) is a low-overhead application profiling framework introduced in Java 7 as an experimental feature. It allowed us to analyze and understand important metrics about our programs, such as garbage collection patterns, IO operations, memory allocations, and more.
2.1. What Is the Java Flight Recorder?
JFR collects information about the events in the JVM when a Java application runs and we analyze the results with diagnostic tools.
JFR monitors the application and records the analysis in a recording file. There are two ways for us to instruct the JFR to monitor an application:
- Use the command line to start the application and enable JFR.
- Use a diagnostic tool such as jcmd on an already running Java application.
The recording is typically generated as a .jfr file, which can then be analyzed by visual tools such as the Java Mission Control (JMC) tool or using the new view command as we’ll see in the upcoming sections.
2.2. Recording From the Command Line
To demonstrate a flight recording, let’s write a small program that inserts an object into an ArrayList until an OutOfMemoryError is thrown:
void insertToList(List<Object> list) {
    try {
        while (true) {
            list.add(new Object());
        }
    } catch (OutOfMemoryError e) {
        System.out.println("Out of Memory. Exiting");
    }
}
Let’s compile the program using the standard javac compiler:
javac -d out -sourcepath JFRExample.javaOnce the .class file is generated, we start the flight recorder. We pass some additional arguments to the java command, namely the -XX:+FlightRecorder option, along with some additional parameters to set the recording duration and the output file path where the recording will be stored:
java -XX:StartFlightRecording=duration=200s,filename=flight.jfr -cp ./out/ com.baeldung.jfrview.JFRExampleOur program now runs with JFR enabled to capture the events and other system properties, and JFR writes the results into the flight.jfr file.
2.3. Recording Using the jcmd Tool
The jcmd diagnostic tool provides an alternative way to record and analyze the performance of our applications and JVM. We can register diagnostic events to a running virtual machine using this tool.
To use the jcmd tool, we need our application to be running and we must know the pid:
jcmd <pid|MainClass> <command> [parameters]Several commands that the jcmd tool recognizes are:
- JFR.start – starts a new JFR recording
- JFR.check – checks running JFR recording(s)
- JFR.stop – stops a specific JFR recording
- JFR.dump – copies contents of a JFR recording to file
Each of these commands requires additional parameters.
Let’s create a recording using the jcmd tool now. We need to start the application and find the pid of the running process. Once we have the pid, we start the recording:
jcmd 128263 JFR.start filename=recording.jfrWe can stop the recording when we’ve captured the relevant events:
jcmd 128263 JFR.stop filename=recording.jfr3. Viewing the JFR Recording File
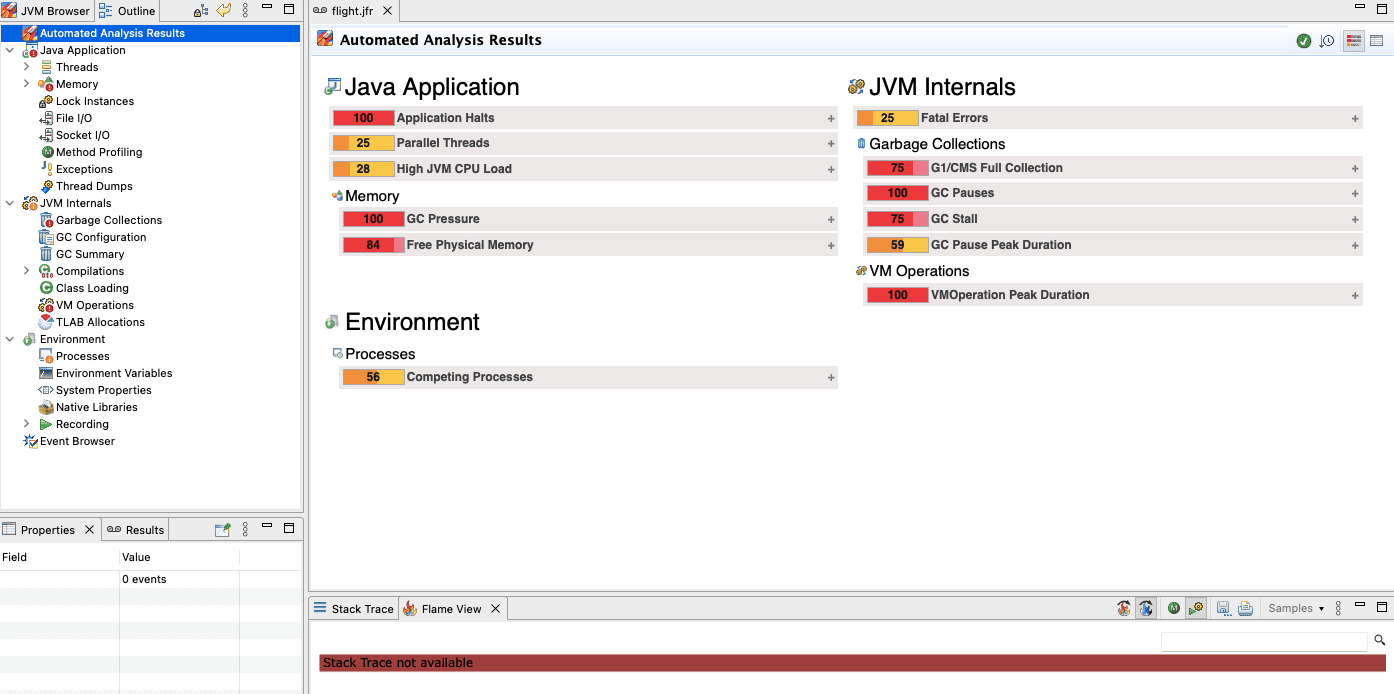
To view and understand the results of the jfr file, we can use the Java Mission Control (JMC) tool. The JMC tool comes with numerous functionalities to profile and monitor Java applications, including a diagnostic tool that reads JFR files and shows a visual representation of the result:
4. The jfr Command
The jfr command parses and prints flight recording files (.jfr) to standard output. While we previously used the Mission Control tool for visual representation, the jfr command provides us with a way to filter, summarize, and generate human-readable output from flight recording files in the console.
4.1. Using the jfr Command
The jfr command resides in the bin path of the $JAVA_HOME. Let’s look at its syntax:
$JAVA_HOME/bin/jfr [command] <path>
In the following sections, we’ll be accessing jfr directly.
4.2. jfr Commands
jfr previously had five commands namely print, summary, metadata, assemble, and disassemble. The view command is the sixth jfr command that has been introduced.
The print command is used to print the contents of the flight recording and it takes several parameters including the output format(json/xml etc), a range of filters which might include categories, events, and the stack depth:
jfr print [--xml|--json] [--categories <filters>] [--events <filters>] [--stack-depth <depth>] <file>The summary command as the name suggests generates a summary of the recording that includes the events that occurred, disk space utility etc:
jfr summary <file>The metadata command generates detailed information about the events such as their names and categories:
jfr metadata <file>Finally, the assemble and disassemble commands are for assembling chunk files into a recording file and vice-versa:
jfr assemble <repository> <file>
jfr disassemble [--max-chunks <chunks>] [--output <directory>] <file>
4.3. Example of a jfr Command
Now we’ll look at an example jfr command and generate the summary of our JFR file:
$JAVA_HOME/bin/jfr summary recording.jfr

 Version: 2.1
 Chunks: 1
 Start: 2023-12-25 17:07:08 (UTC)
 Duration: 1 s

 Event Type                              Count  Size (bytes)
=============================================================
 jdk.NativeLibrary                         512         44522
 jdk.SystemProcess                         511         49553
 jdk.ModuleExport                          506          4921
 jdk.BooleanFlag                           495         15060
 jdk.ActiveSetting                         359         10376
 jdk.GCPhaseParallel                       162          4033
5. The view Command in JDK 21
Java 21 introduced the view command to facilitate the analysis of JFR recordings from the command line. This new view command eliminates the use of dumping recording downloads into the JMC tool and comes with more than 70 prebuilt options. These options, which are likely to increase over time, cover almost all important aspects of the application including the JVM, the application itself, and the environment of the application.
5.1. Categories of View Options
We can broadly classify the different view options into three categories which are similar to the ones displayed in the JMC tool:
- Java Virtual Machine Views
- Environment Views
- Application Views
5.2. JVM Views
Java Virtual Machine views give insights into the JVM attributes such as heap space, garbage collection, native memory, and other compiler-related metrics. Some common JVM views include:
- class-modifications
- gc-concurrent-phases
- compiler-configuration
- gc-configuration
- native-memory-committed
- gc-cpu-time
- compiler-statistics
- gc-pause-phases
- heap-configuration
5.3. Environment Views
Environment views show information about the host system where the JVM is running such as CPU information, network utilization, system properties, process, and information. Some common Environment views are:
- cpu-information
- cpu-load
- jvm-flags
- container-configuration
- network-utilization
- system-processes
- system-properties
5.4. Application Views
Application views provide insights into our application code such as information regarding its thread usage, object statistics, and memory utilization. Some common Application views include:
- exception-count
- object-statistics
- allocation-by-thread
- memory-leaks-by-class
- thread-cpu-load
- thread-count
- thread-allocation
5.5. Command Structure of view
The view command expects a view name and the path to the recording file along with relevant parameters. It can be activated using the jfr command and the jcmd command:
jfr view [view] <recording file>jcmd <pid> JFR.view [view name]The output is then displayed on the command line, or any standard output. Additionally, the commands provide customization capabilities on the output format, time ranges, and custom views.
6. JFR view Command Usage
In this section, we’ll use the view command with some of the views mentioned in the previous section to analyze the JFR recording file we generated earlier.
6.1. Using the jfr Command
Let’s apply the gc-configuration JVM view on our flight recording using the jfr command and capture the output:
jfr view gc-configuration flight.jfrGC Configuration
----------------
Young GC: G1New
Old GC: G1Old
Parallel GC Threads: 4
Concurrent GC Threads: 1
Dynamic GC Threads: true
Concurrent Explicit GC: false
Disable Explicit GC: false
Pause Target: N/A
GC Time Ratio: 12The view, as its name suggests generates information about the GC type being used and other relevant data on garbage collection.
6.2. Using the jcmd Tool
We can use the view command with the jcmd tool as well:
jcmd <pid> JFR.view [view name]The jcmd tool requires a running pid to diagnose and we’ll request the Environment view system-processes:
jcmd 37417 JFR.view cell-height=3 truncate=beginning width=80 system-processesSystem Processes First Observed Last Observed PID Command Line -------------- ------------- ---- ------------------------------------------------------------------------------------- 23:21:26 23:21:26 453 /Applications/Flycut.app/Contents/MacOS/Flycut 23:21:26 23:21:26 780 /Applications/Grammarly Desktop.app/Contents/Library/LaunchAgents/Grammarly Deskto... 23:21:26 23:21:26 455 /Applications/Grammarly Desktop.app/Contents/MacOS/Grammarly Desktop 23:21:26 23:21:26 431 /Applications/JetBrains Toolbox.app/Contents/MacOS/jetbrains-toolbox 23:21:26 23:21:26 624 /Applications/Safari.app/Contents/MacOS/Safari
6.3. Formatting the view Command Output
We can play with the output of the view command and adjust it according to our needs. The view command currently provides several options to format the output, including modifying the number of columns and rows, and other options such as a verbose flag and output truncation:
--width [number-of-columns]
--cell-height [number of rows]
--verbose [the query that makes up the view]
--truncate [--beginning|--end] [truncate content from beginning or end]
As an example, let’s format the output of the system processes view that we generated above in such a way that each row has two lines and also make the response verbose:
jfr view --cell-height 2 --width 100 --truncate beginning --verbose system-processes flight.jfr

                                          System Processes

First Observed Last Observed PID   Command Line
(startTime)    (startTime)   (pid) (commandLine)
-------------- ------------- ----- ----------------------------------------------------------------
23:33:47       23:33:47      453   /Applications/Flycut.app/Contents/MacOS/Flycut
23:33:47       23:33:47      780   ...ions/Grammarly Desktop.app/Contents/Library/LaunchAgents/Gram
                                   marly Desktop Helper.app/Contents/MacOS/Grammarly Desktop Helper
23:33:47       23:33:47      455   /Applications/Grammarly Desktop.app/Contents/MacOS/Grammarly Des
                                   ktop
23:33:47       23:33:47      431   /Applications/JetBrains Toolbox.app/Contents/MacOS/jetbrains-too
                                   lbox
23:33:47       23:33:47      624   /Applications/Safari.app/Contents/MacOS/Safari


COLUMN 'First Observed', 'Last Observed', 'PID', 'Command Line' SELECT FIRST(startTime),
LAST(startTime), FIRST(pid), FIRST(commandLine) FROM SystemProcess GROUP BY pid

Execution: query-validation=10.6 ms, aggregation=241 ms, formatting=121 ms
As we can see, the verbose command generates more information about the system processes including some meta information such as an explanation of the query and execution statistics to see how long it took.
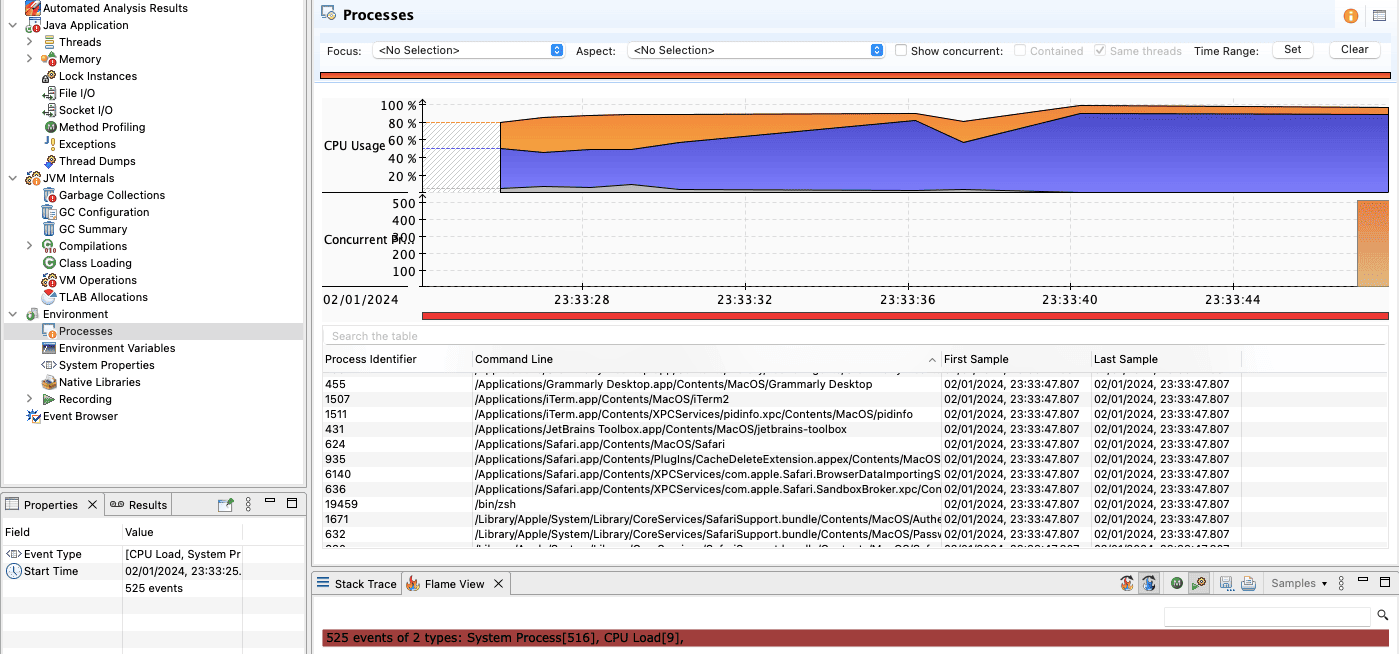
6.4. Comparing the Result With JCM
The JFR view Command is an attempt to make the process of analyzing JFR recordings easier and independent of any additional tool. The JMC visual output and the console-based output of the view command are quite similar. We can compare the result of the system-processes view with that of the visual JMC tool:
7. Conclusion
In this article, we looked at the newly added JFR view command that assists in displaying the results of the Java flight recordings directly in the command line with a set of predefined views. We saw the different categories of views available today and the ways we can generate a view for our flight recordings.


