

Mocking is an essential part of unit testing, and the Mockito library makes it easy to write clean and intuitive unit tests for your Java code.
Get started with mocking and improve your application tests using our Mockito guide:
Handling concurrency in an application can be a tricky process with many potential pitfalls. A solid grasp of the fundamentals will go a long way to help minimize these issues.
Get started with understanding multi-threaded applications with our Java Concurrency guide:
Spring 5 added support for reactive programming with the Spring WebFlux module, which has been improved upon ever since. Get started with the Reactor project basics and reactive programming in Spring Boot:
Since its introduction in Java 8, the Stream API has become a staple of Java development. The basic operations like iterating, filtering, mapping sequences of elements are deceptively simple to use.
But these can also be overused and fall into some common pitfalls.
To get a better understanding on how Streams work and how to combine them with other language features, check out our guide to Java Streams:
Explore Spring Boot 3 and Spring 6 in-depth through building a full REST API with the framework:
Yes, Spring Security can be complex, from the more advanced functionality within the Core to the deep OAuth support in the framework.
I built the security material as two full courses - Core and OAuth, to get practical with these more complex scenarios. We explore when and how to use each feature and code through it on the backing project.
You can explore the course here:
Spring Data JPA is a great way to handle the complexity of JPA with the powerful simplicity of Spring Boot.
Get started with Spring Data JPA through the guided reference course:
Refactor Java code safely — and automatically — with OpenRewrite.
Refactoring big codebases by hand is slow, risky, and easy to put off. That’s where OpenRewrite comes in. The open-source framework for large-scale, automated code transformations helps teams modernize safely and consistently.
Each month, the creators and maintainers of OpenRewrite at Moderne run live, hands-on training sessions — one for newcomers and one for experienced users. You’ll see how recipes work, how to apply them across projects, and how to modernize code with confidence.
Join the next session, bring your questions, and learn how to automate the kind of work that usually eats your sprint time.
1. Overview
Java Sampling Profilers are usually designed using the JVM Tool Interface (JVMTI) and collect stack traces at a safepoint. Therefore, these sampling profilers can suffer from the safepoint bias problem.
For a holistic view of the application, we need a sampling profiler that doesn’t require threads to be at safepoints and can collect the stack traces at any time to avoid the safepoint bias problem.
In this tutorial, we’ll explore async-profiler along with various profiling techniques it offers.
2. async-profiler
async-profiler is a sampling profiler for any JDK based on the HotSpot JVM. It has low overhead and doesn’t rely on JVMTI.
It avoids the safepoint bias problem by using the AsyncGetCallTrace API provided by HotSpot JVM to profile the Java code paths, and Linux’s perf_events to profile the native code paths.
In other words, the profiler matches call stacks of both Java code and native code paths to produce accurate results.
3. Setup
3.1. Installation
First, we’ll download the latest release of async-profiler based on our platform. Currently, it supports Linux and macOS platforms only.
Once downloaded, we can check if it’s working on our platform:
$ ./profiler.sh --versionAsync-profiler 1.7.1 built on May 14 2020
Copyright 2016-2020 Andrei PanginIt’s always a good idea to check all the options available with async-profiler beforehand:
$ ./profiler.shUsage: ./profiler.sh [action] [options]
Actions:
start start profiling and return immediately
resume resume profiling without resetting collected data
stop stop profiling
check check if the specified profiling event is available
status print profiling status
list list profiling events supported by the target JVM
collect collect profile for the specified period of time
and then stop (default action)
Options:
-e event profiling event: cpu|alloc|lock|cache-misses etc.
-d duration run profiling for seconds
-f filename dump output to
-i interval sampling interval in nanoseconds
-j jstackdepth maximum Java stack depth
-b bufsize frame buffer size
-t profile different threads separately
-s simple class names instead of FQN
-g print method signatures
-a annotate Java method names
-o fmt output format: summary|traces|flat|collapsed|svg|tree|jfr
-I include output only stack traces containing the specified pattern
-X exclude exclude stack traces with the specified pattern
-v, --version display version string
--title string SVG title
--width px SVG width
--height px SVG frame height
--minwidth px skip frames smaller than px
--reverse generate stack-reversed FlameGraph / Call tree
--all-kernel only include kernel-mode events
--all-user only include user-mode events
--cstack mode how to traverse C stack: fp|lbr|no
is a numeric process ID of the target JVM
or 'jps' keyword to find running JVM automaticallyMany of the shown options will come handy in the later sections.
3.2. Kernel Configuration
When using async-profiler on the Linux platform, we should make sure to configure our kernel to capture call stacks using the perf_events by all users:
First, we’ll set the perf_event_paranoid to 1, which will allow the profiler to collect performance information:
$ sudo sh -c 'echo 1 >/proc/sys/kernel/perf_event_paranoid'Then, we’ll set the kptr_restrict to 0 to remove the restrictions on exposing kernel addresses:
$ sudo sh -c 'echo 0 >/proc/sys/kernel/kptr_restrict'However, the async-profiler will work by itself on the macOS platform.
Now that our platform is ready, we can build our profiling application and run it using the Java command:
$ java -XX:+UnlockDiagnosticVMOptions -XX:+DebugNonSafepoints -jar path-to-jar-fileHere, we’ve started our profiling app using the -XX:+UnlockDiagnosticVMOptions -XX:+DebugNonSafepoints JVM flags that are highly recommended for accurate results.
Now that we’re ready to profile our application, let’s explore various types of profiling supported by the async-profiler.
4. CPU Profiling
Async-profiler collects sample stack traces of Java methods, including JVM code, native class, and kernel functions, when profiling CPU.
Let’s profile our application using its PID:
$ ./profiler.sh -e cpu -d 30 -o summary 66959
Started [cpu] profiling
--- Execution profile ---
Total samples       : 28

Frame buffer usage  : 0.069%
Here, we’ve defined the cpu profiling event by using the -e option. Then, we used the -d <duration> option to collect the sample for 30 seconds.
Last, the -o option is useful to define the output format like summary, HTML, traces, SVG, and tree.
Let’s create the HTML output while CPU profiling our application:
$ ./profiler.sh -e cpu -d 30 -f cpu_profile.html 66959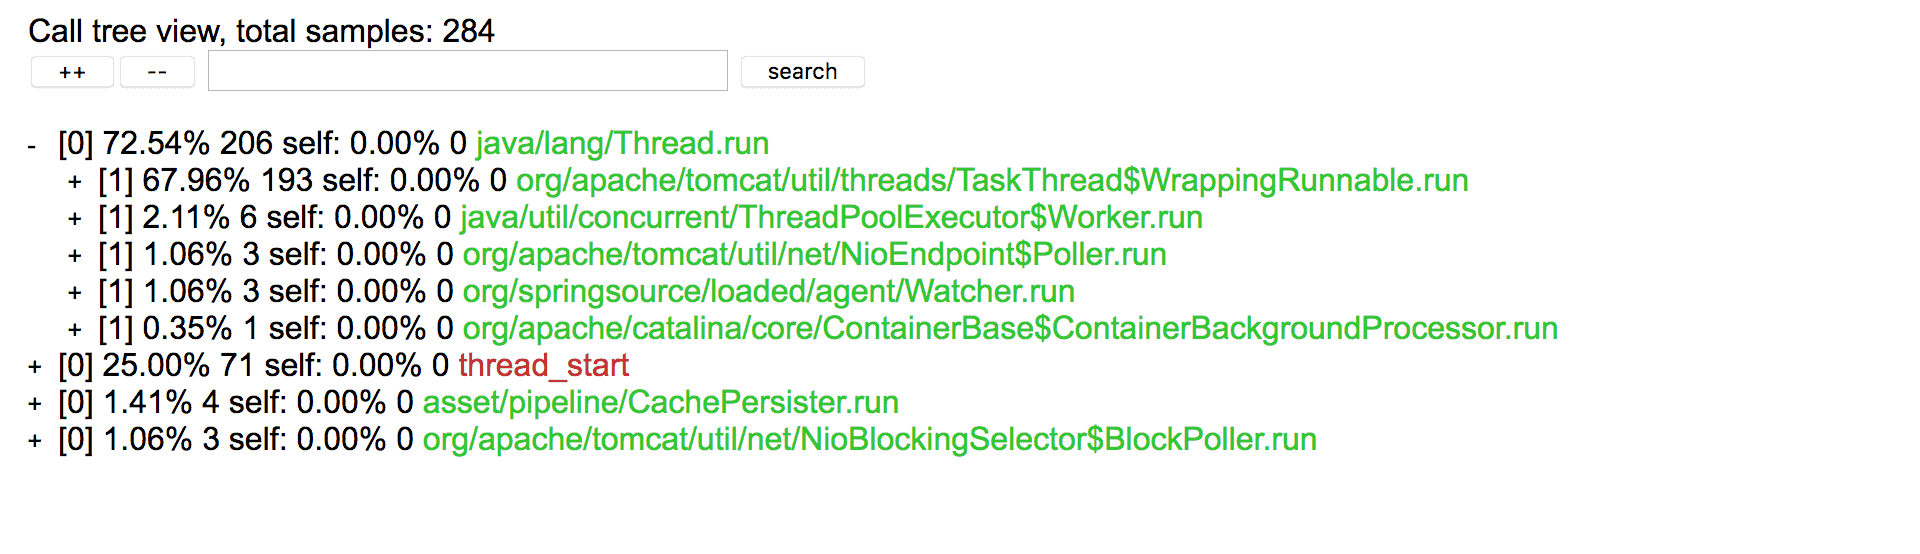
Here, we can see the HTML output allows us to expand, collapse, and search the samples.
Additionally, async-profiler supports flame graphs out-of-the-box.
Let’s generate a flame graph by using the .svg file extension for the CPU profile of our application:
$ ./profiler.sh -e cpu -d 30 -f cpu_profile.svg 66959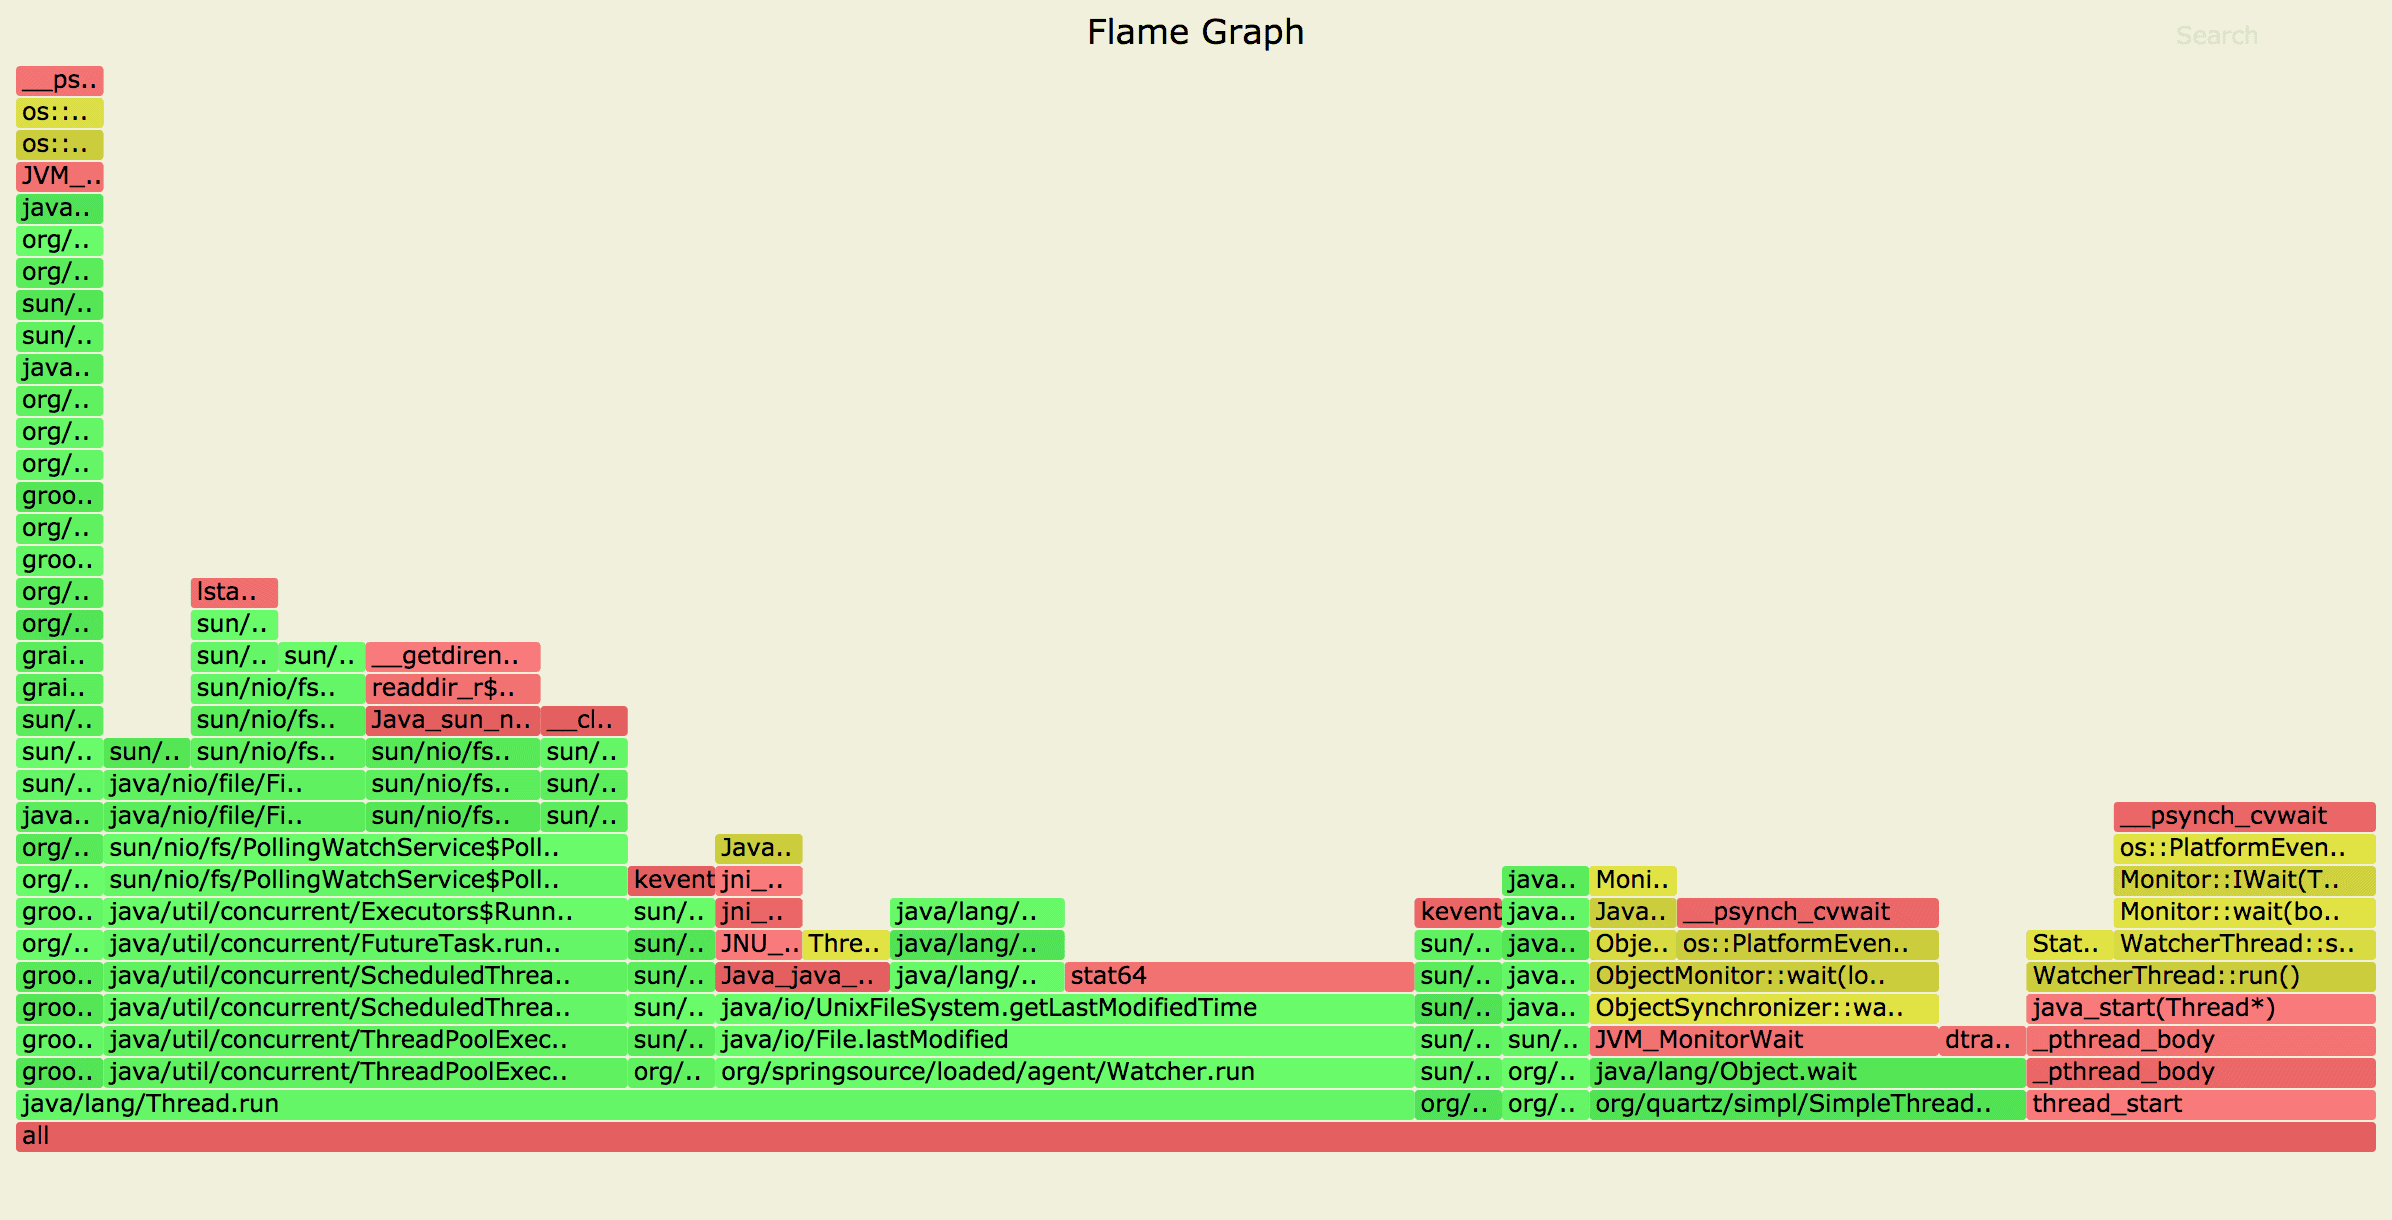
Here, the resulting flame graph shows Java code paths in green, C++ in yellow, and system code paths in red.
5. Allocation Profiling
Similarly, we can collect samples of memory allocation without using an intrusive technique like bytecode instrumentation.
async-profiler uses the TLAB (Thread Local Allocation Buffer) based sampling technique to collect the samples of the heap allocation above the average size of TLAB.
By using the alloc event, we can enable the profiler to collect heap allocations of our profiling application:
$ ./profiler.sh -e alloc -d 30 -f alloc_profile.svg 66255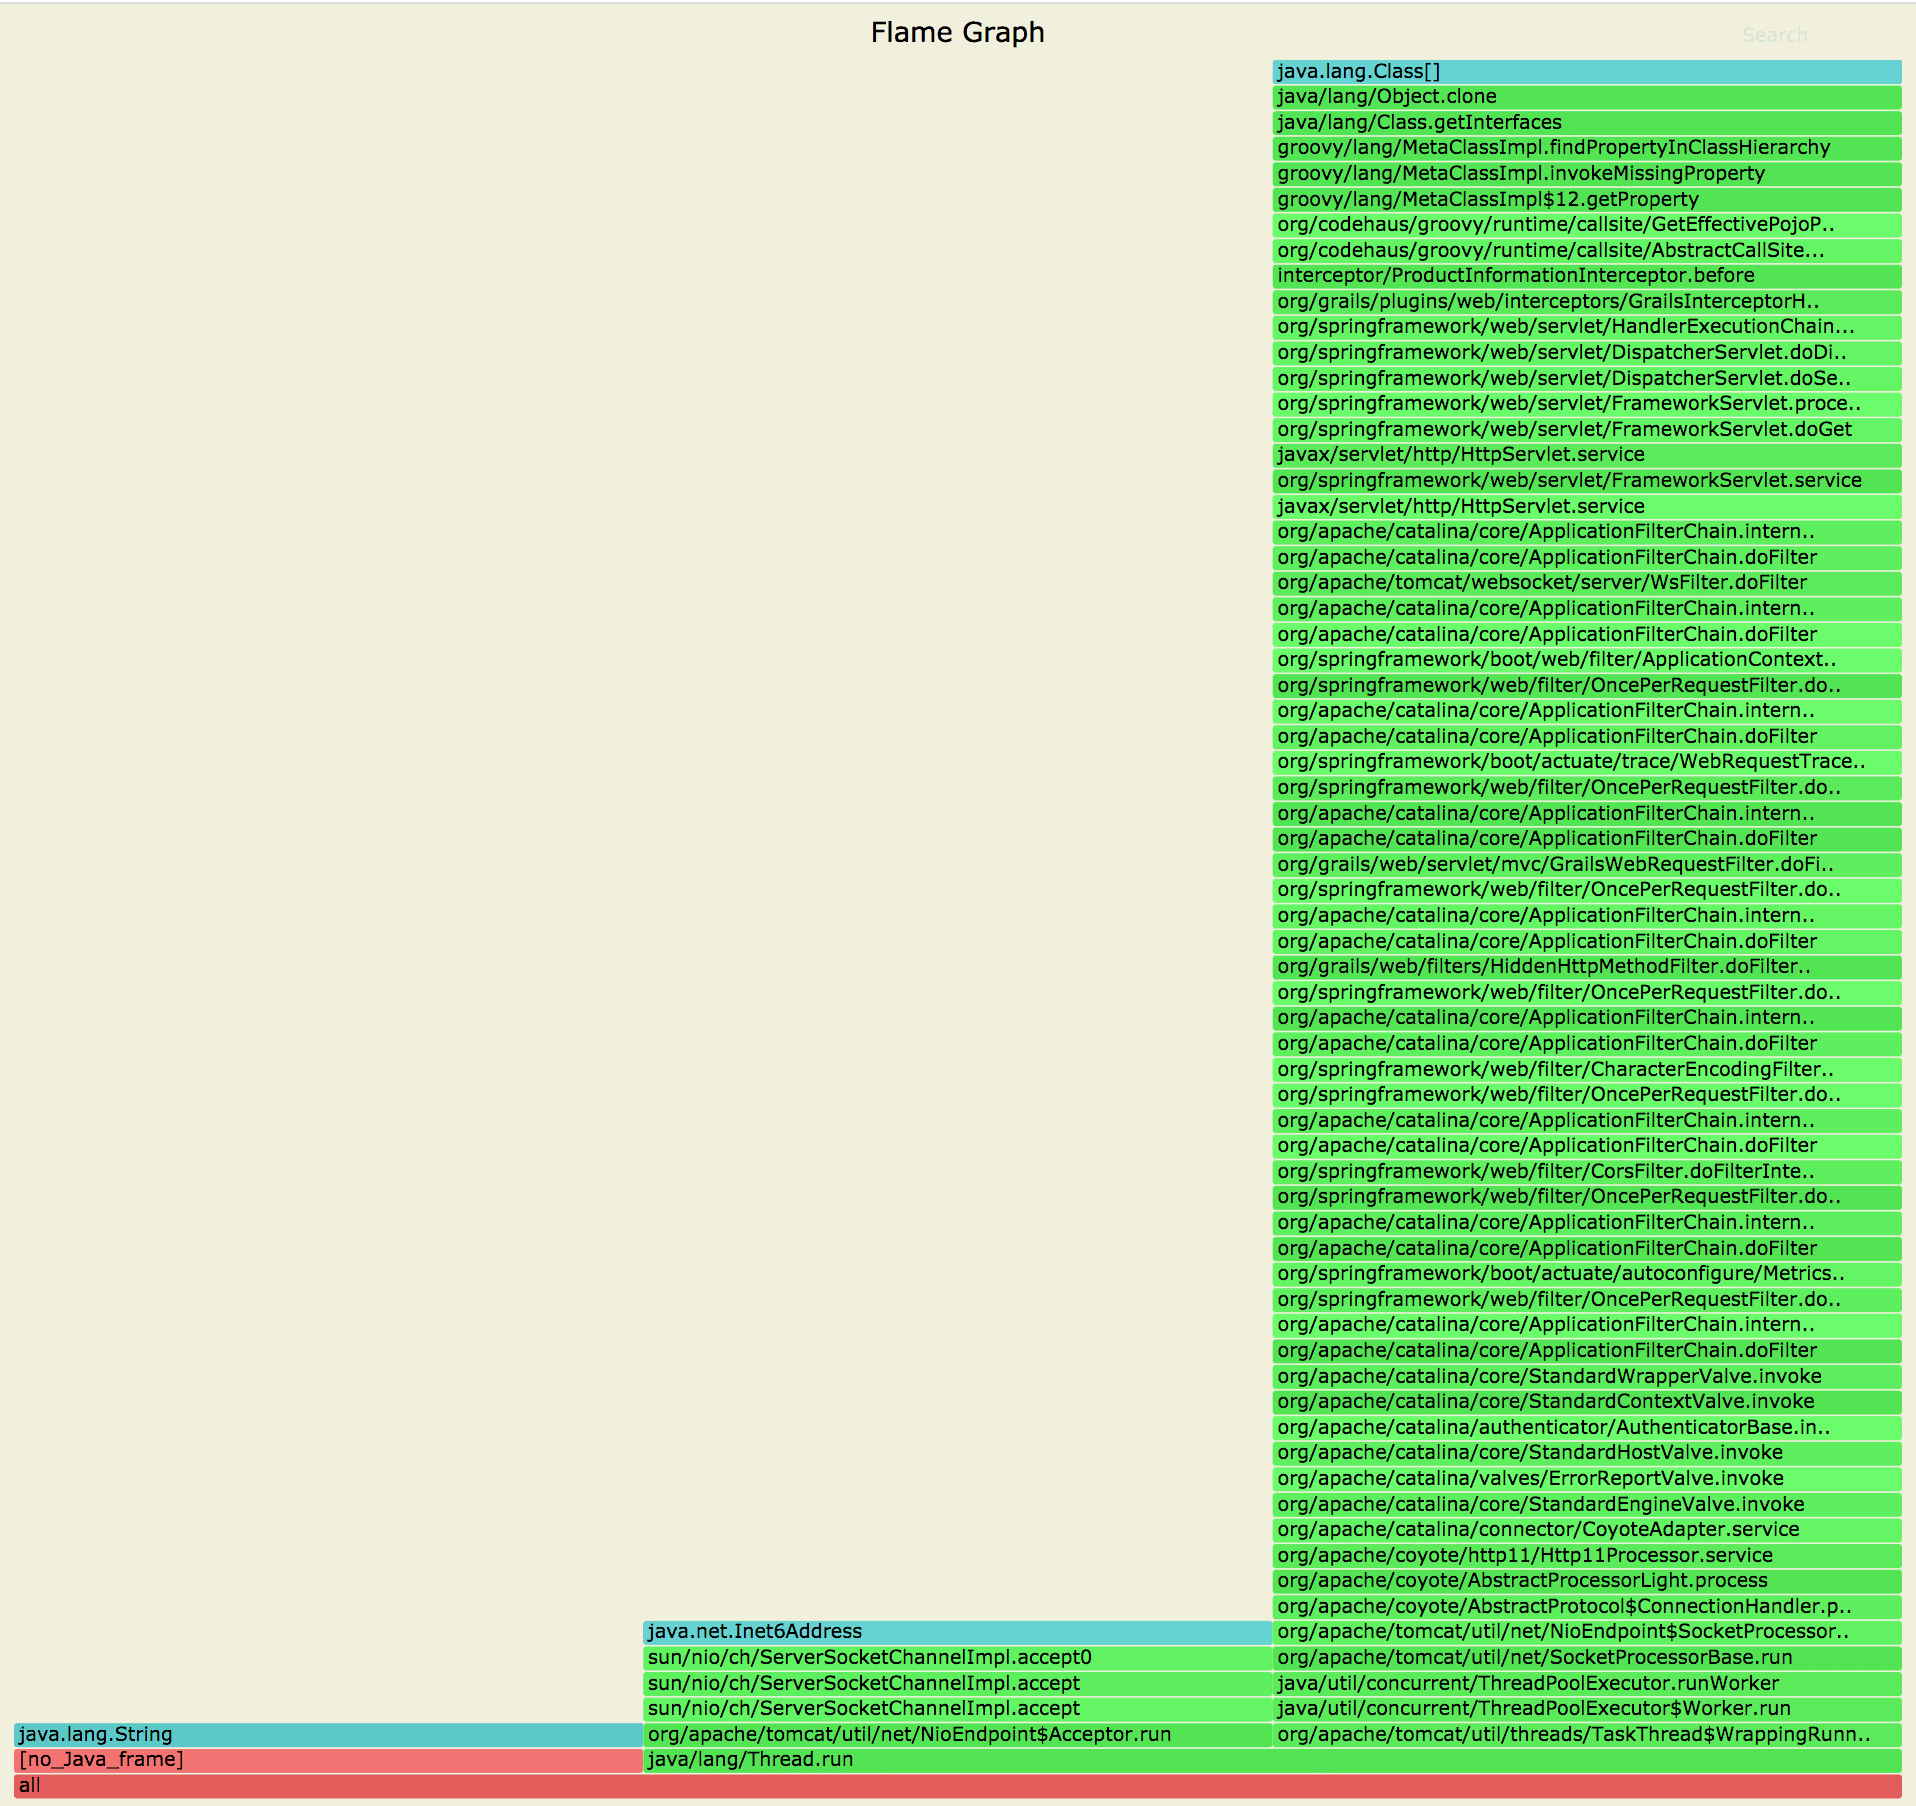
Here, we can see the object cloning has allocated a large part of memory, which is otherwise hard to perceive when looking at the code.
6. Wall-Clock Profiling
Also, async-profiler can sample all threads irrespective of their status – like running, sleeping, or blocked – by using the wall-clock profile.
This can prove handy when troubleshooting issues in the application start-up time.
By defining the wall event, we can configure the profiler to collect samples of all threads:
$ ./profiler.sh -e wall -t -d 30 -f wall_clock_profile.svg 66959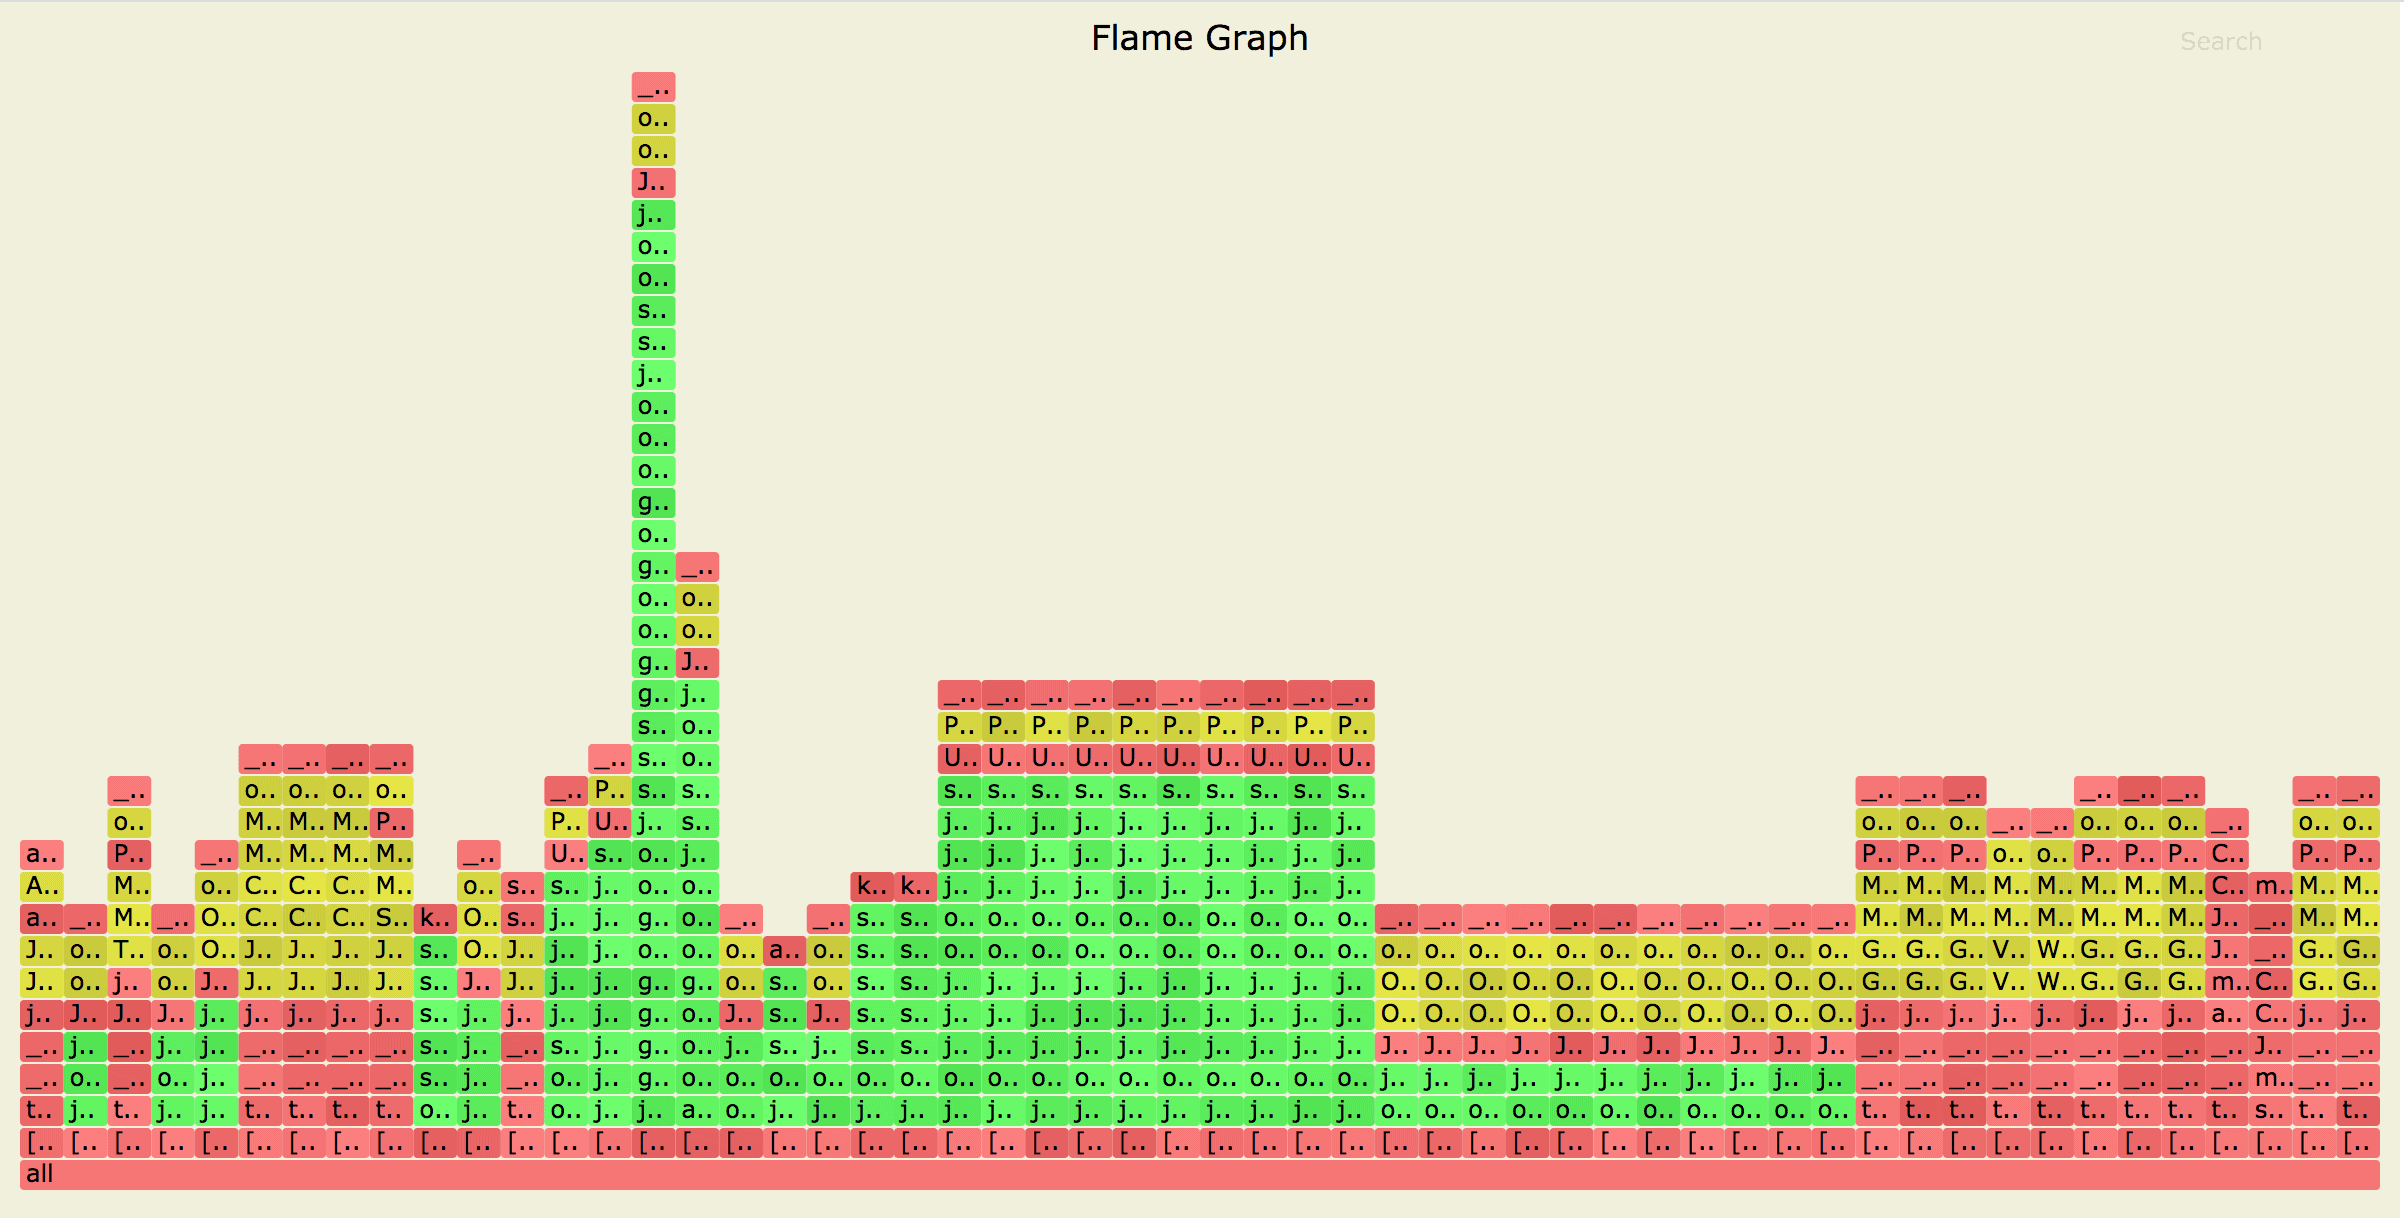
Here, we’ve used the wall-clock profiler in per-thread mode by using the -t option, which is highly recommended when profiling all threads.
Additionally, we can check all profiling events supported by our JVM by using the list option:
$ ./profiler.sh list 66959Basic events:
cpu
alloc
lock
wall
itimer
Java method calls:
ClassName.methodName7. async-profiler With IntelliJ IDEA
IntelliJ IDEA features integration with async-profiler as a profiling tool for Java.
7.1. Profiler Configurations
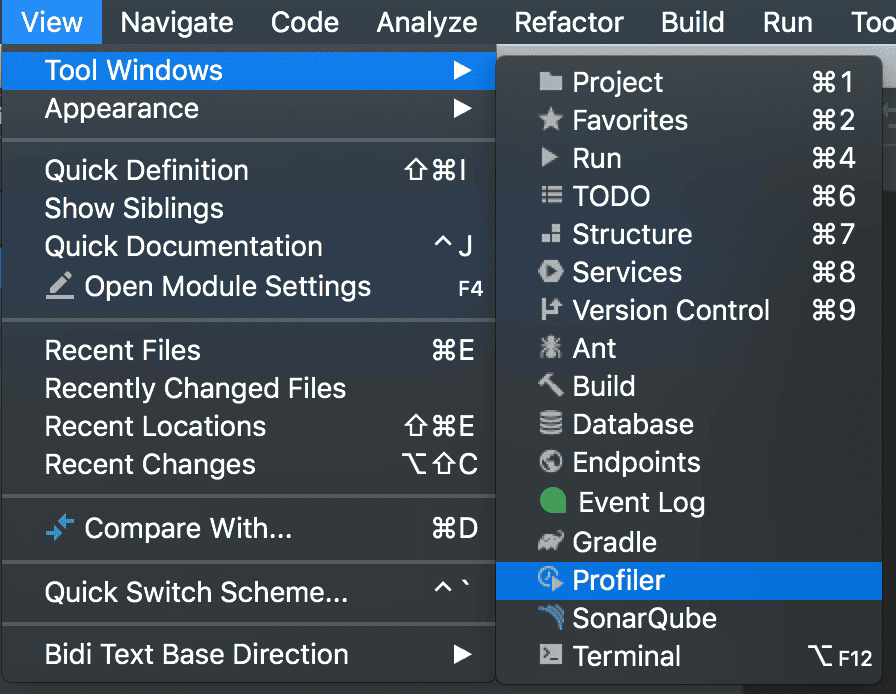
We can configure async-profiler in IntelliJ IDEA by selecting the Java Profiler menu option at
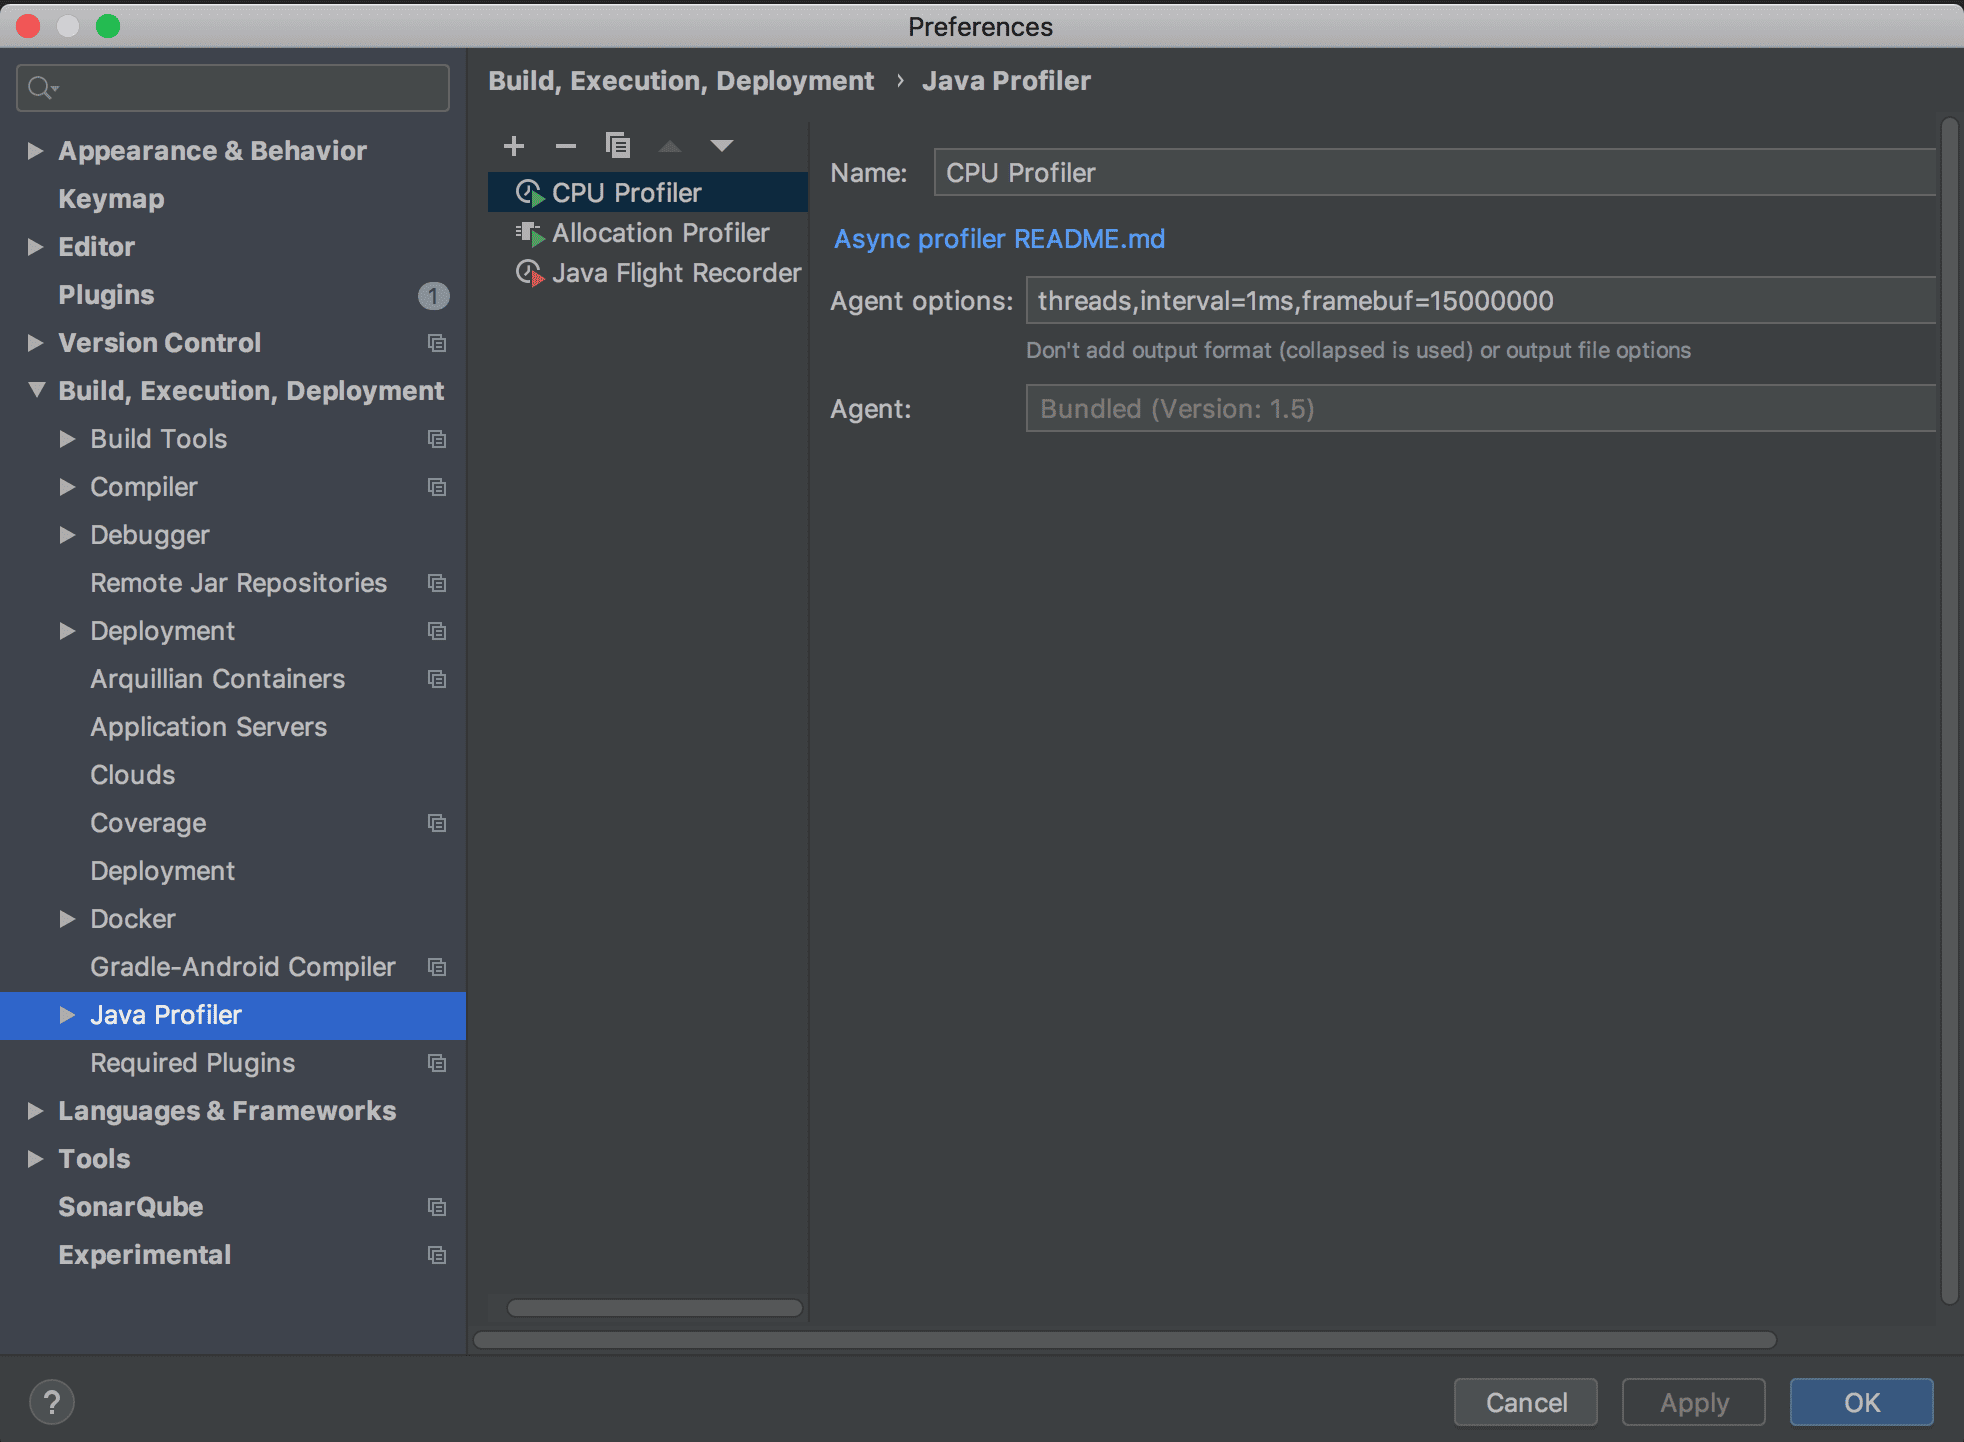
Also, for quick usage, we can choose any predefined configuration, like the CPU Profiler and the Allocation Profiler that IntelliJ IDEA offers.
Similarly, we can copy a profiler template and edit the Agent options for specific use cases.
7.2. Profile Application Using IntelliJ IDEA
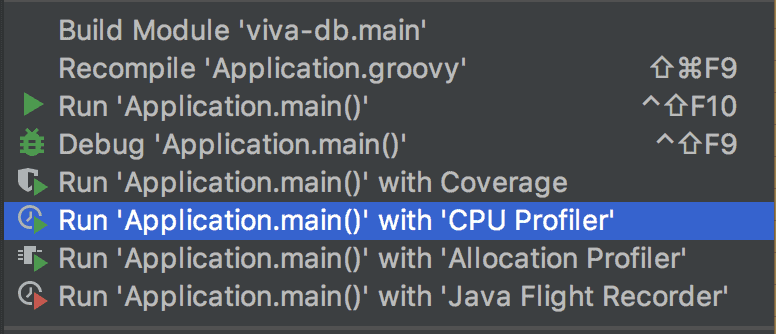
There are a few ways to analyze our application with a profiler.
For instance, we can select the application and choose Run <application name> with <profiler configuration name> option:
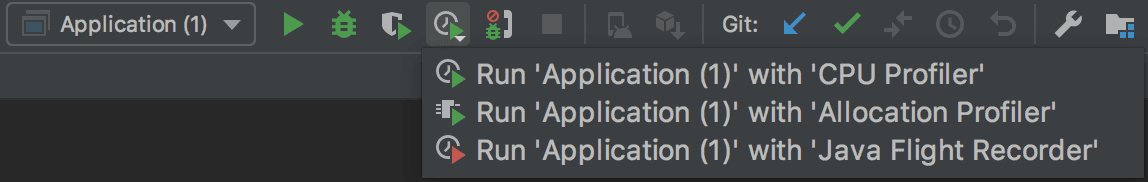
Or, we can click on the toolbar and choose the Run <application name> with <profiler configuration name> option:
Or, by choosing the Run with Profiler option under the Run menu, then selecting the <profiler configuration name>:
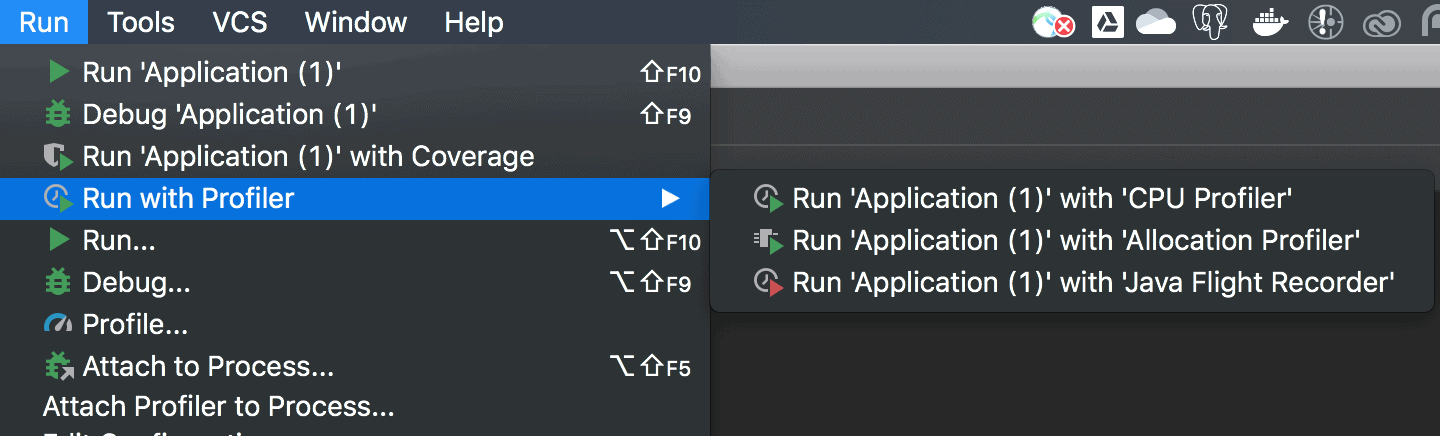
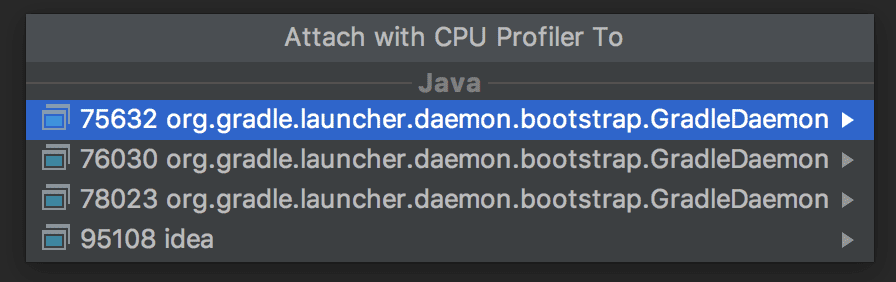
Additionally, we can see the option to Attach Profiler to Process under the Run menu. It opens a dialog that lets us choose the process to attach:
Once our application is profiled, we can analyze the profiling result using the Profiler tool window bar at the bottom of the IDE.
The profiling result of our application will look like:
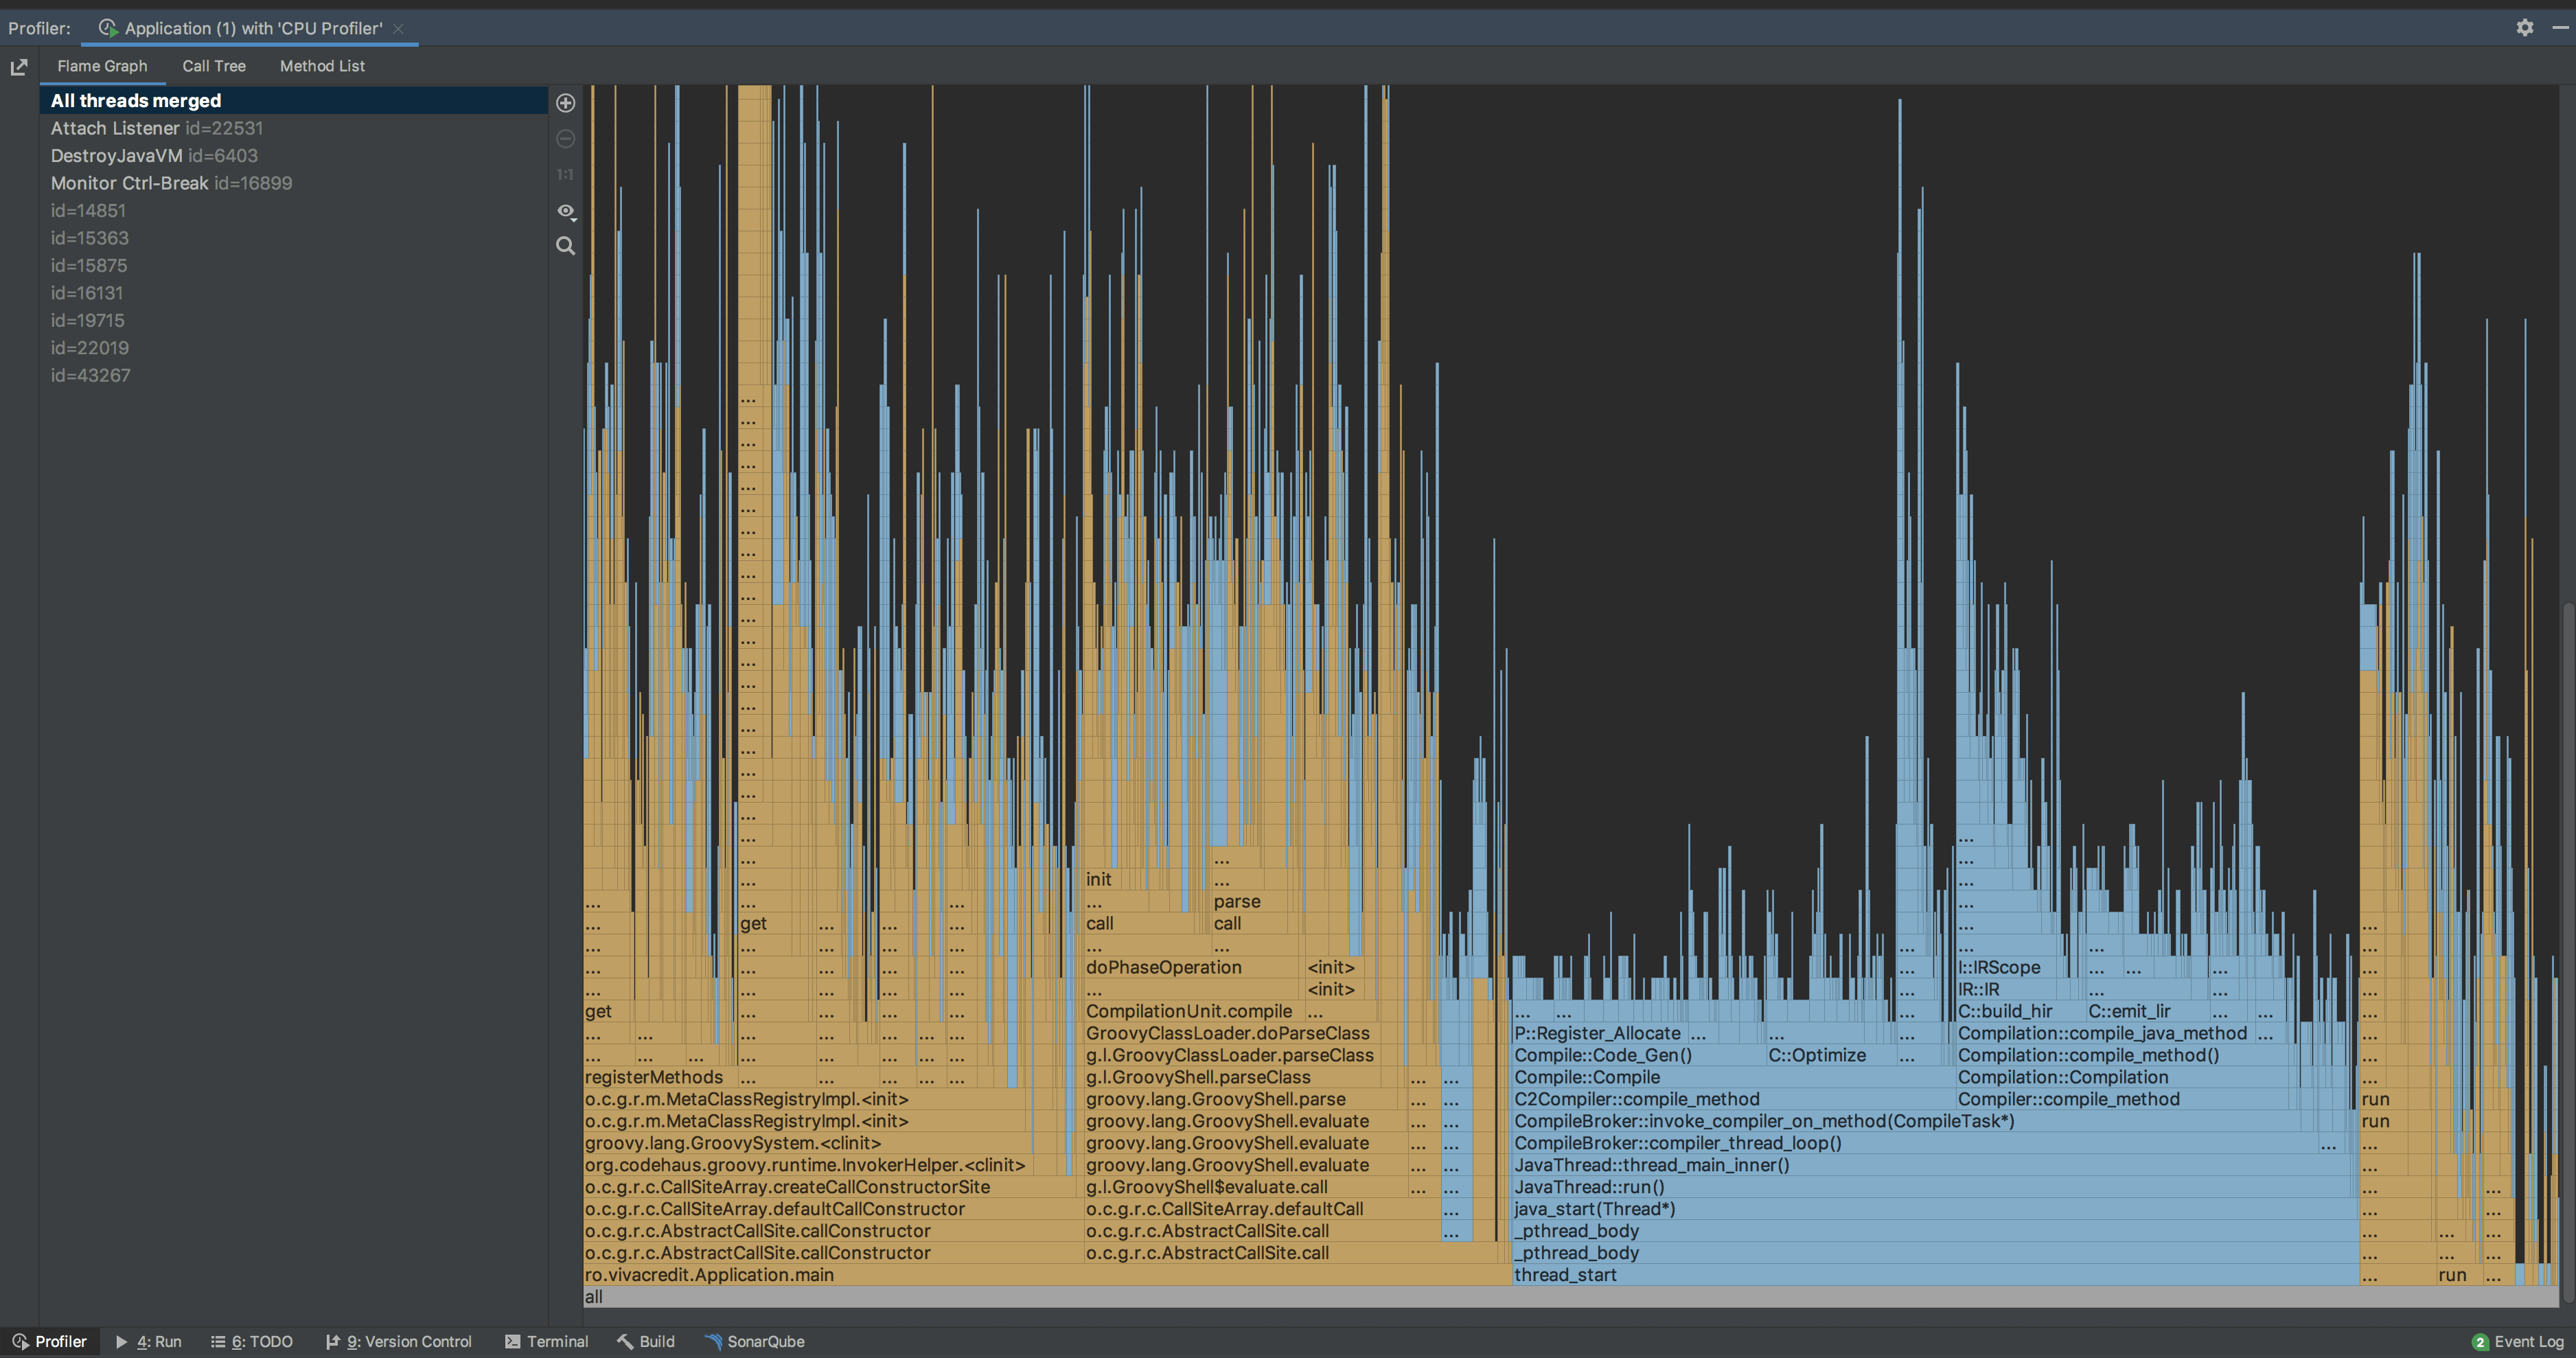
It shows the thread wise results in different output formats like flame graphs, call trees, and method list.
Alternatively, we can choose the Profiler option under the
8. Conclusion
In this article, we explored the async-profiler, along with a few profiling techniques.
First, we’ve seen how to configure the kernel when using the Linux platform, and a few recommended JVM flags to start profiling our application with to obtain accurate results.
Then, we examined various types of profiling techniques like CPU, allocation, and wall-clock.
Last, we profiled an application with async-profiler using IntelliJ IDEA.


