Mocking is an essential part of unit testing, and the Mockito library makes it easy to write clean and intuitive unit tests for your Java code.
Get started with mocking and improve your application tests using our Mockito guide:
Handling concurrency in an application can be a tricky process with many potential pitfalls. A solid grasp of the fundamentals will go a long way to help minimize these issues.
Get started with understanding multi-threaded applications with our Java Concurrency guide:
Spring 5 added support for reactive programming with the Spring WebFlux module, which has been improved upon ever since. Get started with the Reactor project basics and reactive programming in Spring Boot:
Since its introduction in Java 8, the Stream API has become a staple of Java development. The basic operations like iterating, filtering, mapping sequences of elements are deceptively simple to use.
But these can also be overused and fall into some common pitfalls.
To get a better understanding on how Streams work and how to combine them with other language features, check out our guide to Java Streams:
Explore Spring Boot 3 and Spring 6 in-depth through building a full REST API with the framework:
Yes, Spring Security can be complex, from the more advanced functionality within the Core to the deep OAuth support in the framework.
I built the security material as two full courses - Core and OAuth, to get practical with these more complex scenarios. We explore when and how to use each feature and code through it on the backing project.
You can explore the course here:
All Access is finally out, with all of my Spring courses. Learn JUnit is out as well, and Learn Maven is coming fast. And, of course, quite a bit more affordable. Finally.
>> GET THE COURSE
Spring Data JPA is a great way to handle the complexity of JPA with the powerful simplicity of Spring Boot.
Get started with Spring Data JPA through the guided reference course:
Refactor Java code safely — and automatically — with OpenRewrite.
Refactoring big codebases by hand is slow, risky, and easy to put off. That’s where OpenRewrite comes in. The open-source framework for large-scale, automated code transformations helps teams modernize safely and consistently.
Each month, the creators and maintainers of OpenRewrite at Moderne run live, hands-on training sessions — one for newcomers and one for experienced users. You’ll see how recipes work, how to apply them across projects, and how to modernize code with confidence.
Join the next session, bring your questions, and learn how to automate the kind of work that usually eats your sprint time.
1. Overview
It is crucial to analyze the memory consumption to improve the Java application performance and avoid memory problems. Since Java application allocates objects in the JVM heap, monitoring the heap memory and analyzing the objects hosted is very important.
In this tutorial, we’ll introduce two different memory analyzers to demonstrate how we analyze the Java heap memory via an offline heap dump file.
2. Capture Heap Dump
A heap dump is a snapshot of all objects contained in the heap at a specific time point. We could create a heap dump file using certain tools such as VisualVM.
VisualVM is a free profiling tool for Java which bundled with JDK up to version 8. It’s distributed as a standalone application after JDK 8.
We need a program that allows VisualVM to capture the heap dump. Let’s create a sample program to leak memory deliberately:
public class MemoryLeakDemo {
    private static final List<InputStream> leakList = new ArrayList<>();

    public static void main(String[] args) throws InterruptedException {
        int counter = 0;
        while (true) {
            byte[] chunk = new byte[1024 * 1024];
            ByteArrayInputStream bais = new ByteArrayInputStream(chunk);
            leakList.add(bais);

            counter++;
            System.out.println("Allocated " + counter + " MB");
            Thread.sleep(100);
        }
    }
}
This program contains a static variable leakyList. This means it would never be garbage collected. The main method has a loop where it continuously puts 1MB of memory into this static list, which will cause a memory leak.
We are ready to go, and we can run VisualVM to profile it. Once we launch VisualVM, we can see a list of Java processes that are running on the left-hand side “Applications” tab:
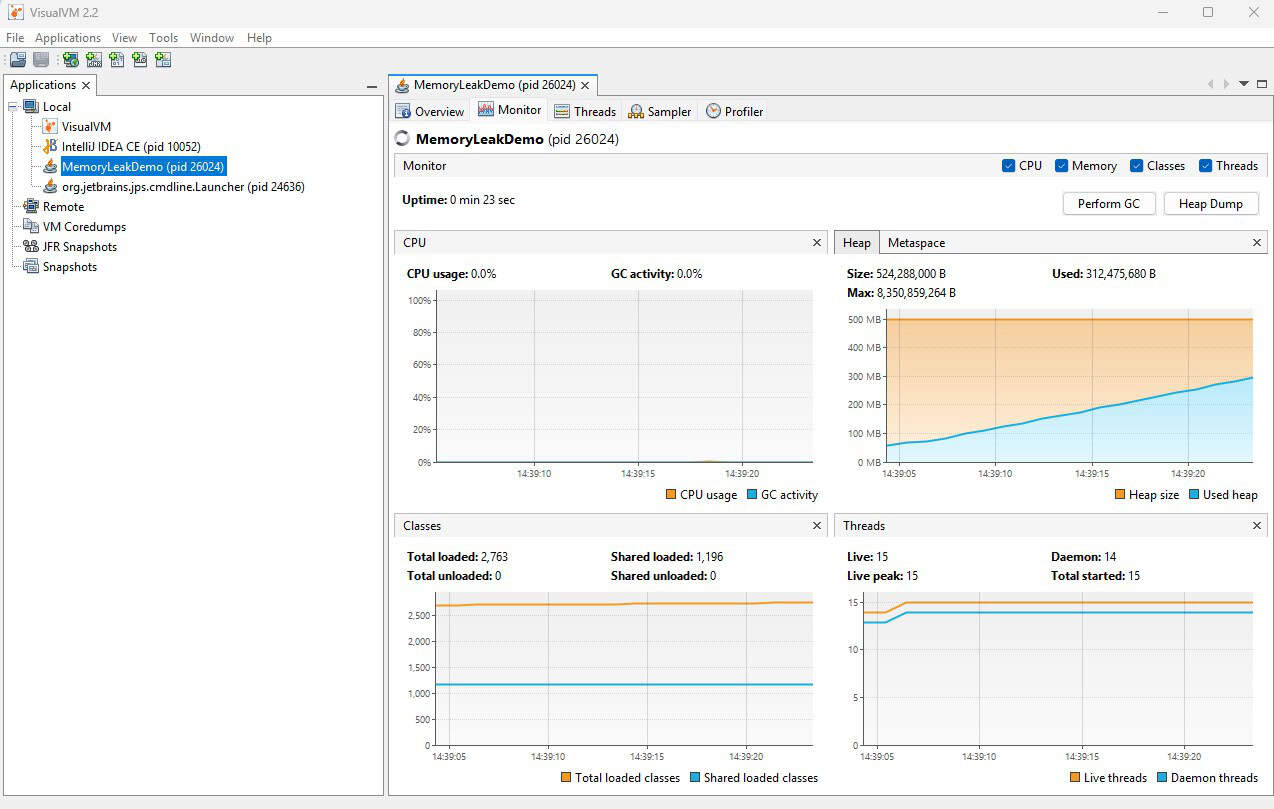
Now, we can run the sample program with that, and we’ll see the corresponding Java process show up. Select the process and switch to the “Monitor” tab on the right panel. We would see the chart of heap memory consumption. Go ahead and click the “Heap Dump” button to generate the heap dump snapshot.
We can export that snapshot as a .hprof file for offline analysis. A .hprof file is in binary format that requires an analyzer to read.
3. Analyzing the Heap Dump with VisualVM
VisualVM has the capability of exporting the heap dump file for offline analysis as well.
When we open up the heap dump file, VisualVM presents a summary of the heap dump that contains general information such as the JVM version and a listing of the environment variables (under “System Properties”):
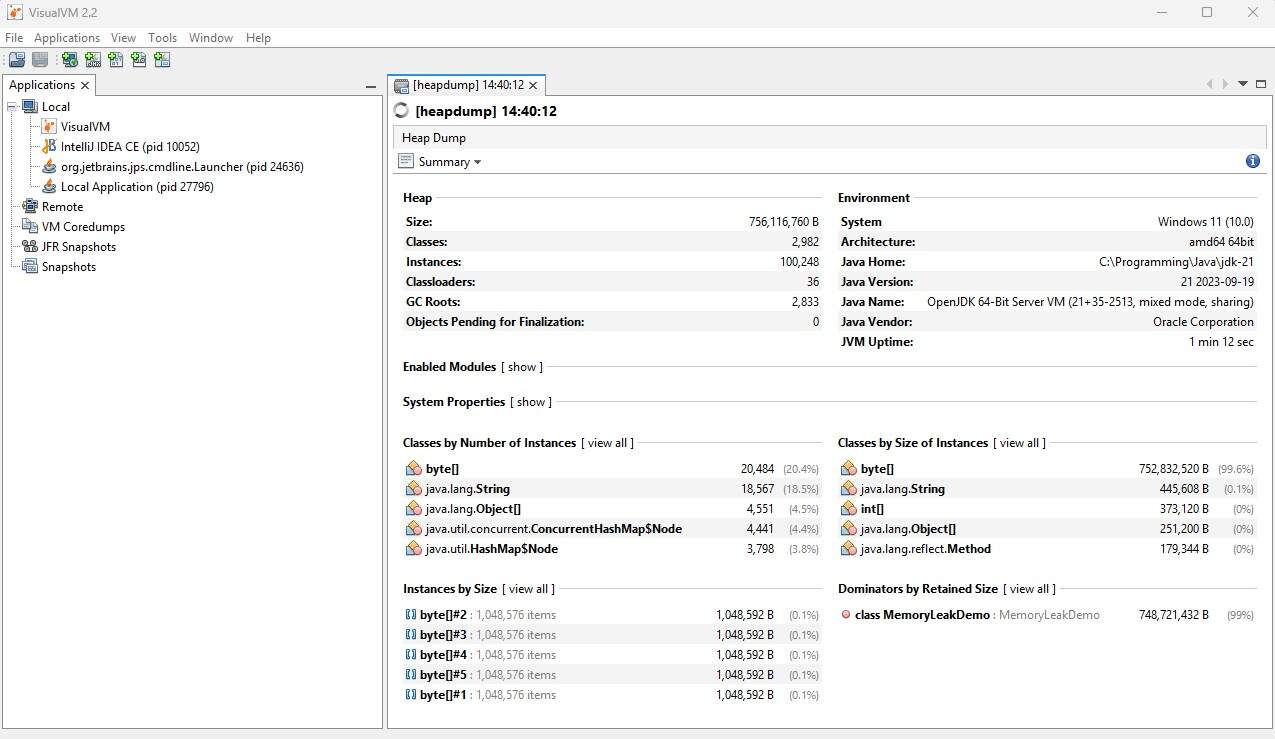
The most informative parts are the “Classes by Number of Instances” and “Classes by Size of Instances”. The first one shows the top 5 classes with the most instances created, while the second one shows the top 5 classes consuming the most heap memory.
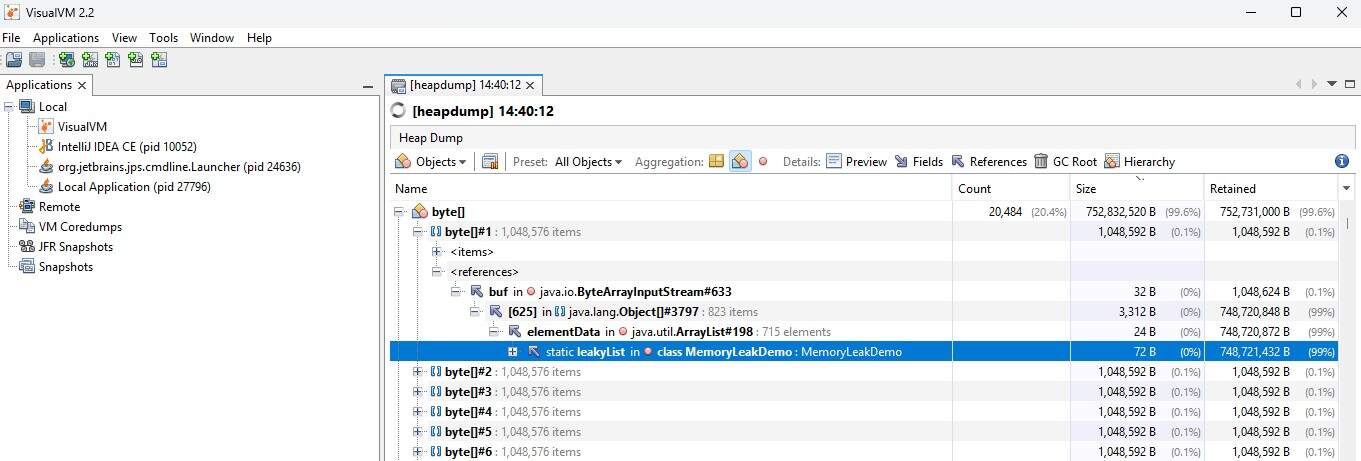
If we switch our view from “Summary” to “Objects”, we can get the objects residing in the heap memory. We’ll see the origin of the object creation. In the example below, we can see that the byte array was created in the MemoryLeakDemo:
4. Analyzing the Heap Dump with Eclipse Memory Analyzer Tool (MAT)
Even though VisualVM can perform basic heap inspection, Eclipse MAT is capable of generating more comprehensive reports on memory analysis.
Once we have imported the heap dump file into Eclipse MAT, we can read multiple reports via the “Overview” tab, such as “Top Consumers” and “Top Components”:
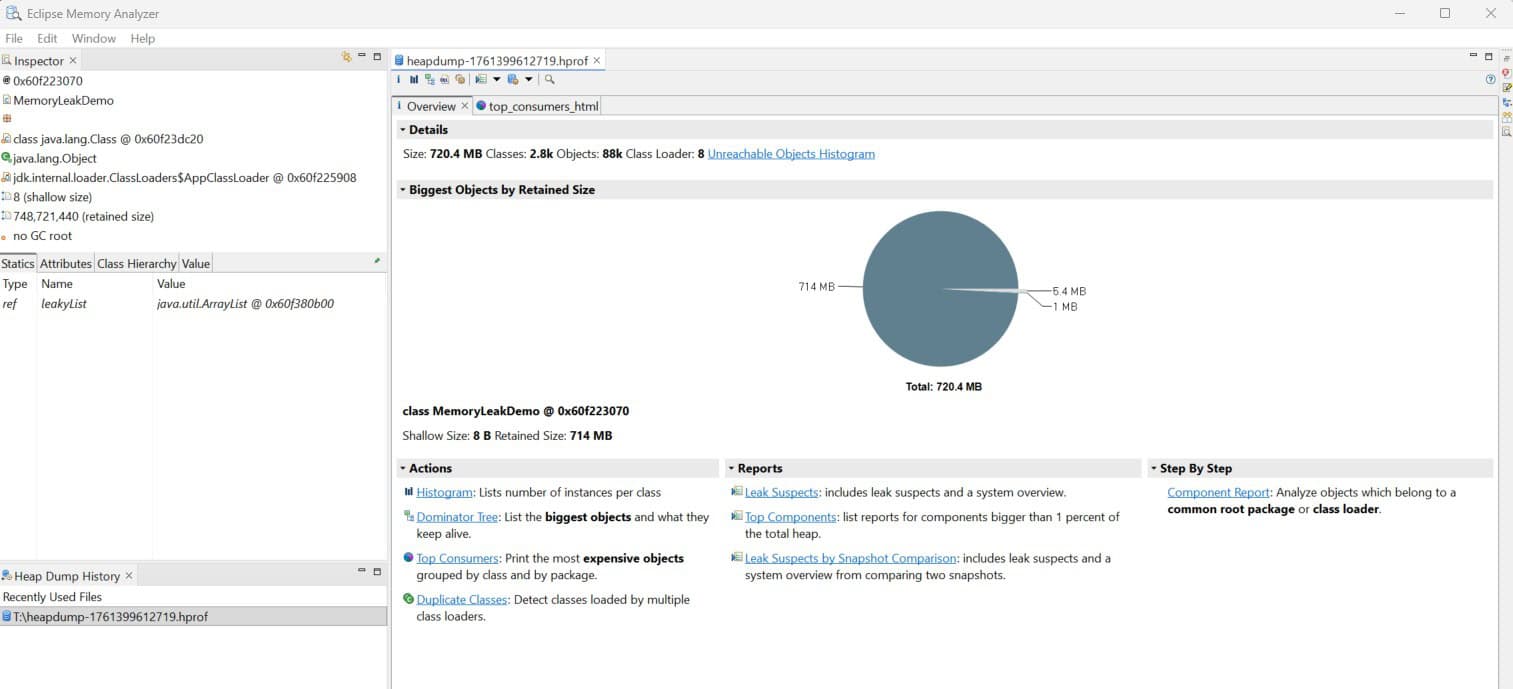
The most helpful one for detecting memory leaks is the leak suspects report. It generates an analysis report for us that finds out all potential memory leaks in the heap dump: 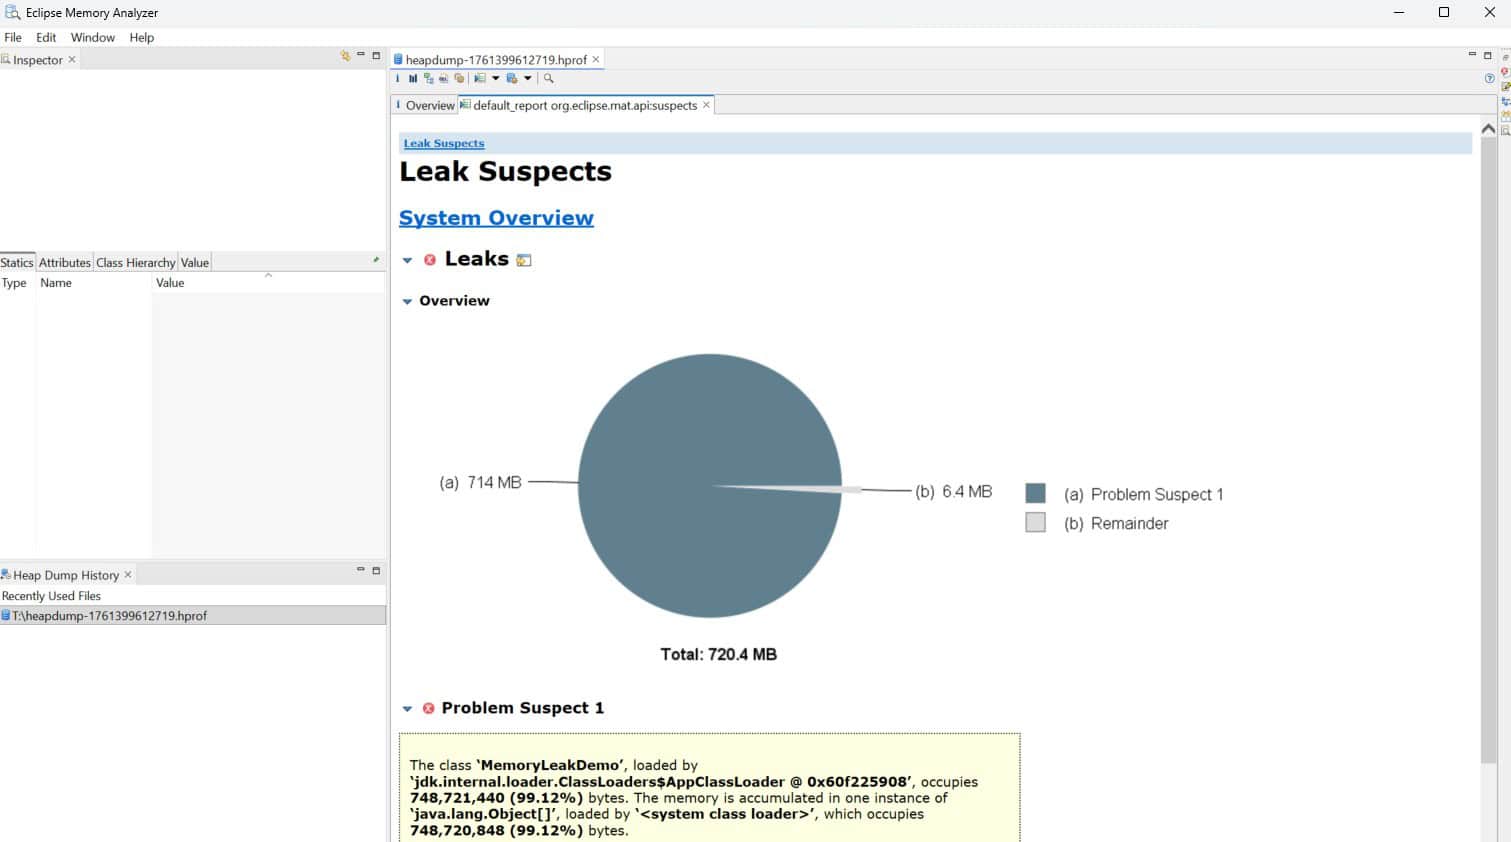
By reading the report details, we can trace where the objects were created, similar to what we saw in VisualVM:
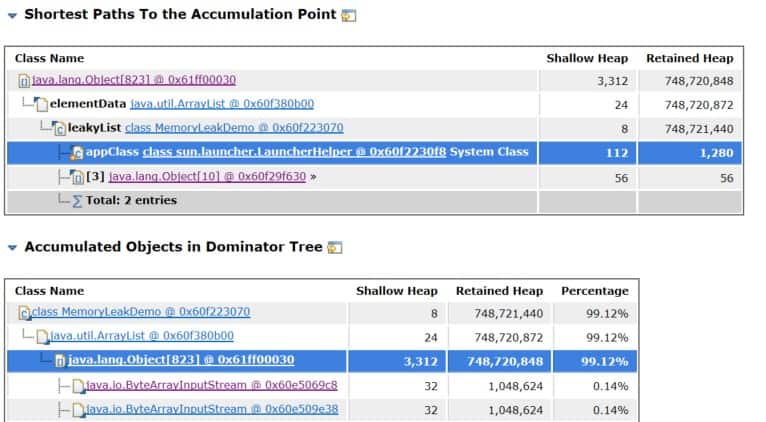
In addition to these comprehensive reports, Eclipse MAT supports Object Query Language (OQL), which is a SQL-like language to query against the heap dump.
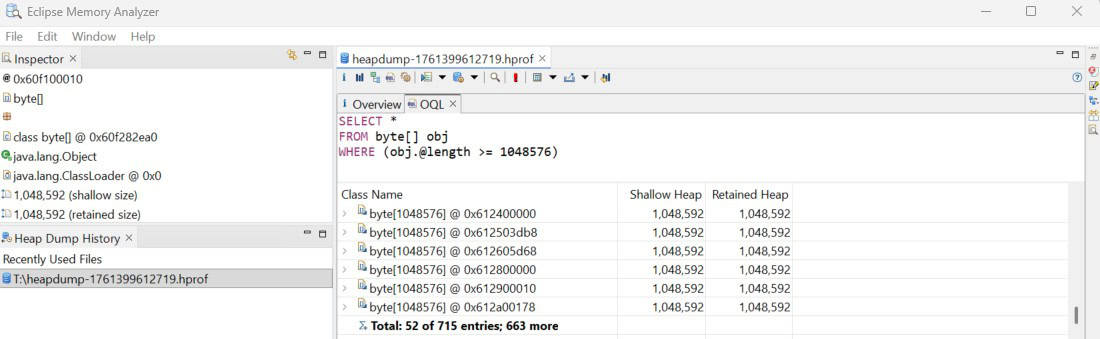
Let’s issue a sample query to select all the byte arrays that are over a size of at least 1MB:
SELECT *
FROM byte[] obj
WHERE (obj.@length >= 1048576)
The query result shows there are 715 byte arrays, each with at least 1MB in size. This count aligns with the leak suspects report findings:
6. Conclusion
Memory analysis is the key to optimizing Java application performance. In this article, we have explored how to capture the heap dump and export it as an offline file.
We also looked into various memory analyzers, such as VisualVM and Eclipse MAT, to identify memory leaks.