IntelliJ Debugging Tricks
Last updated: February 2, 2026

Mocking is an essential part of unit testing, and the Mockito library makes it easy to write clean and intuitive unit tests for your Java code.
Get started with mocking and improve your application tests using our Mockito guide:
Handling concurrency in an application can be a tricky process with many potential pitfalls. A solid grasp of the fundamentals will go a long way to help minimize these issues.
Get started with understanding multi-threaded applications with our Java Concurrency guide:
Spring 5 added support for reactive programming with the Spring WebFlux module, which has been improved upon ever since. Get started with the Reactor project basics and reactive programming in Spring Boot:
Since its introduction in Java 8, the Stream API has become a staple of Java development. The basic operations like iterating, filtering, mapping sequences of elements are deceptively simple to use.
But these can also be overused and fall into some common pitfalls.
To get a better understanding on how Streams work and how to combine them with other language features, check out our guide to Java Streams:
Explore Spring Boot 3 and Spring 6 in-depth through building a full REST API with the framework:
Yes, Spring Security can be complex, from the more advanced functionality within the Core to the deep OAuth support in the framework.
I built the security material as two full courses - Core and OAuth, to get practical with these more complex scenarios. We explore when and how to use each feature and code through it on the backing project.
You can explore the course here:
Spring Data JPA is a great way to handle the complexity of JPA with the powerful simplicity of Spring Boot.
Get started with Spring Data JPA through the guided reference course:
Refactor Java code safely — and automatically — with OpenRewrite.
Refactoring big codebases by hand is slow, risky, and easy to put off. That’s where OpenRewrite comes in. The open-source framework for large-scale, automated code transformations helps teams modernize safely and consistently.
Each month, the creators and maintainers of OpenRewrite at Moderne run live, hands-on training sessions — one for newcomers and one for experienced users. You’ll see how recipes work, how to apply them across projects, and how to modernize code with confidence.
Join the next session, bring your questions, and learn how to automate the kind of work that usually eats your sprint time.
1. Overview
In this tutorial, we’ll look into some advanced IntelliJ debugging facilities.
It’s assumed that debugging basics are already known (how to start debugging, Step Into, Step Over actions etc). If not, please refer to this article for more details on that.
2. Smart Step Into
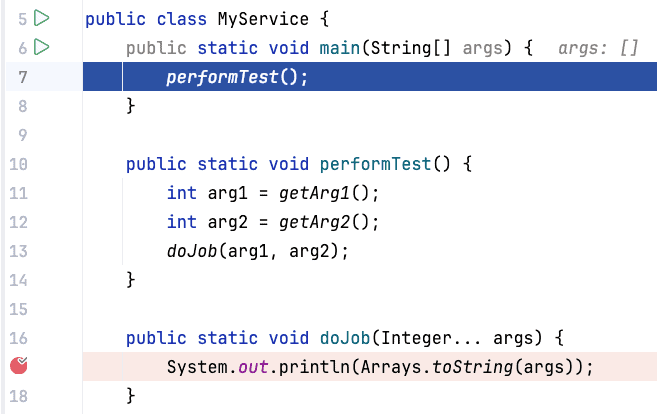
There are situations when multiple methods are called on a single line of source code, such as doJob(getArg1(), getArg2()). If we call Step Into action (F7), the debugger goes into the methods in the order used by the JVM for evaluation: getArg1 – getArg2 – doJob.
However, we might want to skip all intermediate invocations and proceed to the target method directly. Smart Step Into action allows doing that.
It’s bound to the Shift + F7 by default and looks like this when invoked:
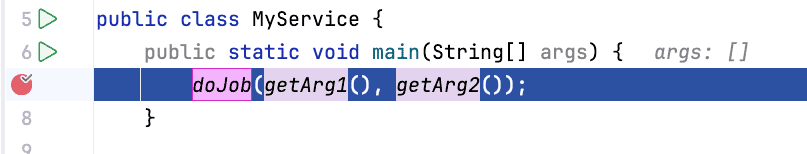
Now we can choose the target method to proceed by using arrow keys or by pressing Tab. Also, note that IntelliJ always puts the outermost method to the top of the list. That means that we can quickly go to it by pressing Shift + F7 | Enter.
3. Reset Frame
We may realize that some processing we’re interested in has already happened (e.g. current method argument’s calculation). In this case, it’s possible to reset the current JVM stack frame(s) in order to re-process them.
Consider the following situation:
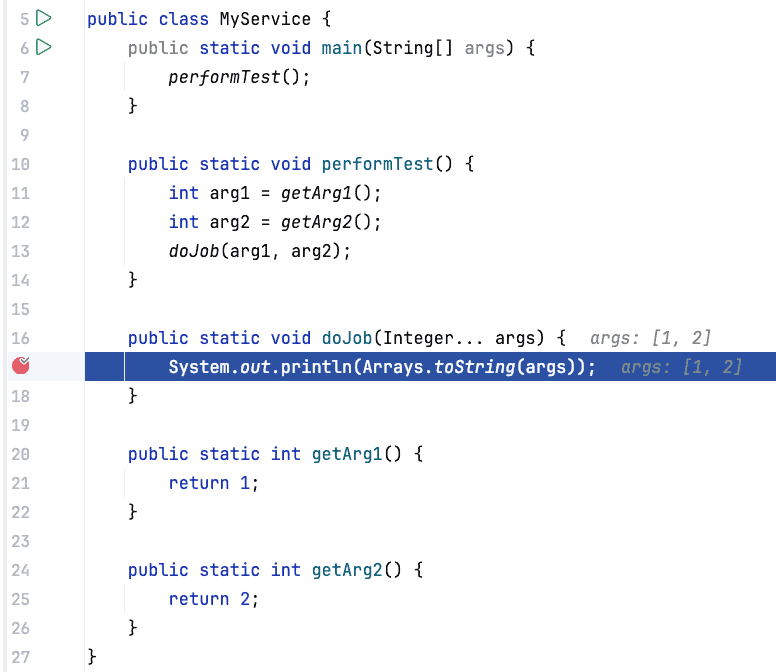
Suppose we’re interested in debugging getArg1 processing, so we reset the current frame (doJob method):
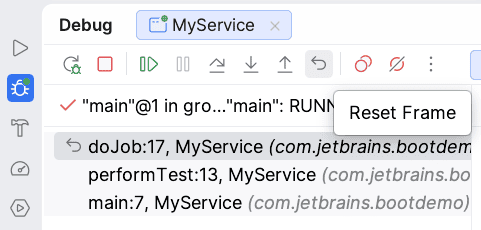
Now we’re in the previous method:
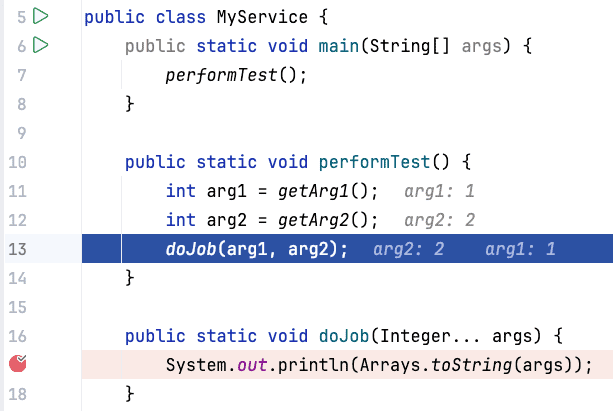
However, the call arguments are already calculated at this point, so, we need to reset the current frame as well:
Now we can re-run the processing by calling Step Into.
4. Field Breakpoints
Sometimes non-private fields are modified by other classes, not through setters but directly (that is the case with third-party libraries where we don’t control the source code).
In such situations, it might be hard to understand when the modification is done. IntelliJ allows creating field-level breakpoints to track that.
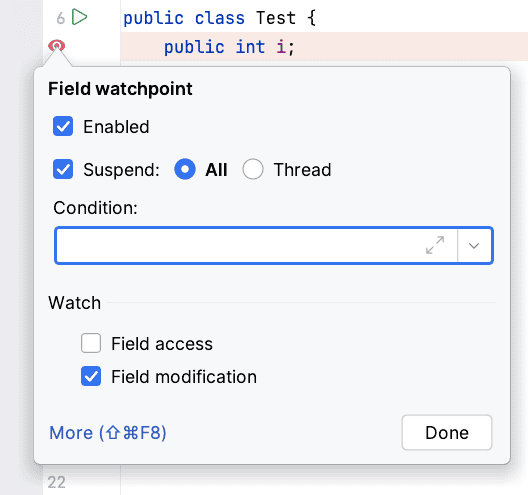
They are set as usual – left-click on the left editor gutter on the field line. After that, it’s possible to open breakpoint properties (right-click on the breakpoint mark) and configure if we’re interested in the field’s reads, writes, or both:
5. Logging Breakpoints
Sometimes we know that there is a race condition in the application but don’t know where exactly it is. It may be a challenge to nail it down, especially while working with new code.
We can add debugging statements to our program’s sources. However, there’s no such ability for third-party libraries.
The IDE can help here – it allows setting breakpoints that don’t block execution once hit, but produce logging statements instead.
Consider the following example:
public static void main(String[] args) {
    ThreadLocalRandom random = ThreadLocalRandom.current();
    int count = 0;
    for (int i = 0; i < 5; i++) {
        if (isInterested(random.nextInt(10))) {
            count++;
        }
    }
    System.out.printf("Found %d interested values%n", count);
}

private static boolean isInterested(int i) {
    return i % 2 == 0;
}
Suppose we’re interested in logging actual isInterested call’s parameters.
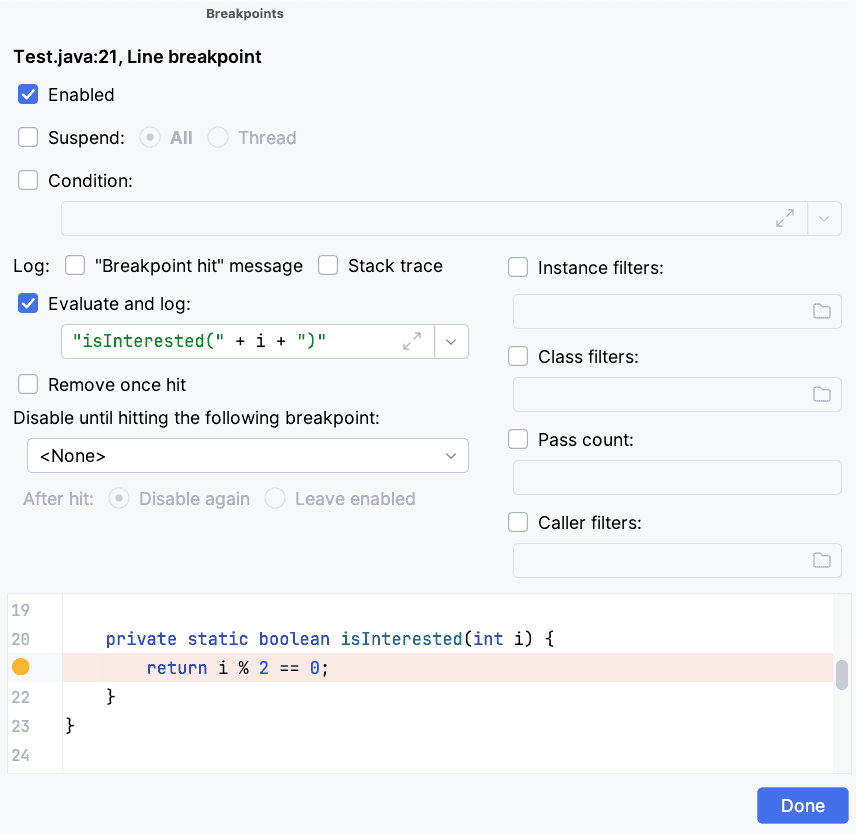
Let’s create a non-blocking breakpoint in the target method (Shift + left-click on the left editor gutter). After that let’s open its properties (right-click on the breakpoint) and define the target expression to log:
When running the application (note that it’s still necessary to use Debug mode), we’ll see the output:
isInterested(1)
isInterested(4)
isInterested(3)
isInterested(1)
isInterested(6)
Found 2 interested values
6. Conditional Breakpoints
We may have a situation where a particular method is called from multiple threads simultaneously and we need to debug the processing just for a particular argument.
IntelliJ allows creating breakpoints that pause the execution only if a user-defined condition is satisfied.
Here’s an example that uses the source code above:
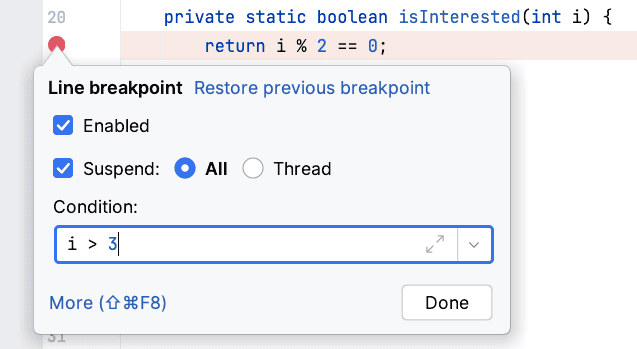
Now the debugger will stop on the breakpoint only if the given argument is greater than 3.
7. Object Marks
This is the most powerful and the least known IntelliJ feature. It’s quite simple in the essence – we can attach custom labels to JVM objects.
Let’s have a look at an application that we’ll use for demonstrating them:
public class Test {

    public static void main(String[] args) {
        Collection<Task> tasks = Arrays.asList(new Task(), new Task());
        tasks.forEach(task -> new Thread(task).start());
    }

    private static void mayBeAdd(Collection<Integer> holder) {
        int i = ThreadLocalRandom.current().nextInt(10);
        if (i % 3 == 0) {
            holder.add(i);
        }
    }

    private static class Task implements Runnable {

        private final Collection<Integer> holder = new ArrayList<>();

        @Override
        public void run() {
            for (int i = 0; i < 20; i++) {
                mayBeAdd(holder);
            }
        }
    }
}
7.1. Creating Marks
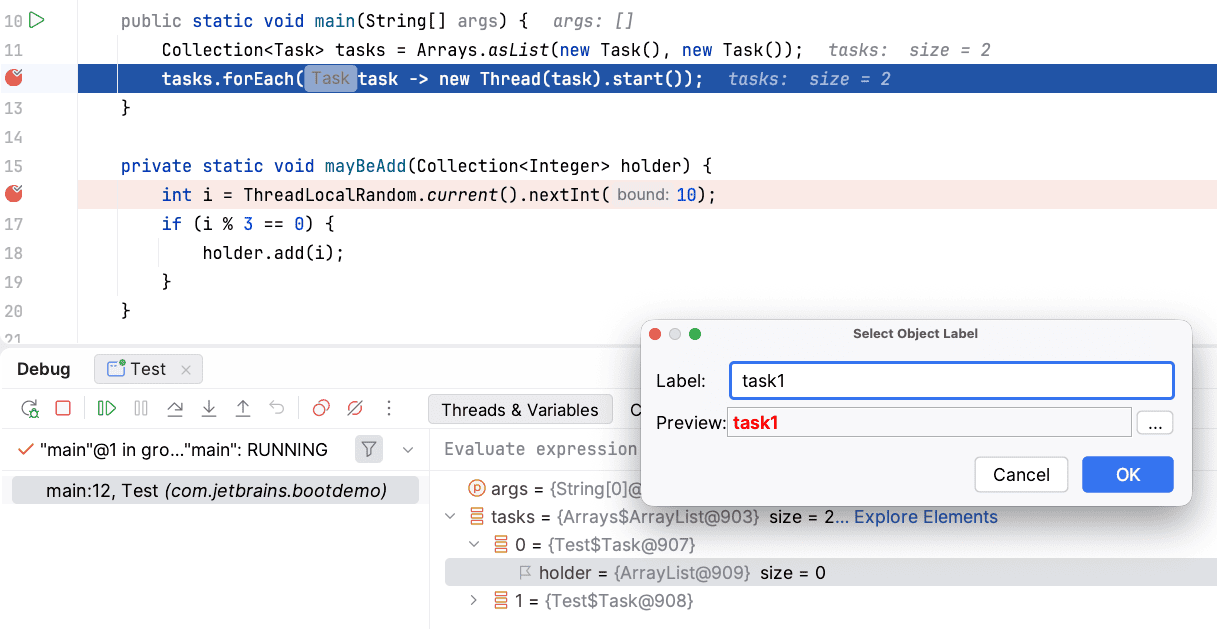
An object can be marked when an application is stopped on a breakpoint and the target is reachable from stack frames.
Select it, press F11 (Mark Object action) and define target name:
7.2. View Marks
Now we can see our custom object labels even in other parts of the application:
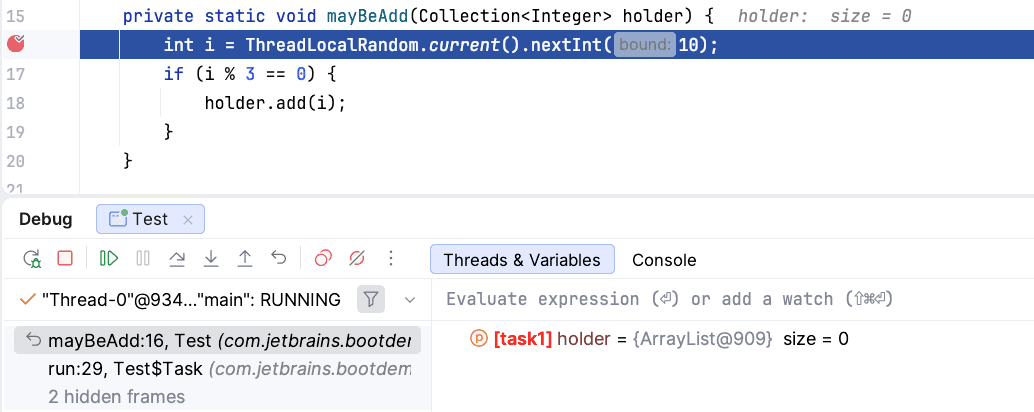
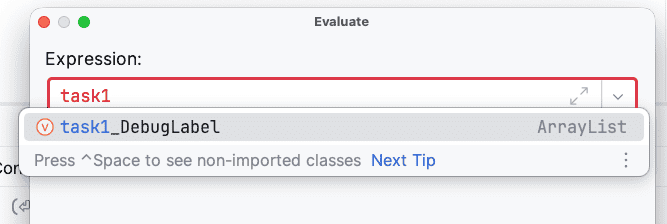
The cool thing is that even if a marked object is not reachable from stack frames at the moment, we can still see its state – open an Evaluate Expression dialog or add a new watch and start typing the mark’s name.
IntelliJ offers to complete it with the _DebugLabel suffix:
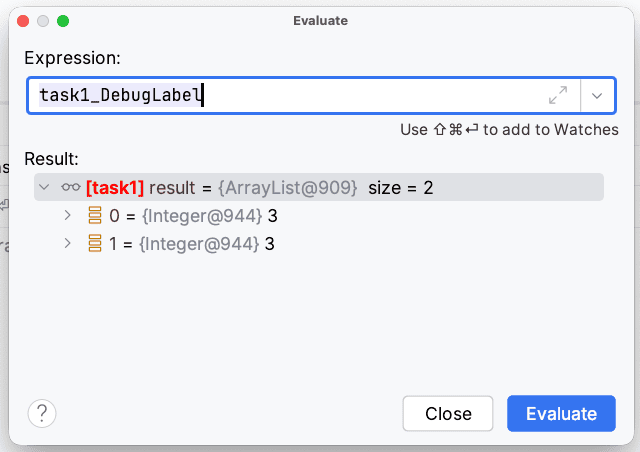
When we evaluate it, the target object’s state is shown:
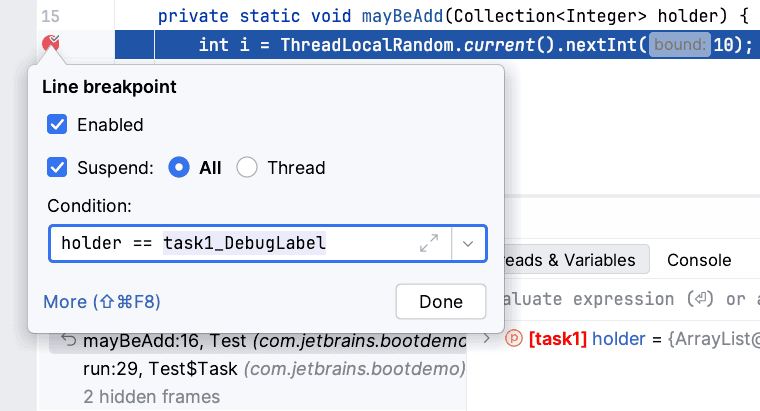
7.3. Marks as Conditions
It’s also possible to use marks in breakpoint conditions:
8. Conclusion
We checked a number of techniques that increase productivity a lot while debugging a multi-threaded application.
This is usually a challenging task, and we cannot understate the importance of tooling’s help here.


