

Mocking is an essential part of unit testing, and the Mockito library makes it easy to write clean and intuitive unit tests for your Java code.
Get started with mocking and improve your application tests using our Mockito guide:
Handling concurrency in an application can be a tricky process with many potential pitfalls. A solid grasp of the fundamentals will go a long way to help minimize these issues.
Get started with understanding multi-threaded applications with our Java Concurrency guide:
Spring 5 added support for reactive programming with the Spring WebFlux module, which has been improved upon ever since. Get started with the Reactor project basics and reactive programming in Spring Boot:
Since its introduction in Java 8, the Stream API has become a staple of Java development. The basic operations like iterating, filtering, mapping sequences of elements are deceptively simple to use.
But these can also be overused and fall into some common pitfalls.
To get a better understanding on how Streams work and how to combine them with other language features, check out our guide to Java Streams:
Explore Spring Boot 3 and Spring 6 in-depth through building a full REST API with the framework:
Yes, Spring Security can be complex, from the more advanced functionality within the Core to the deep OAuth support in the framework.
I built the security material as two full courses - Core and OAuth, to get practical with these more complex scenarios. We explore when and how to use each feature and code through it on the backing project.
You can explore the course here:
Spring Data JPA is a great way to handle the complexity of JPA with the powerful simplicity of Spring Boot.
Get started with Spring Data JPA through the guided reference course:
Refactor Java code safely — and automatically — with OpenRewrite.
Refactoring big codebases by hand is slow, risky, and easy to put off. That’s where OpenRewrite comes in. The open-source framework for large-scale, automated code transformations helps teams modernize safely and consistently.
Each month, the creators and maintainers of OpenRewrite at Moderne run live, hands-on training sessions — one for newcomers and one for experienced users. You’ll see how recipes work, how to apply them across projects, and how to modernize code with confidence.
Join the next session, bring your questions, and learn how to automate the kind of work that usually eats your sprint time.
1. Overview
Performance testing is an activity often pushed towards the end stages of the software development cycle. We usually rely on Java profilers to help troubleshoot performance issues.
In this tutorial, we’ll go through the Simple Performance Framework for Java (SPF4J). It provides us APIs that can be added to our code. As a result, we can make performance monitoring an integral part of our component.
2. Basic Concepts of Metrics Capture and Visualization
Before we start, let’s try to understand the concepts of metrics capture and visualization using a simple example.
Let’s imagine that we’re interested in monitoring the downloads of a newly launched app in an app store. For the sake of learning, let’s think of doing this experiment manually.
2.1. Capturing the Metrics
First, we need to decide on what needs to be measured. The metric we’re interested is downloads/min. Therefore, we’ll measure the number of downloads.
Second, how frequently do we need to take the measurements? Let’s decide “once per minute”.
Finally, how long should we monitor? Let’s decide “for one hour”.
With these rules in place, we’re ready to conduct the experiment. Once the experiment is over, we can see the results:
Time	Cumulative Downloads	Downloads/min
----------------------------------------------
T       497                     0
T+1     624                     127
T+2     676                     52
...
T+14    19347                   17390
T+15    19427                   80
...
T+22    27195                   7350
...
T+41    41321                   11885
...
T+60    43395                   40
The first two columns – time and cumulative downloads – are direct values we observe. The third column, downloads/min, is a derived value calculated as the difference between current and previous cumulative download values. This gives us the actual number of downloads during that time period.
2.2. Visualizing the Metrics
Let’s plot a simple linear graph of time vs downloads/min.
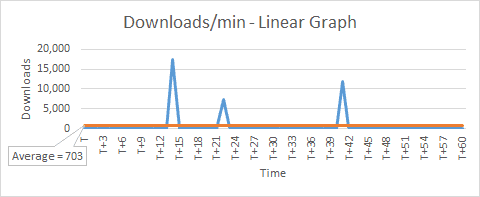
We can see that there are some peaks indicating a large number of downloads that happened on a few occasions. Due to the linear scale used for downloads axis, the lower values appear as a straight line.
Let’s change downloads axis to use a logarithmic scale (base 10) and plot a log/linear graph.
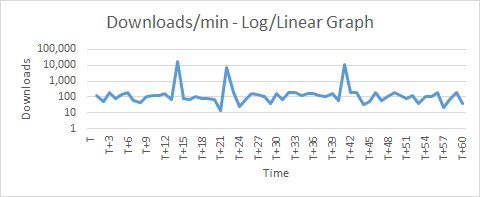
Now we actually start seeing the lower values. And they are closer towards 100 (+/-). Notice that the linear graph indicated an average of 703 as it included the peaks also.
If we were to exclude the peaks as aberrations, we can conclude from our experiment using the log/linear graph:
- the average downloads/min is in the order of 100s
3. Performance Monitoring of a Function Call
Having understood how to capture a simple metric and analyze it from the previous example, let’s now apply it on a simple Java method — isPrimeNumber:
private static boolean isPrimeNumber(long number) {
    for (long i = 2; i <= number / 2; i++) {
        if (number % i == 0)
            return false;
    }
    return true;
}
Using SPF4J, there are two ways to capture metrics. Let’s explore them in the next section.
4. Setup and Configuration
4.1. Maven Setup
SPF4J provides us many different libraries for different purposes, but we only need a few for our simple example.
The core library is spf4j-core, which provides us most of the necessary features.
Let’s add this as a Maven dependency:
<dependency>
    <groupId>org.spf4j</groupId>
    <artifactId>spf4j-core</artifactId>
    <version>8.6.10</version>
</dependency>
There is a more well-suited library for performance monitoring — spf4j-aspects, which uses AspectJ.
We’ll explore this in our example, so let’s add this too:
<dependency>
    <groupId>org.spf4j</groupId>
    <artifactId>spf4j-aspects</artifactId>
    <version>8.6.10</version>
</dependency>
And finally, SPF4J also comes with a simple UI that is quite useful for data visualization, so let’s add spf4j-ui as well:
<dependency>
    <groupId>org.spf4j</groupId>
    <artifactId>spf4j-ui</artifactId>
    <version>8.6.10</version>
</dependency>
4.2. Configuration of Output Files
SPF4J framework writes data into a time-series-database (TSDB) and can optionally also write to a text file.
Let’s configure both of them and set a system property spf4j.perf.ms.config:
public static void initialize() {
  String tsDbFile = System.getProperty("user.dir") + File.separator + "spf4j-performance-monitoring.tsdb2";
  String tsTextFile = System.getProperty("user.dir") + File.separator + "spf4j-performance-monitoring.txt";
  LOGGER.info("\nTime Series DB (TSDB) : {}\nTime Series text file : {}", tsDbFile, tsTextFile);
  System.setProperty("spf4j.perf.ms.config", "TSDB@" + tsDbFile + "," + "TSDB_TXT@" + tsTextFile);
}
4.3. Recorders and Sources
The SPF4J framework’s core capability is to record, aggregate, and save metrics, so that there is no post-processing needed when analyzing it. It does so by using the MeasurementRecorder and MeasurementRecorderSource classes.
These two classes provide two different ways to record a metric. The key difference is that MeasurementRecorder can be invoked from anywhere, whereas MeasurementRecorderSource is used only with annotations.
The framework provides us a RecorderFactory class to create instances of recorder and recorder source classes for different types of aggregations:
- createScalableQuantizedRecorder() and createScalableQuantizedRecorderSource()
- createScalableCountingRecorder() and createScalableCountingRecorderSource()
- createScalableMinMaxAvgRecorder() and createScalableMinMaxAvgRecorderSource()
- createDirectRecorder() and createDirectRecorderSource()
For our example, let’s choose scalable quantized aggregation.
4.4. Creating a Recorder
First, let’s create a helper method to create an instance of MeasurementRecorder:
public static MeasurementRecorder getMeasurementRecorder(Object forWhat) {
    String unitOfMeasurement = "ms";
    int sampleTimeMillis = 1_000;
    int factor = 10;
    int lowerMagnitude = 0;
    int higherMagnitude = 4;
    int quantasPerMagnitude = 10;

    return RecorderFactory.createScalableQuantizedRecorder(
      forWhat, unitOfMeasurement, sampleTimeMillis, factor, lowerMagnitude,
      higherMagnitude, quantasPerMagnitude);
}
Let’s look at the different settings:
- unitOfMeasurement – the unit value being measured – for a performance monitoring scenario, it is generally a unit of time
- sampleTimeMillis – the time period for taking measurements – or in other words, how often to take measurements
- factor – the base of the logarithmic scale used for plotting the measured value
- lowerMagnitude – the minimum value on the logarithmic scale – for log base 10, lowerMagnitude = 0 means 10 to power 0 = 1
- higherMagnitude – the maximum value on the logarithmic scale – for log base 10, higherMagnitude = 4 means 10 to power 4 = 10,000
- quantasPerMagnitude – number of sections within a magnitude – if a magnitude ranges from 1,000 to 10,000, then quantasPerMagnitude = 10 means the range will be divided into 10 sub-ranges
We can see that the values can be changed as per our need. So, it might be a good idea to create separate MeasurementRecorder instances for different measurements.
4.5. Creating a Source
Next, let’s create an instance of MeasurementRecorderSource using another helper method:
public static final class RecorderSourceForIsPrimeNumber extends RecorderSourceInstance {
    public static final MeasurementRecorderSource INSTANCE;
    static {
        Object forWhat = App.class + " isPrimeNumber";
        String unitOfMeasurement = "ms";
        int sampleTimeMillis = 1_000;
        int factor = 10;
        int lowerMagnitude = 0;
        int higherMagnitude = 4;
        int quantasPerMagnitude = 10;
        INSTANCE = RecorderFactory.createScalableQuantizedRecorderSource(
          forWhat, unitOfMeasurement, sampleTimeMillis, factor,
          lowerMagnitude, higherMagnitude, quantasPerMagnitude);
    }
}
Notice that we’ve used the same values for settings as previously.
4.6. Creating a Configuration Class
Let’s now create a handy Spf4jConfig class and put all the above methods inside it:
public class Spf4jConfig {
    public static void initialize() {
        //...
    }

    public static MeasurementRecorder getMeasurementRecorder(Object forWhat) {
        //...
    }

    public static final class RecorderSourceForIsPrimeNumber extends RecorderSourceInstance {
        //...
    }
}
4.7. Configuring aop.xml
SPF4J provides us the option to annotate methods on which to do performance measurement and monitoring. It uses the AspectJ library, which allows adding additional behavior needed for performance monitoring to existing code without modification of the code itself.
Let’s weave our class and aspect using load-time weaver and put aop.xml under a META-INF folder:
<aspectj>
    <aspects>
        <aspect name="org.spf4j.perf.aspects.PerformanceMonitorAspect" />
    </aspects>
    <weaver options="-verbose">
        <include within="com..*" />
        <include within="org.spf4j.perf.aspects.PerformanceMonitorAspect" />
    </weaver>
</aspectj>
5. Using MeasurementRecorder
Let’s now see how to use the MeasurementRecorder to record the performance metrics of our test function.
5.1. Recording the Metrics
Let’s generate 100 random numbers and invoke the prime check method in a loop. Prior to this, let’s call our Spf4jConfig class to do the initialization and to create an instance of MeasureRecorder class. Using this instance, let’s call the record() method to save the individual time taken for 100 isPrimeNumber() calls:
Spf4jConfig.initialize();
MeasurementRecorder measurementRecorder = Spf4jConfig
  .getMeasurementRecorder(App.class + " isPrimeNumber");
Random random = new Random();
for (int i = 0; i < 100; i++) {
    long numberToCheck = random.nextInt(999_999_999 - 100_000_000 + 1) + 100_000_000;
    long startTime = System.currentTimeMillis();
    boolean isPrime = isPrimeNumber(numberToCheck);
    measurementRecorder.record(System.currentTimeMillis() - startTime);
    LOGGER.info("{}. {} is prime? {}", i + 1, numberToCheck, isPrime);
}
5.2. Running the Code
We’re now ready to test the performance of our simple function isPrimeNumber().
Let’s run the code and see the results:
Time Series DB (TSDB) : E:\Projects\spf4j-core-app\spf4j-performance-monitoring.tsdb2
Time Series text file : E:\Projects\spf4j-core-app\spf4j-performance-monitoring.txt
1. 406704834 is prime? false
...
9. 507639059 is prime? true
...
20. 557385397 is prime? true
...
26. 152042771 is prime? true
...
100. 841159884 is prime? false
5.3. Viewing the Results
Let’s launch the SPF4J UI by running the command from the project folder:
java -jar target/dependency-jars/spf4j-ui-8.6.9.jarThis will bring up a desktop UI application. Then, from the menu let’s choose File > Open. After that, let’s use the browse window to locate the spf4j-performance-monitoring.tsdb2 file and open it.
We can now see a new window open up with a tree view containing our file name and a child item. Let’s click on the child item and then click on the Plot button above it.
This will generate a series of graphs.
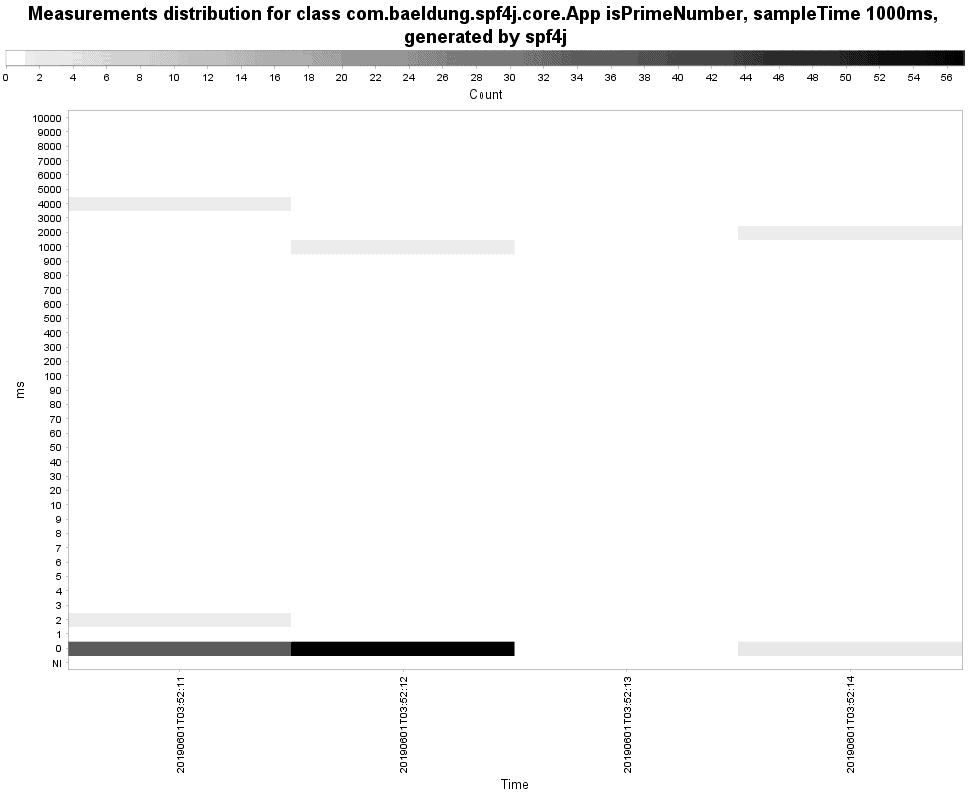
The first graph, measurement distribution, is a variation of the log-linear graph we saw earlier. This graph additionally shows a heatmap based on the count.
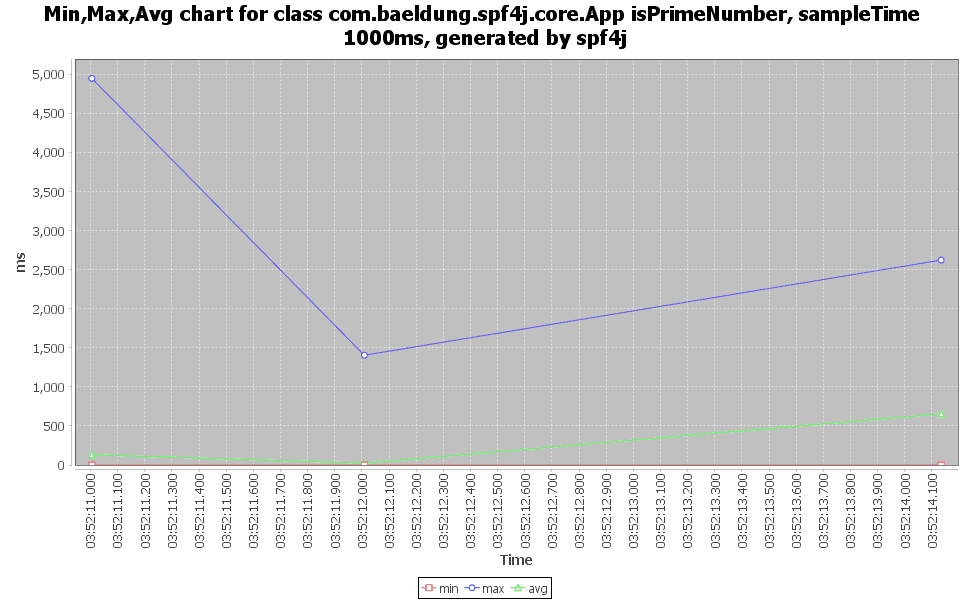
The second graph shows aggregated data like min, max, and average:
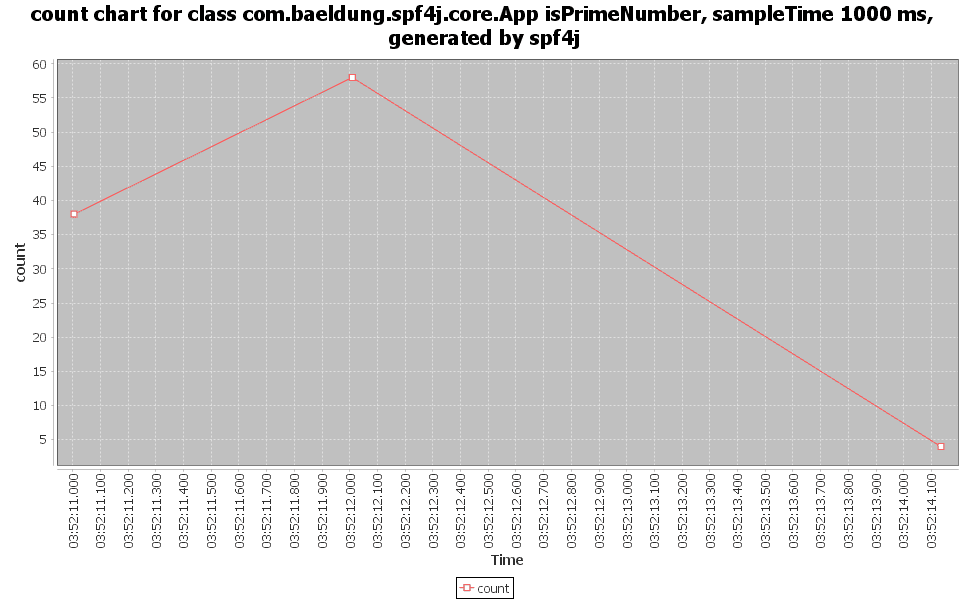
And the last graph shows the count of measurements vs time:
6. Using MeasurementRecorderSource
In the previous section, we had to write extra code around our functionality to record the measurements. In this section, let’s use another approach to avoid this.
6.1. Recording the Metrics
First, we’ll remove the extra code added for capturing and recording metrics:
Spf4jConfig.initialize();
Random random = new Random();
for (int i = 0; i < 50; i++) {
    long numberToCheck = random.nextInt(999_999_999 - 100_000_000 + 1) + 100_000_000;
    isPrimeNumber(numberToCheck);
}
Instead of all that boilerplate, next, let’s annotate the isPrimeNumber() method using @PerformanceMonitor:
@PerformanceMonitor(
  warnThresholdMillis = 1,
  errorThresholdMillis = 100,
  recorderSource = Spf4jConfig.RecorderSourceForIsPrimeNumber.class)
private static boolean isPrimeNumber(long number) {
    //...
}
Let’s look at the different settings:
- warnThresholdMillis – maximum time allowed for the method to run without a warning message
- errorThresholdMillis – maximum time allowed for the method to run without an error message
- recorderSource – an instance of MeasurementRecorderSource
6.2. Running the Code
Let’s do a Maven build first and then execute the code by passing a Java agent:
java -javaagent:target/dependency-jars/aspectjweaver-1.8.13.jar -jar target/spf4j-aspects-app.jarWe see the results:
Time Series DB (TSDB) : E:\Projects\spf4j-aspects-app\spf4j-performance-monitoring.tsdb2
Time Series text file : E:\Projects\spf4j-aspects-app\spf4j-performance-monitoring.txt

[DEBUG] Execution time 0 ms for execution(App.isPrimeNumber(..)), arguments [555031768]
...
[ERROR] Execution time  2826 ms for execution(App.isPrimeNumber(..)) exceeds error threshold of 100 ms, arguments [464032213]
...
We can see that SPF4J framework logs the time taken for every method call. And whenever it exceeds the errorThresholdMillis value of 100 ms, it logs it as an error. The argument passed to the method is also logged.
6.3. Viewing the Results
We can view the results the same way as we did earlier using the SPF4J UI so we can refer to the previous section.
7. Conclusion
In this article, we talked about the basic concepts of capturing and visualizing metrics.
We then understood the performance monitoring capabilities of SPF4J framework with the help of a simple example. We also used the built-in UI tool to visualize the data.


