

Mocking is an essential part of unit testing, and the Mockito library makes it easy to write clean and intuitive unit tests for your Java code.
Get started with mocking and improve your application tests using our Mockito guide:
Handling concurrency in an application can be a tricky process with many potential pitfalls. A solid grasp of the fundamentals will go a long way to help minimize these issues.
Get started with understanding multi-threaded applications with our Java Concurrency guide:
Spring 5 added support for reactive programming with the Spring WebFlux module, which has been improved upon ever since. Get started with the Reactor project basics and reactive programming in Spring Boot:
Since its introduction in Java 8, the Stream API has become a staple of Java development. The basic operations like iterating, filtering, mapping sequences of elements are deceptively simple to use.
But these can also be overused and fall into some common pitfalls.
To get a better understanding on how Streams work and how to combine them with other language features, check out our guide to Java Streams:
Explore Spring Boot 3 and Spring 6 in-depth through building a full REST API with the framework:
Yes, Spring Security can be complex, from the more advanced functionality within the Core to the deep OAuth support in the framework.
I built the security material as two full courses - Core and OAuth, to get practical with these more complex scenarios. We explore when and how to use each feature and code through it on the backing project.
You can explore the course here:
Spring Data JPA is a great way to handle the complexity of JPA with the powerful simplicity of Spring Boot.
Get started with Spring Data JPA through the guided reference course:
Refactor Java code safely — and automatically — with OpenRewrite.
Refactoring big codebases by hand is slow, risky, and easy to put off. That’s where OpenRewrite comes in. The open-source framework for large-scale, automated code transformations helps teams modernize safely and consistently.
Each month, the creators and maintainers of OpenRewrite at Moderne run live, hands-on training sessions — one for newcomers and one for experienced users. You’ll see how recipes work, how to apply them across projects, and how to modernize code with confidence.
Join the next session, bring your questions, and learn how to automate the kind of work that usually eats your sprint time.
Yes, we're now running our only Summer Sale. All Courses are 30% off until 20th July, 2026:
Yes, we're now running our only Summer Sale. All Courses are 30% off until 20th July, 2026:
1. Overview
SonarQube is an open-source and standalone service that gives an overview of the overall health of our source code by measuring code quality and code coverage.
In this tutorial, we’ll cover the process of measuring code coverage using SonarQube and JaCoCo.
2. Description
2.1. Code Coverage
Code coverage, also called test coverage, is a measure of how much of the application’s code has been run in testing. Essentially, it’s a metric that many teams use to check the quality of their tests because it represents the percentage of the production code that has been tested and run.
This gives development teams reassurance that their programs have been broadly tested for bugs and should be relatively error-free.
2.2. SonarQube and JaCoCo
SonarQube inspects and evaluates everything that affects our codebase, from minor styling details to critical design errors. This enables developers to access and track code analysis data ranging from styling errors, potential bugs and code defects, to design inefficiencies, code duplication, lack of test coverage and excess complexity.
It also defines a quality gate, which is a set of measure-based boolean conditions. Additionally, SonarQube helps us to know whether our code is production-ready or not.
SonarQube is used in integration with JaCoCo, a free code coverage library for Java.
3. Maven Configuration
3.1. Download SonarQube
We can download SonarQube from its official website.
To start SonarQube, run the file named StartSonar.bat for a Windows machine or the file sonar.sh for Linux or macOS. The file is in the bin directory of the extracted download.
3.2. Set Properties for SonarQube and JaCoCo
Let’s first add the necessary properties that define the JaCoCo version, plugin name, report path and sonar language:
<properties>
    <!-- JaCoCo Properties -->
    <jacoco.version>0.8.6</jacoco.version>
    <sonar.java.coveragePlugin>jacoco</sonar.java.coveragePlugin>
    <sonar.dynamicAnalysis>reuseReports</sonar.dynamicAnalysis>
    <sonar.jacoco.reportPath>${project.basedir}/../target/jacoco.exec</sonar.jacoco.reportPath>
    <sonar.language>java</sonar.language>
</properties>
The property sonar.jacoco.reportPath specifies the location where the JaCoCo report will be generated.
3.3. Dependencies and Plugins for JaCoCo
The JaCoCo Maven plugin provides access to the JaCoCo runtime agent, which records execution coverage data and creates a code coverage report.
Now let’s have a look at the dependency we’ll add to our pom.xml file:
<dependency>
    <groupId>org.jacoco</groupId>
    <artifactId>jacoco-maven-plugin</artifactId>
    <version>0.8.11</version>
</dependency>
Next, let’s configure the plugin that integrates our Maven project with JaCoCo:
<plugin>
    <groupId>org.jacoco</groupId>
    <artifactId>jacoco-maven-plugin</artifactId>
    <version>${jacoco.version}</version>
    <executions>
        <execution>
            <id>jacoco-initialize</id>
            <goals>
                <goal>prepare-agent</goal>
            </goals>
        </execution>
        <execution>
            <id>jacoco-site</id>
            <phase>package</phase>
            <goals>
                <goal>report</goal>
            </goals>
        </execution>
    </executions>
</plugin>
4. SonarQube in Action
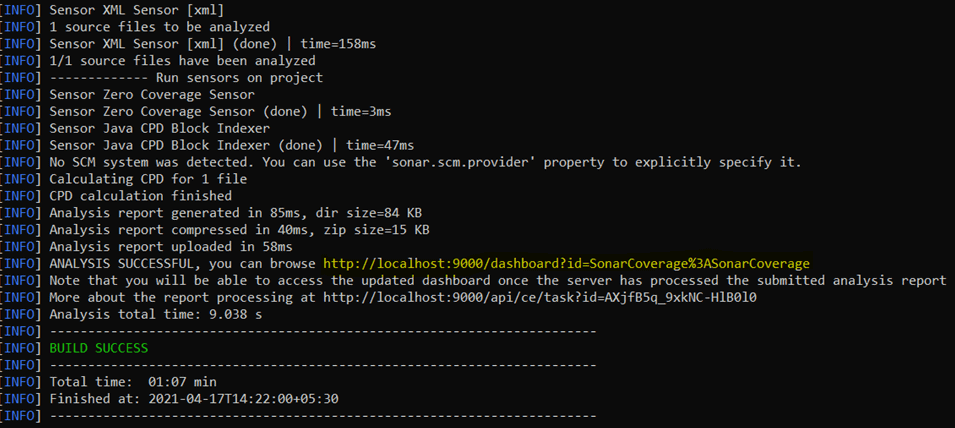
Now that we’ve defined the required dependency and plugin in our pom.xml file, we’ll run mvn clean install to build our project.
Then we’ll start the SonarQube server before running the command mvn sonar:sonar.
Once this command runs successfully, it will give us a link to the dashboard of our project’s code coverage report:
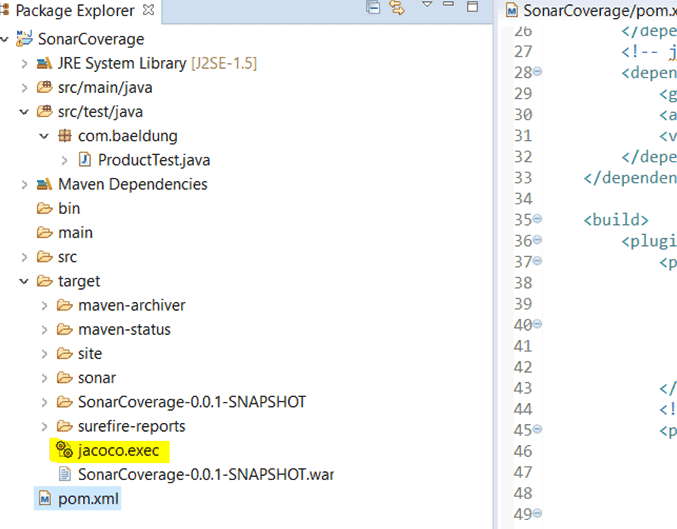
Notice that it creates a file named jacoco.exec in the target folder of the project.
This file is the result of the code coverage that will be further used by SonarQube:
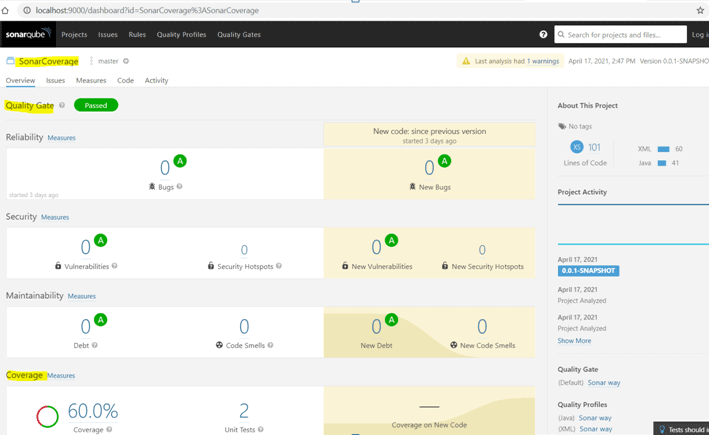
It also creates a dashboard in the SonarQube portal.
This dashboard shows the coverage report with all the issues, security vulnerabilities, maintainability metrics and code duplication blocks found in our code:
5. Conclusion
SonarQube and JaCoCo are two tools that we can use together to make it easy to measure code coverage.
They also provide an overview of the overall health of the source code by finding code duplications, bugs and other issues in the code. This helps us to know whether our code is production-ready or not.


