1. Overview
In this article, we’re going to be looking at static source code analysis with SonarQube – which is an open-source platform for ensuring code quality.
Let’s start with a core question – why analyze source code in the first place? Very simply put, to ensure quality, reliability, and maintainability over the life-span of the project; a poorly written codebase is always more expensive to maintain.
2. Running SonarQube Locally
To run the SonarQube locally you have two possibilities:
3. Generating Token in SonarQube
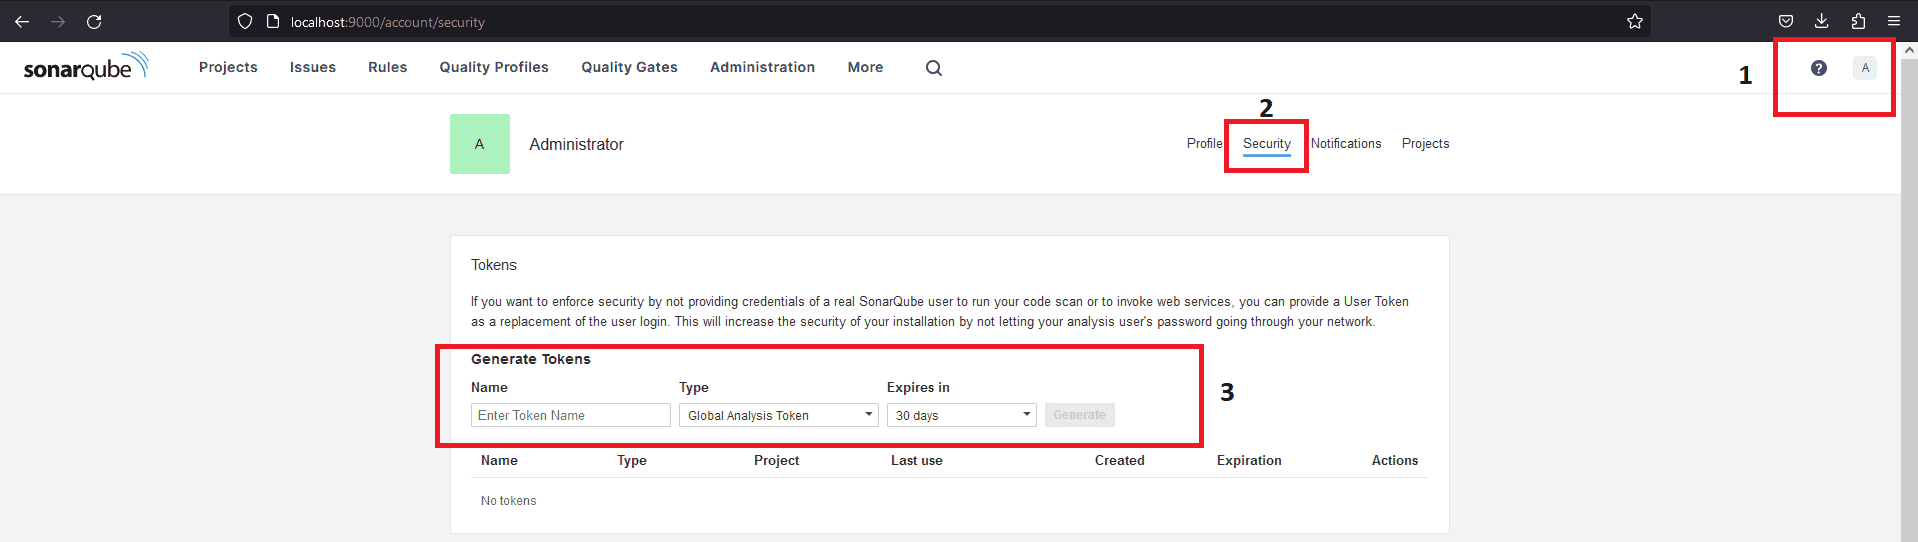
After you followed the previous steps for starting a new SonarQube server, now it’s time to login into it with admin:admin (these are the initial default credentials, and you will be asked to change it).
To be able to use this scanner in your project you have to generate an access token from the SonarQube interface. After you login go to your Account page (http://localhost:9000/account) and select Security tab. From that tab you can generate three types of tokens to use in your project:
- Project Analysis Token – this will be applicable at the project level
- Global Analysis Token – this will be shared between all the projects
- User Token – based on user level access, to which project that user will have access.
4. Analyzing Source Code
We’ll use the generate token later at the point of analyzing our project(s). We also need to select the primary language (Java) and the build technology of the project (Maven).
Let’s define the plugin in the pom.xml:
<build>
    <pluginManagement>
        <plugins>
            <plugin>
                <groupId>org.sonarsource.scanner.maven</groupId>
                <artifactId>sonar-maven-plugin</artifactId>
                <version>3.4.0.905</version>
            </plugin>
        </plugins>
    </pluginManagement>
</build>
The latest version of the plugin is available here. Now, we need to execute this command from the root of our project directory to scan it:
mvn clean verify sonar:sonar -Dsonar.projectKey=PROJECT_KEY
                             -Dsonar.projectName='PROJECT_NAME'
                             -Dsonar.host.url=http://localhost:9000
                             -Dsonar.token=THE_GENERATED_TOKEN
We need to replace project_key, project_name and the-generated-token with the information we set on step 3 and generated access token SonarQube provided earlier.
The project that we used in this article is available here.
We specified the host URL of the SonarQube server and the login (generated token) as parameters for the Maven plugin.
After executing the command, the results will be available on the Projects dashboard – at http://localhost:9000.
There are also other parameters that we can pass to the Maven plugin or even set from the web interface; sonar.host.url, sonar.projectKey, and sonar.sources are mandatory while others are optional.
Other analysis-parameters and their default values are here. Also, note that each language-plugin has rules for analyzing compatible source code.
5. Analysis Result
Now that we’ve analyzed our first project, we can go to the web interface at http://localhost:9000 and refresh the page.
There we’ll see the report summary:
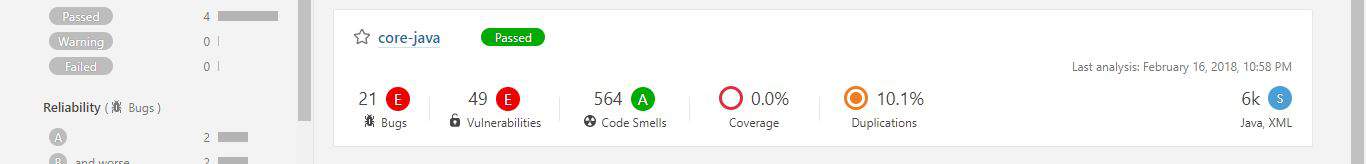
Discovered issues can either be a Bug, Vulnerability, Code Smell, Coverage or Duplication. Each category has a corresponding number of issues or a percentage value.
Moreover, issues can have one of five different severity levels: blocker, critical, major, minor and info. Just in front of the project name is an icon that displays the Quality Gate status – passed (green) or failed (red).
Clicking on the project name will take us to a dedicated dashboard where we can explore issues particular to the project in greater detail.
We can see the project code, activity and perform administration tasks from the project dashboard – each available on a separate tab.
Though there is a global Issues tab, the Issues tab on the project dashboard display issues specific to the project concerned alone:
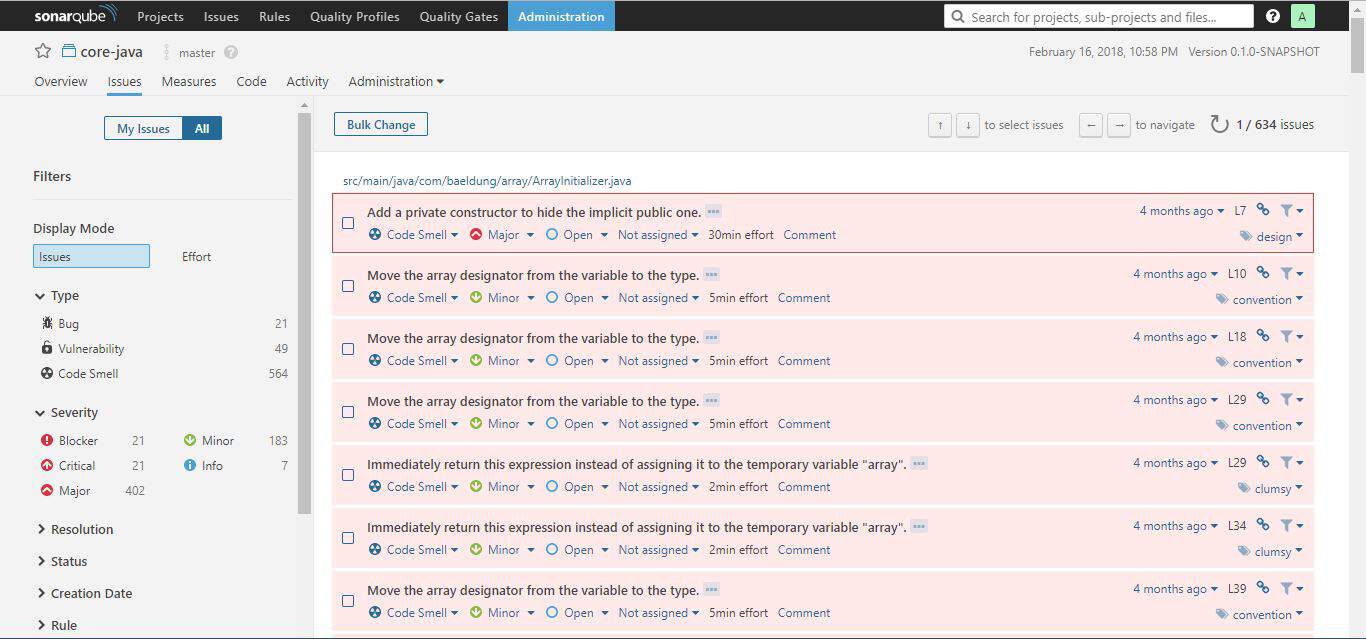
The issues tab always display the category, severity level, tag(s), and the calculated effort (regarding time) it will take to rectify an issue.
From the issues tab, it’s possible to assign an issue to another user, comment on it, and change its severity level. Clicking on the issue itself will show more detail about the issue.
The issue tab comes with sophisticated filters to the left. These are good for pinpointing issues. So how can one know if the codebase is healthy enough for deployment into production? That’s what Quality Gate is for.
6. SonarQube Quality Gate
In this section, we’re going to look at a key feature of SonarQube – Quality Gate. Then we’ll see an example of how to set up a custom one.
6.1. What Is a Quality Gate?
A Quality Gate is a set of conditions the project must meet before it can qualify for production release. It answers one question: can I push my code to production in its current state or not?
Ensuring code quality of “new” code while fixing existing ones is one good way to maintain a good codebase over time. The Quality Gate facilitates setting up rules for validating every new code added to the codebase on subsequent analysis.
The conditions set in the Quality Gate still affect unmodified code segments. If we can prevent new issues arising, over time, we’ll eliminate all issues.
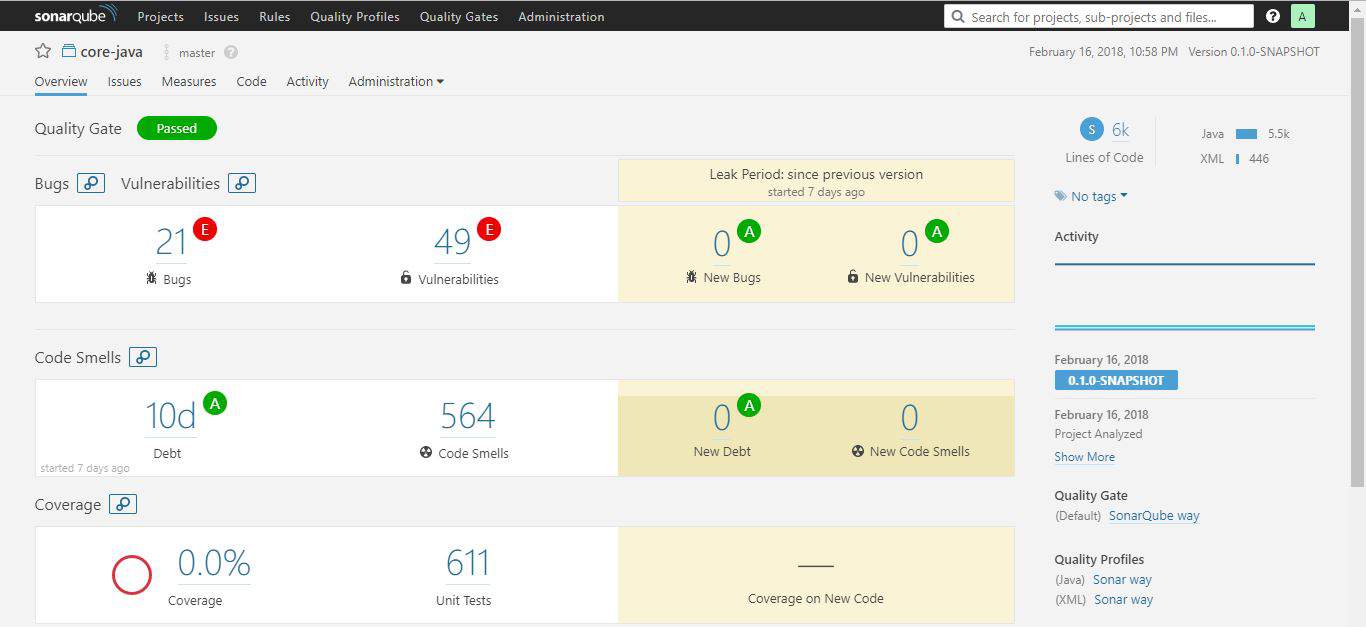
This approach is comparable to fixing the water leakage from the source. This brings us to a particular term – Leakage Period. This is the period between two analyses/versions of the project.
If we rerun the analysis, on the same project, the overview tab of the project dashboard will show results for the leak period:
From the web interface, the Quality Gates tab is where we can access all the defined quality gates. By default, SonarQube way came preinstalled with the server.
The default configuration for SonarQube way flags the code as failed if:
- the coverage on new code is less than 80%
- percentage of duplicated lines on new code is greater than 3
- maintainability, reliability or security rating is worse than A
With this understanding, we can create a custom Quality Gate.
6.2. Adding Custom Quality Gate
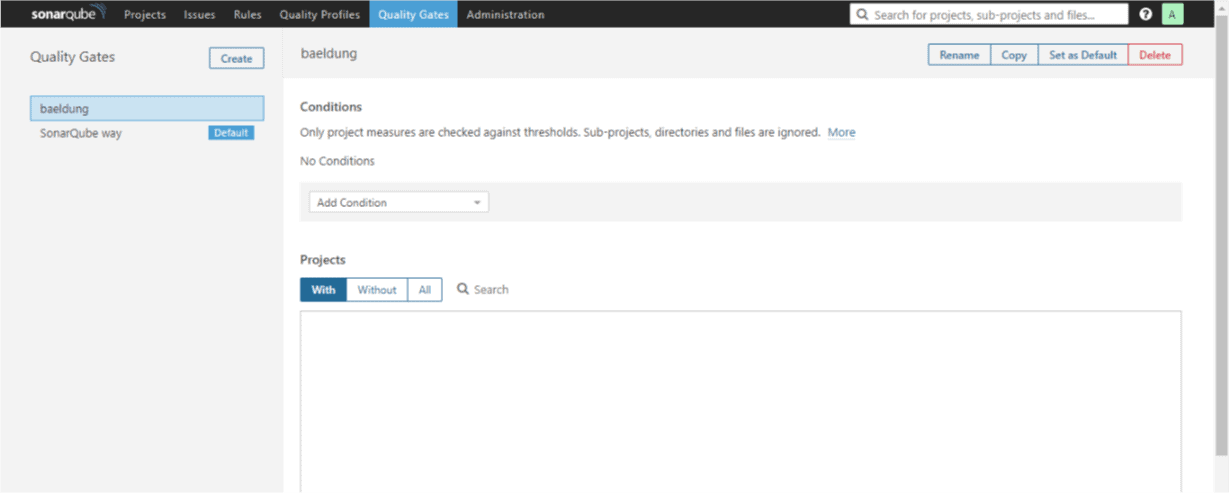
First, we need to click on the Quality Gates tab and then click on the Create button which is on the left of the page. We’ll need to give it a name – baeldung.
Now we can set the conditions we want:
From the Add Condition drop-down, let’s choose Blocker Issues; it’ll immediately show up on the list of conditions.
We’ll specify is greater than as the Operator, set zero (0) for the Error column and check Over Leak Period column:
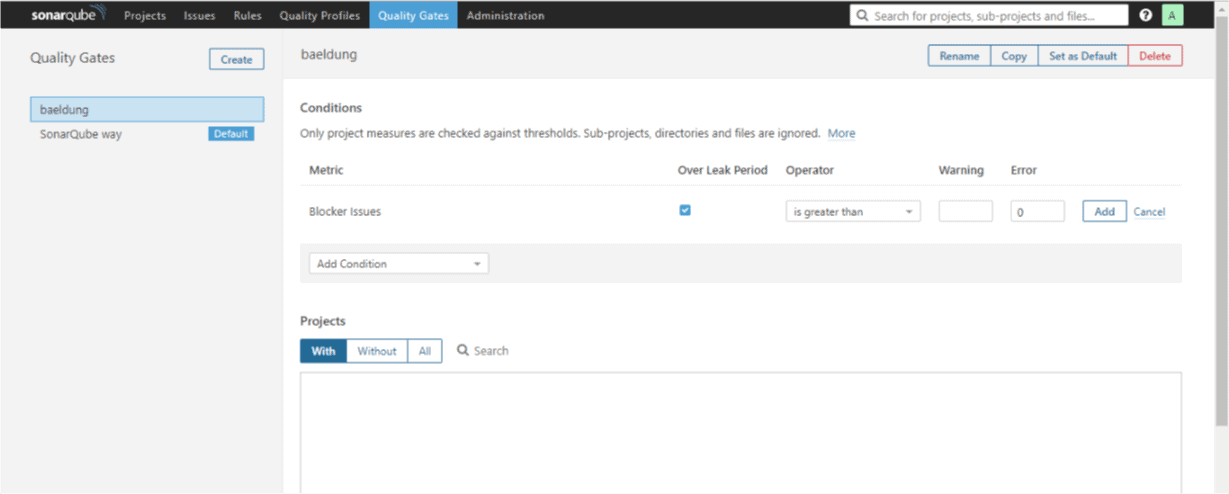
Then we’ll click on the Add button to effect the changes. Let’s add another condition following the same procedure as above.
We’ll select issues from the Add Condition drop-down and check Over Leak Period column.
The value of the Operator column will be set to “is less than” and we’ll add one (1) as the value for the Error column. This means if the number of issues in the new code added is less than 1, mark the Quality Gate as failed.
I know this doesn’t make technical sense but let’s use it for learning sake. Don’t forget to click the Add button to save the rule.
One final step, we need to attach a project to our custom Quality Gate. We can do so by scrolling down the page to the Projects section.
There we need to click on All and then mark our project of choice. We can as well set it as the default Quality Gate from the top-right corner of the page.
We’ll scan the project source code, again, as we did before with Maven command. When that’s done, we’ll go to the projects tab and refresh.
This time, the project will not meet the Quality Gate criteria and will fail. Why? Because in one of our rules we have specified that, it should fail if there are no new issues.
Let’s go back to the Quality Gates tab and change the condition for issues to is greater than. We need to click the update button to effect this change.
A new scan of the source code will pass this time around.
7. Integrating SonarQube into a CI
Making SonarQube part of a Continuous Integration process is possible. This will automatically fail the build if the code analysis did not satisfy the Quality Gate condition.
For us to achieve this, we’re going to be using SonarCloud which is the cloud-hosted version of SonaQube server. We can create an account here.
From My Account > Organizations, we can see the organization key, and it will usually be in the form xxxx-github or xxxx-bitbucket.
Also from My Account > Security, we can generate a token as we did in the local instance of the server. Take note of both the token and the organization key for later use.
In this article, we’ll be using Travis CI, and we’ll create an account here with an existing Github profile. It will load all our projects, and we can flip the switch on any to activate Travis CI on it.
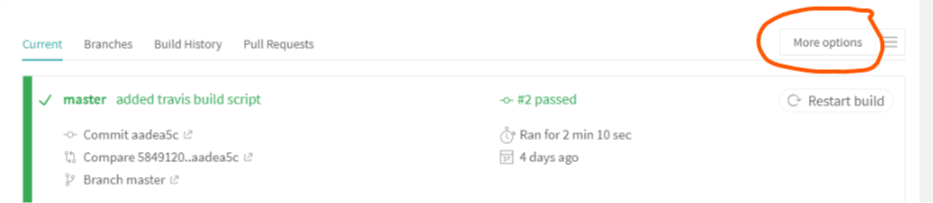
We need to add the token we generated on SonarCloud to Travis environment variables. We can do this by clicking on the project we’ve activated for CI.
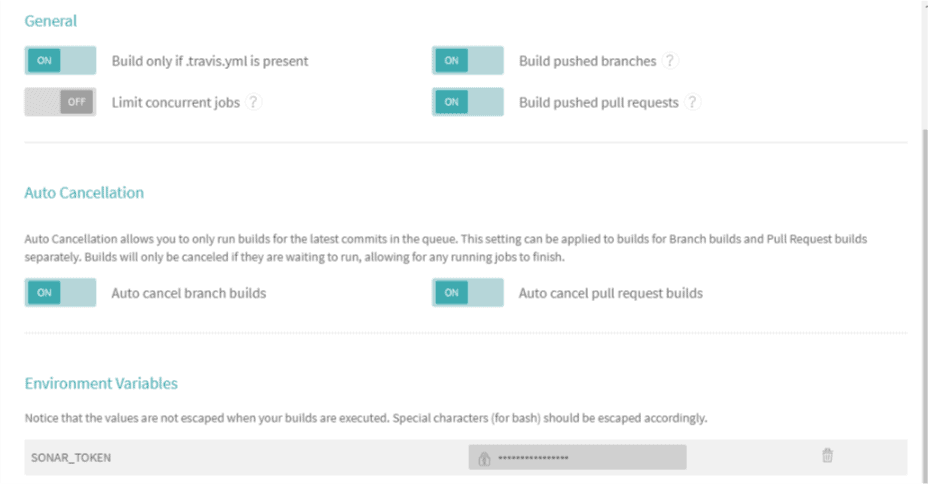
Then, we’ll click “More Options” > “Settings” and then scroll down to “Environment Variables”:
We’ll add a new entry with the name SONAR_TOKEN and use the token generated, on SonarCloud, as the value. Travis CI will encrypt and hide it from public view:
Finally, we need to add a .travis.yml file to the root of our project with the following content:
language: java
sudo: false
install: true
addons:
  sonarcloud:
    organization: "your_organization_key"
    token:
      secure: "$SONAR_TOKEN"
jdk:
  - oraclejdk8
script:
  - mvn clean org.jacoco:jacoco-maven-plugin:prepare-agent package sonar:sonar
cache:
  directories:
    - '$HOME/.m2/repository'
    - '$HOME/.sonar/cache'
Remember to substitute your organization key with the organization key described above. Committing the new code and pushing to Github repo will trigger Travis CI build and in turn activate the sonar scanning as well.
8. Conclusion
In this tutorial, we’ve looked at how to set up a SonarQube server locally and how to use Quality Gate to define the criteria for the fitness of a project for production release.
The SonarQube documentation has more information about other aspects of the platform.