

Yes, we're now running our only Summer Sale. All Courses are 30% off until 20th July, 2026:
Learn through the super-clean Baeldung Pro experience:
>> Membership and Baeldung Pro.
No ads, dark-mode and 6 months free of IntelliJ Idea Ultimate to start with.
1. Overview
In today’s vast digital landscape, network connectivity plays a pivotal role in enabling smooth communication and seamless data transfer. One of the crucial aspects affecting network performance is packet loss, which can degrade the quality of connections and impede data delivery.
For Linux users, understanding and monitoring TCP packet loss can provide valuable insights into network health and assist in troubleshooting connectivity issues. In this tutorial, we’ll explore how to passively monitor TCP packet loss in Linux and delve into the significance of this knowledge.
2. Understanding TCP Packet Loss
Transmission Control Protocol (TCP) is a widely-used transport layer protocol that ensures reliable delivery of data over the Internet. When data is transmitted via TCP, it’s divided into packets, which are then sent across the network. Upon receiving these packets, the recipient acknowledges their successful delivery. However, packet loss occurs when some of these packets fail to reach their destination:
The reasons behind packet loss can vary, including network congestion, hardware issues, or even software misconfigurations.
Let’s see how netstat tracks packet loss by keeping a count of the total number of retransmissions:
$ netstat -s | grep segments
         149840 segments received
         150373 segments sent out
         161 segments retransmitted
         13 bad segments received
We can see the output providing statistics related to TCP segments. Let’s break down each line of the output:
The part of the output stating 149840 segments received indicates the total number of TCP segments that have been received by the system since it was last started or since the network statistics were last reset.
The line 150373 segments sent out shows the total number of TCP segments that have been sent out or transmitted by the system since it was last started or since the network statistics were last reset.
The output line 161 segments retransmitted indicates the number of TCP segments that the system retransmits. Retransmission occurs when the receiving end doesn’t acknowledge the transmitted segment within a certain timeout period.
The part of the output stating 13 bad segments received represents the number of TCP segments that the system receives with errors and considers invalid. These segments may have failed the checksum verification, indicating possible data corruption during transmission.
This problem of bad segments received occurs in several situations when requests become corrupt. For instance, it’s understood as a bad segment if the server gets a probably spoofed SYN request.
In a spoofed SYN request, the attacker fabricates the source IP address in the packet. This makes the request appear as if it originates from a different location or device than the actual sender.
To defend against such TCP-based attacks, Linux employs a challenge ACK mitigation strategy. It helps distinguish legitimate connection attempts from malicious traffic and reduces the impact of such attacks.
3. Passive Monitoring – Why and What
Passive monitoring of TCP packets refers to the practice of observing and analyzing TCP packet traffic on a network without actively interfering with the communication.
It involves capturing and examining network packets in real-time to gain insights into network performance, troubleshoot connectivity issues, and assess the overall health of the network.
Let’s delve into the reasons why passive monitoring of TCP packets is valuable and what it entails.
3.1. Why Monitor TCP Packet Loss Passively?
Monitoring TCP packet loss is essential for several reasons. Firstly, it provides crucial insights into the overall health of a network. By passively monitoring packet loss, administrators can proactively identify and diagnose potential issues, allowing them to take corrective actions before the problem escalates.
Secondly, passive monitoring offers a non-intrusive approach, enabling continuous observation without interfering with the normal flow of network traffic. It allows administrators to gather data without the need for additional network devices or complex configurations, making it a practical choice for real-time analysis.
3.2. Passive Monitoring Techniques
Linux provides several tools and techniques for passively monitoring TCP packet loss. Let’s explore two widely-used methods.
The first method is TCP retransmission analysis. By examining the TCP retransmission packets, we can gain insights into packet loss occurrences.
Tools like Wireshark, tcpdump, and tshark enable packet capture and analysis, helping administrators identify retransmission events, their frequency, and associated network conditions:
$ sudo tcpdump -i any -c 5
tcpdump: verbose output suppressed, use -v or -vv for full protocol decode
listening on any, link-type LINUX_SLL (Linux cooked), capture size 65535 bytes
23:41:21.170389 IP pureapp-180-121.rajasthan.gov.in.ssh > 10.70.245.11.59919: Flags [P.], seq 2287401135:2287401343, ack 819449235, win 193, length 208
23:41:21.170968 IP localhost.localdomain.49085 > localhost.localdomain.domain: 13156+ PTR? 11.245.70.10.in-addr.arpa. (43)
23:41:21.171064 IP pureapp-180-121.rajasthan.gov.in.38000 > adc.rajasthan.gov.in.domain: 39281+ PTR? 11.245.70.10.in-addr.arpa. (43)
23:41:21.171291 IP 10.70.245.11.59919 > pureapp-180-121.rajasthan.gov.in.ssh: Flags [.], ack 208, win 1021, length 0
23:41:21.172977 IP adc.rajasthan.gov.in.domain > pureapp-180-121.rajasthan.gov.in.38000: 39281 NXDomain 0/1/0 (120)
5 packets captured
15 packets received by filter
0 packets dropped by kernel
These tools offer detailed packet-level information, including sequence numbers, timestamps, and other metrics, aiding in troubleshooting efforts.
The second method is Performance Monitoring. Linux provides performance monitoring tools like Netdata, collectd, and Grafana, which offer comprehensive network statistics and performance metrics.
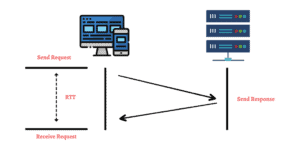
By monitoring parameters like Round-Trip Time (RTT), retransmission rate, and congestion window fluctuations, administrators can evaluate packet loss rates and identify potential bottlenecks or network anomalies:
4. Interpreting Results and Taking Actions
Once TCP packet loss has been passively monitored, it’s crucial to interpret the results accurately and take appropriate actions.
Analyzing packet loss patterns, such as recurring time frames or specific network segments, can reveal valuable identifying patterns about potential causes. This analysis aids in pinpointing problematic areas and facilitates targeted troubleshooting.
Actively engaging with network administrators, discussing findings, and sharing insights can enhance the collective understanding of network performance. Collaborative efforts and shared knowledge can lead to better diagnosis and resolution of packet loss issues.
With the knowledge gained from passive monitoring, administrators can optimize network configurations, such as adjusting TCP window sizes or implementing Quality of Service (QoS) mechanisms. These optimizations can mitigate packet loss and improve overall network performance.
5. Conclusion
In this article, we learned how passively monitoring TCP packet loss in Linux empowers administrators with valuable insights into network performance.
By using tools and techniques like TCP retransmission analysis and performance monitoring, administrators can identify and diagnose packet loss occurrences. This ensures proactive troubleshooting and network optimization.
Understanding packet loss patterns and collaborating with peers further enhances the ability to maintain a robust and reliable network infrastructure.