

Yes, we're now running our only Summer Sale. All Courses are 30% off until 20th July, 2026:
Finding Out Why a Network Interface Is Dropping Packets
Last updated: July 18, 2025
Learn through the super-clean Baeldung Pro experience:
>> Membership and Baeldung Pro.
No ads, dark-mode and 6 months free of IntelliJ Idea Ultimate to start with.
1. Introduction
Packet drops are a common cause of connectivity issues and network performance degradation. They happen when data packets fail to reach their destination. To ensure uninterrupted network operation, it’s crucial to identify and fix the cause.
In this tutorial, we’ll discuss the steps to troubleshoot packet drops. We used Ubuntu 20.04 LTS as the testing environment.
2. Packet Drops
A network interface card (NIC) is the hardware component that connects a device to a network and is responsible for sending and receiving data packets.
A NIC drops packets when it receives more packets than it can process or encounters a corrupt packet, resulting in data loss:
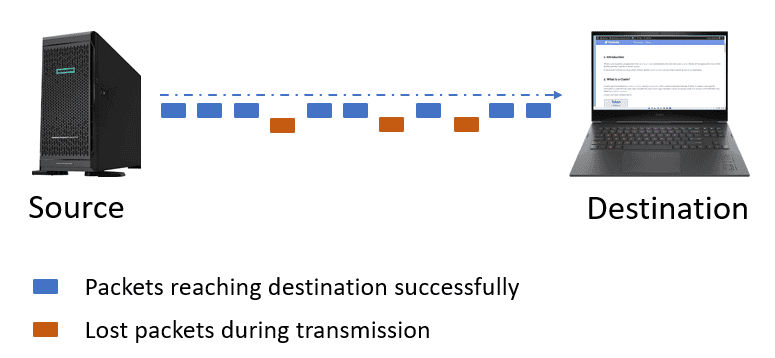
An incomplete or delayed data transmission impacts the user experience. To mitigate these issues, it’s crucial to implement robust error-checking mechanisms and optimize network infrastructure to ensure reliable data transmission.
2.1. Impact
Packet drops have varying effects on different applications. For instance, a 5% drop rate during file downloads can increase download times.
The impact on real-time applications, such as voice and video conferencing, is more significant. A user typically notices packet drops of even 3%, making the conversation frustrating.
In general, a packet drop rate of at least 5% is considered high and can significantly affect user experience and network performance.
3. What Are the Factors Contributing to Packet Drops?
Several factors can cause packet drops.
3.1. Overloaded Network Interface
An overloaded NIC may occur during high network usage. NICs experience this problem when they receive more traffic than they can handle.
We can use ifconfig or ip -s link to check RX/TX statistics and dropped packets. The following snippet shows the output when we run ip -s link:
$ ip -s link
...
2: enp0s3: <BROADCAST,MULTICAST,UP,LOWER_UP> mtu 1500 qdisc pfifo_fast state UP mode DEFAULT group default qlen 1000
RX: bytes packets errors dropped overrun mcast
1876723   25342   0      123     0       12
TX: bytes packets errors dropped carrier collsns
1032432   15432   0      0       0       0
...
Here, 2: is the interface index, and enp0s3 is the name of the NIC. When we run ip -s link, we don’t use sudo, as it only retrieves interface statistics.
High values in the “dropped” column under RX or TX may indicate an overloaded NIC.
So, let’s use ethtool to analyze NIC performance:
$ sudo ethtool -S enp0s3
NIC statistics:
rx_packets: 1234567
tx_packets: 987654
rx_errors:  0
tx_errors:  2
rx_dropped: 45
tx_dropped: 10
collisions: 0
rx_over_errors: 0
tx_heartbeat_errors: 0
rx_missed_errors: 5
tx_aborted_errors: 1
The output provides information about packets dropped at the receiving/transmitting end. High rx_over_errors or rx_missed_errors indicate an overloaded interface, while high values of x_aborted_errors or tx_timeout_count indicate driver problems. If other values are high, we should check system logs for error messages related to the NIC, as they can provide information about driver crashes, firmware issues, or hardware faults.
3.2. Faulty Hardware
Hardware issues such as broken switch ports, damaged cables, or faulty NICs can also lead to packet drops.
We can use ethtool to test NIC hardware:
$ sudo ethtool enp0s3
Settings for enp0s3:
Supported ports: [ TP MII ]
Supported link modes: 10baseT/Half 10baseT/Full
100baseT/Half 100baseT/Full
1000baseT/Full
Supported pause frame use: Symmetric
Supports auto-negotiation: Yes
Advertised link modes: 1000baseT/Full
Advertised pause frame use: Symmetric
Advertised auto-negotiation: Yes
Speed: 1000Mb/s
Duplex: Full
Port: Twisted Pair
PHYAD: 1
Transceiver: internal
Auto-negotiation: on
MDI-X: off (auto)
Link detected: yes
The output provides detailed information about the network interface enp0s3. If “Link detected” shows “no,” the hardware connection may be faulty.
We can use dmesg to check for hardware-related errors. Here’s an example:
$ dmesg | grep -i "nic"
[ 123.456789] e1000e: enp0s3 NIC Link is Up 1000 Mbps Full Duplex
[ 124.123456] e1000e: NIC Link is Down
[ 125.654321] e1000e: NIC Link is Up 100 Mbps Half Duplex
Let’s interpret it line by line.
[ 123.456789] e1000e: enp0s3 NIC Link is Up 1000 Mbps Full DuplexTimestamp “123.456789” indicates when the event occurred w.r.t. to the system boot time. A successful connection with a speed of 1000 Mbps and Full Duplex mode was established.
[ 124.123456] e1000e: NIC Link is DownThis line indicates that the NIC lost its connection, which could be due to faulty hardware, a cable issue, or network configuration problems.
The following table summarizes the steps for troubleshooting faulty hardware conditions:
| Action | Purpose |
|---|---|
| Check Cables and Connectors | Ensure that all cables and connectors are securely plugged in and not physically damaged. |
| Examine NIC Settings with ethtool | Use ethtool to check NIC settings for errors or misconfigurations. |
| Review System Logs with journalctl -k | Analyze system logs for messages like “Link is Down” to identify specific hardware or software issues. |
| Replace or Repair Components | If issues persist, replace or repair any faulty hardware components, such as the NIC, cables, or connectors. |
3.3. Driver Issues
Outdated or incompatible drivers can interfere with NIC functionality. We can use lsmod | grep <driver_name> to check the driver of interest:
e1000e 126976 0Here, e1000e 126976 indicates the loaded NIC driver module, whose size is 126976 bytes. Usage count 0 indicates that there are no active processes currently using this module. To check it further, we can use modinfo:
$ modinfo e1000e
filename: /lib/modules/5.4.0-91-generic/kernel/drivers/net/ethernet/intel/e1000e/e1000e.ko
version: 3.2.6-k
license: GPL
description: Intel(R) PRO/1000 Network Driver
author: Intel Corporation, <[email protected]>
srcversion: D4143F23A8B782DAFB3AB89
alias: pci:v00008086d000015A3sv*sd*bc*sc*i*
alias: pci:v00008086d000015A2sv*sd*bc*sc*i*
depends:
retpoline: Y
intree: Y
name: e1000e
vermagic: 5.4.0-91-generic SMP mod_unload modversions
Output helps us verify the driver version and determine compatibility. In general, if we find that the driver is outdated, we should update it.
3.4. Network Configuration Errors
Misconfigurations such as duplex mismatches can cause packet drops. We’ll use the ethtool to verify duplex settings:
$ sudo ethtool enp0s3
Speed: 1000Mb/s
Duplex: Full
The above output is only showing the fields that are directly relevant to network problems, such as speed and duplex settings.
We must ensure both ends of the connection are set to “Full Duplex.” This will avoid collisions and degraded network performance.
If the duplex mode is not set to “Full” we can manually configure it using ethtool:
$ sudo ethtool -s enp0s3 speed 1000 duplex full autoneg offHere, enp0s3 is the name of the network interface.
The next step is to test the connection to ensure there are no duplex mismatches.
We’ll ping to check for packet drops or performance issues:
$ ping baeldung.com
Pinging baeldung.com [2606:4700:8397:a477:6e39:5f9:d6da:e74e] with 32 bytes of data:
Reply from 2606:4700:8397:a477:6e39:5f9:d6da:e74e: time=5ms
Reply from 2606:4700:8397:a477:6e39:5f9:d6da:e74e: time=8ms
Reply from 2606:4700:8397:a477:6e39:5f9:d6da:e74e: time=4ms
Reply from 2606:4700:8397:a477:6e39:5f9:d6da:e74e: time=5ms
Ping statistics for 2606:4700:8397:a477:6e39:5f9:d6da:e74e:
Packets: Sent = 4, Received = 4, Lost = 0 (0% loss),
Approximate round trip times in milli-seconds:
Minimum = 4ms, Maximum = 8ms, Average = 5ms
0% loss means no packet loss.
3.5. Software Issues
Applications consuming excessive bandwidth or buggy software can contribute to packet drops. We can use top or iftop to analyze resource usage.
iftop is better for diagnosing packet drops and upstream network problems since it can get packet drops or retransmission probability based on traffic patterns. Here’s a sample output:
$ sudo iftop -i wlan0
                 1.33Mb            2.67Mb            4.00Mb
+-----------------+-----------------+-----------------+
Total send rate:    2.33Mb
Total receive rate: 1.11Mb
Total bandwidth:    3.44Mb
=======================================================================
10.0.0.1      => 10.0.0.2          1.50Mb   1.20Mb   1.60Mb
              <=                   0.80Mb   0.90Mb   1.00Mb
10.0.0.1 => 8.8.8.8                0.80Mb   0.50Mb   0.30Mb
              <=                   0.30Mb   0.20Mb   0.10Mb
=======================================================================
Total send rate and total receive rate measure bandwidth consumption for outgoing and incoming traffic, respectively.
We check send and receive rates to identify connections consuming excessive bandwidth, which might indicate a problem upstream or retransmissions due to packet drops.
3.6. External Interference in Wireless Networks
Wireless networks may experience interference from physical barriers or other devices.
We can use iw to get information from an external network (let’s say “wlan0”). This displays the current configuration of wlan0, including ESSID, mode, frequency, signal strength, etc:
$ iw dev wlan0 link
Connected to 00:1A:2B:3C:4D:5E (on wlan0)
SSID: MyWiFi
freq: 2412
signal: -60 dBm
tx bitrate: 72.2 MBit/s
The signal field reflects the quality of connectivity, and a value close to 0 denotes a stronger signal.
3.7. Overloaded Buffers
Packet drops may also happen when the kernel’s socket buffers are full, particularly when there is a lot of network congestion. This is common since UDP traffic doesn’t have internal retransmission capabilities. A bigger buffer capacity or improved program behavior can mitigate this problem.
To set receive buffer and transmit buffer sizes, we can do:
# Receive buffer reset sysctl -w net.core.rmem_max=16777216 sysctl -w net.core.rmem_default=8388608 # Transmit buffer resetsysctl -w net.core.wmem_max=16777216 sysctl -w net.core.wmem_default=8388608 # Apply above receive and transmit buffer changes sysctl -p
Packet drops can also occur at the NIC level if the receive buffers are overloaded. Changing NIC settings or upgrading hardware can resolve this issue.
3.8. Firewall Issues
An incorrect setting or excessively strict policy can result in unintentional packet drops.
Sometimes, firewalls purposefully lose packets by limiting the traffic that comes from certain IP addresses. Security or network policies often require this.
To change policies, we can use iptables:
$ iptables -L -v

Chain INPUT (policy ACCEPT 1234 packets, 678901 bytes)
pkts bytes target prot opt in out source destination
456 7890 ACCEPT all -- lo * 0.0.0.0/0 0.0.0.0/0
3456 123456 DROP tcp -- * * 192.168.1.0/24 0.0.0.0/0

Chain FORWARD (policy DROP 0 packets, 0 bytes)
pkts bytes target prot opt in out source destination
0 0 ACCEPT all -- * * 10.0.0.0/8 10.0.0.0/8

Chain OUTPUT (policy ACCEPT 5678 packets, 789012 bytes)
pkts bytes target prot opt in out source destination
Chain forward manages forwarded traffic, Chain output manages outgoing traffic, and Chain input handles incoming traffic.
Each rule contains information on the number of packets and bytes processed (pkts/bytes), the action performed (target), the protocol used (prot), and the source or destination addresses.
This combination of components determines how traffic across the network behaves and how the firewall manages it.
Let’s take an example to allow traffic from a specific IP 2606:4700:8397:a477:6e39:495:d6da:e74e (baeldung.com):
$ iptables -A INPUT -s <2606:4700:8397:a477:6e39:495:d6da:e74e> -j ACCEPT

# Save and apply changes
service iptables save
This allows any traffic from baeldung.com through the firewall. However, this change must be consistent with our network’s security policy.
3.9. Upstream Switch/Router Issues
Let’s assume everything is okay with the user‘s hardware and configuration, but there are problems upstream on the switch or router causing packet drops.
We can determine if packet drops come from upstream by using tcpdump:
$ sudo tcpdump -i <interface> -vv
21:10:01.123456 IP (tos 0x0, ttl 64, id 10234, offset 0, flags [DF], proto TCP (6), length 60)
192.168.1.5.12345 > 192.168.1.1.80: Flags [S], seq 0, win 65535, options [mss 1460,sackOK,TS val 345678 ecr 0,nop,wscale 7], length 0
21:10:03.234567 IP (tos 0x0, ttl 64, id 10235, offset 0, flags [DF], proto TCP (6), length 52)
192.168.1.1.80 > 192.168.1.5.12345: Flags [S.], seq 12345678, ack 1, win 65535, options [mss 1460,sackOK,TS val 345679 ecr 345678], length 0

21:10:05.345678 IP (tos 0x0, ttl 64, id 20456, offset 0, flags [DF], proto ICMP (1), length 64)
192.168.1.1 > 192.168.1.5: ICMP host 8.8.8.8 unreachable, length 36

21:10:07.456789 IP (tos 0x0, ttl 64, id 30247, offset 0, flags [DF], proto TCP (6), length 60)
192.168.1.5.12345 > 192.168.1.1.80: Flags [S], seq 100, win 65535, options [mss 1460,sackOK,TS val 345789 ecr 0,nop,wscale 7], length 0
21:10:07.456789 IP (tos 0x0, ttl 64, id 30247, offset 0, flags [DF], proto TCP (6), length 60)
192.168.1.5.12345 > 192.168.1.1.80: Flags [S], seq 100, win 65535, options [mss 1460,sackOK,TS val 345789 ecr 0,nop,wscale 7], length 0

21:10:09.567890 IP (tos 0x0, ttl 1, id 40567, offset 0, flags [DF], proto ICMP (1), length 92)
192.168.1.5 > 8.8.8.8: ICMP time exceeded in-transit, length 64
We search for patterns or abnormalities in the output, such as duplicate packets, destination unreachable, time exceeded, and a considerable lag between the SYN packet & SYN-ACK.
In the above output:
- ICMP host 8.8.8.8 unreachable indicates the upstream router can’t connect to the given host.
- ICMP time exceeded in-transit indicates the upstream router issue
Additionally, packet drops occur when a packet’s sequence is missing. Abnormal packet arrivals may indicate load balancing or improperly configured upstream equipment.
4. Conclusion
In this article, we discussed packet drops, which occur when data packets traverse a network but fail to reach their destinations.
There may be several reasons, including hardware malfunctions, software faults, and network congestion can cause packet drops.