
Learn through the super-clean Baeldung Pro experience:
>> Membership and Baeldung Pro.
No ads, dark-mode and 6 months free of IntelliJ Idea Ultimate to start with.
Learn through the super-clean Baeldung Pro experience:
>> Membership and Baeldung Pro.
No ads, dark-mode and 6 months free of IntelliJ Idea Ultimate to start with.
The Graphic Processing Unit (GPU) is a powerful device whose applications go far beyond supporting graphics. To some extent, we can regard the GPU as an independent computation unit inside our computer. Therefore, we need special tools for monitoring it.
In this tutorial, we’ll learn commands to report the NVIDIA GPU state.
Before we monitor the GPU, let’s devise a way to load it. Because the GPU discerns the graphic and compute modes of use, we must find programs that run in each of them.
Assuming that we installed the CUDA toolbox with the nvcc compiler, we can utilize NVIDIA code examples to load GPU in the compute mode. Let’s download the code from GitHub and extract it in the ~/prj/cuda folder. Afterward, we can move to the watershedSegmentationNPP folder:
$ cd ~/prj/cuda/cuda-samples-master/Samples/4_CUDA_Libraries/watershedSegmentationNPPThis application implements the watershed segmentation algorithm, which is widely used in medical imaging. Then, let’s build the program with make:
$ makeAs a single run of this program is short, we need to execute it in the infinite loop:
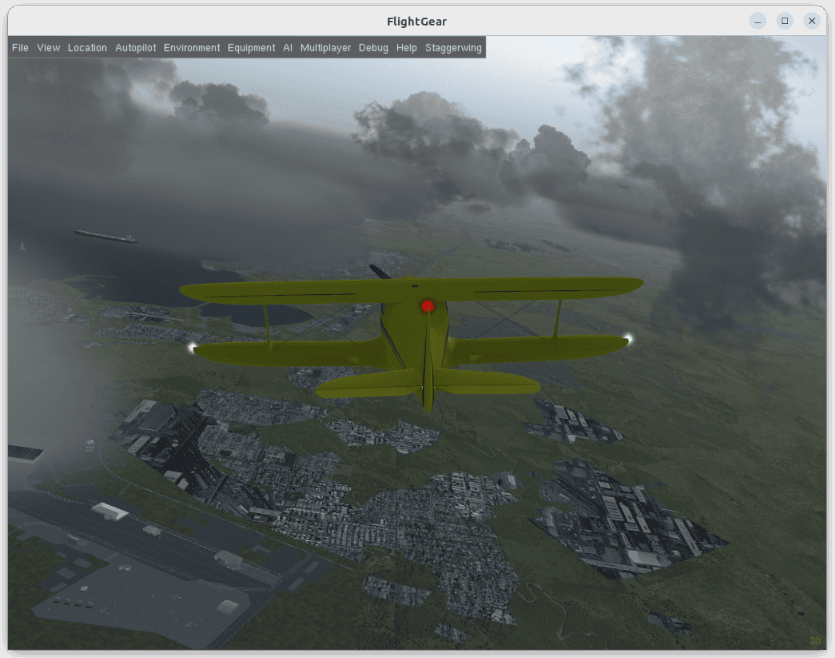
$ while true; do ./watershedSegmentationNPP > \dev\null 2>&1; doneTo add pressure in the graphic mode, let’s install the FlightGear flight simulator:
$ sudo apt install flightgearThen, we can take a trip over the Keflavik airport on a Beechcraft Staggerwing:
nvidia-smi is an NVIDIA tool to monitor and control the GPU(s). For the current state of GPU, let’s issue:
$ nvidia-smi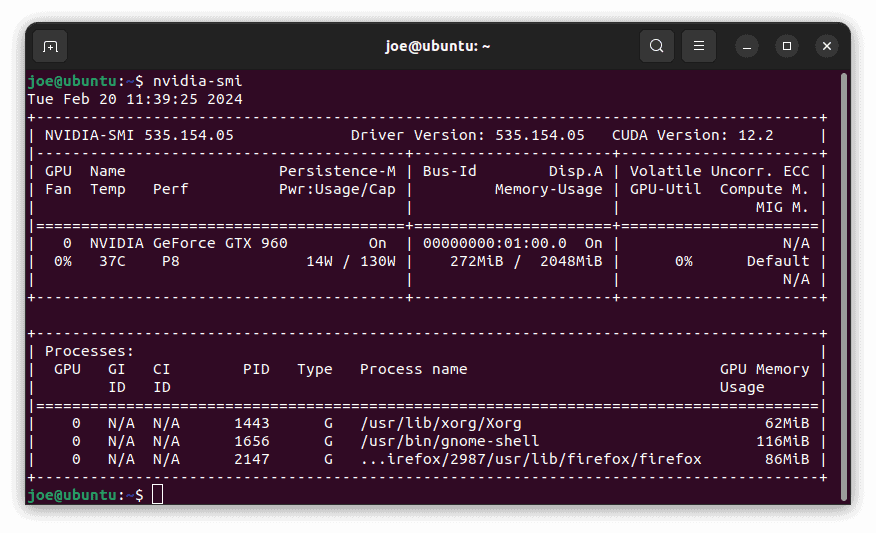
First, we’re provided with the GPU details. Then comes the current state of the GPU, such as fan utilization, temperature, or power draw, to name only a few. In the lower panel, the processes running on the GPU are shown, where fgfs stands for FlightGear. Note the ‘Type’ column, which informs if the task uses the graphic or compute mode, denoted by G or C, respectively. Additionally, a process that runs in both modes simultaneously is marked by G+C.
If we want to track the GPU state over time, let’s use one of the -l or -lms options. The former accepts a refresh interval in seconds, while the latter takes milliseconds:
$ nvidia-smi -l 2 # snapshot every two seconds
$ nivida-smi -lms 250 # snapshot every 250 millisecondsThe nvtop program is the GPU equivalent of a well-known top command. We need to install it, e.g., with apt on Ubuntu:
$ sudo apt install nvtopThe command provides a nice, real-time summary of the GPU state and processes. The plot shows the GPU workload and memory utilization:
$ nvtop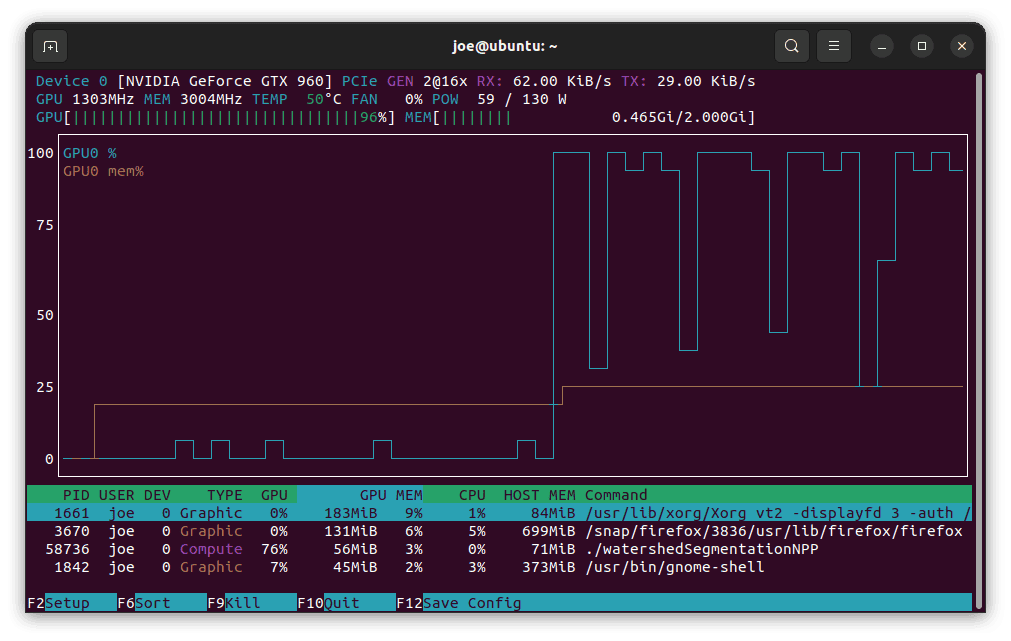
The plot can be disabled with the -p option. Next, we can change the refresh interval by employing the -d option. It uses a tenth of a second as a time unit. So, to refresh every half a second, we should issue:
$ nvtop -d 5Finally, note that nvtop claims support for GPUs from brands other than NVIDIA.
Another tool to monitor GPU is gpustat. On Ubuntu, we can install it with apt:
$ sudo apt install gpustatLet’s start gpustat with the –watch option for real-time statistics:
$ gpustat --watch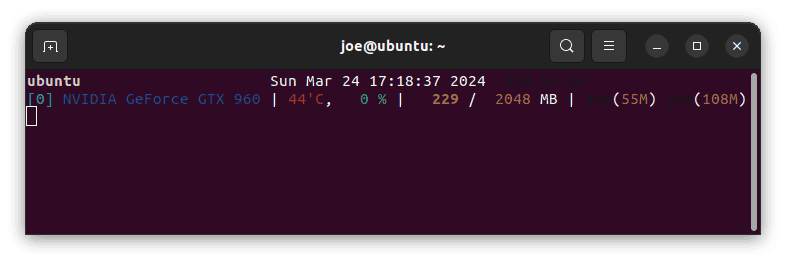
This basic output provides us with the GPU index and GPU name first. Then comes figures: temperature, GPU workload, and memory usage. For more detail, we can use the options:
$ gpustat -FP -ucp --watch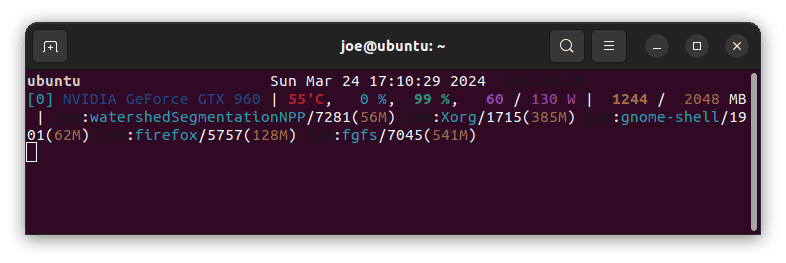
The -F option stands for fan speed, the blue zero-valued number in the screenshot above. Next, we use -P to display power consumption in magenta. With –u, –c, and –p, we list GPU processes. These switches mean user, command, and process ID, respectively.
Yet another GPU monitor is nvitop. Let’s install it with pip:
$ pip install --upgrade nvitopThen, we’ll obtain an elegant, real-time output by issuing:
$ nvitop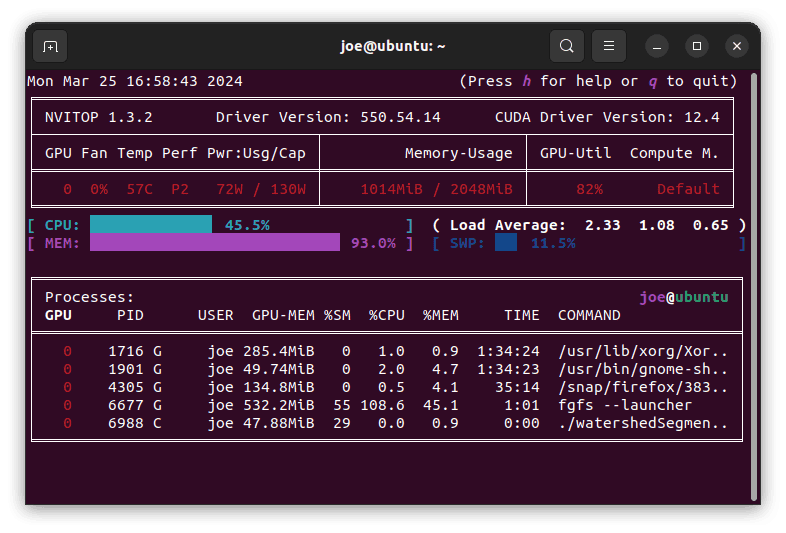
The type of the GPU process, G or C, is shown immediately after its PID.
We can check many GPU environment features using options for nvidia-smi.
Let’s use the -q options to obtain information concerning the GPU. When we issue it alone, we get a long list of features:
$ nvidia-smi -q

==============NVSMI LOG==============

Timestamp                                 : Sun Mar 24 08:52:45 2024
Driver Version                            : 550.54.14
CUDA Version                              : 12.4

Attached GPUs                             : 1
GPU 00000000:01:00.0
    Product Name                          : NVIDIA GeForce GTX 960
# ...
    FB Memory Usage
        Total                             : 2048 MiB
        Reserved                          : 59 MiB
        Used                              : 341 MiB
        Free                              : 1647 MiB
# ...
    Temperature
# ...
    GPU Power Readings
# ...
    Max Clocks
# ...
# ...
    Processes
# ...
Instead of wading through this list, we can reach a specific feature by adding the -d option. It takes one or more keywords. So, let’s target the temperature and power:
$ nvidia-smi -q -d TEMPERATURE,POWER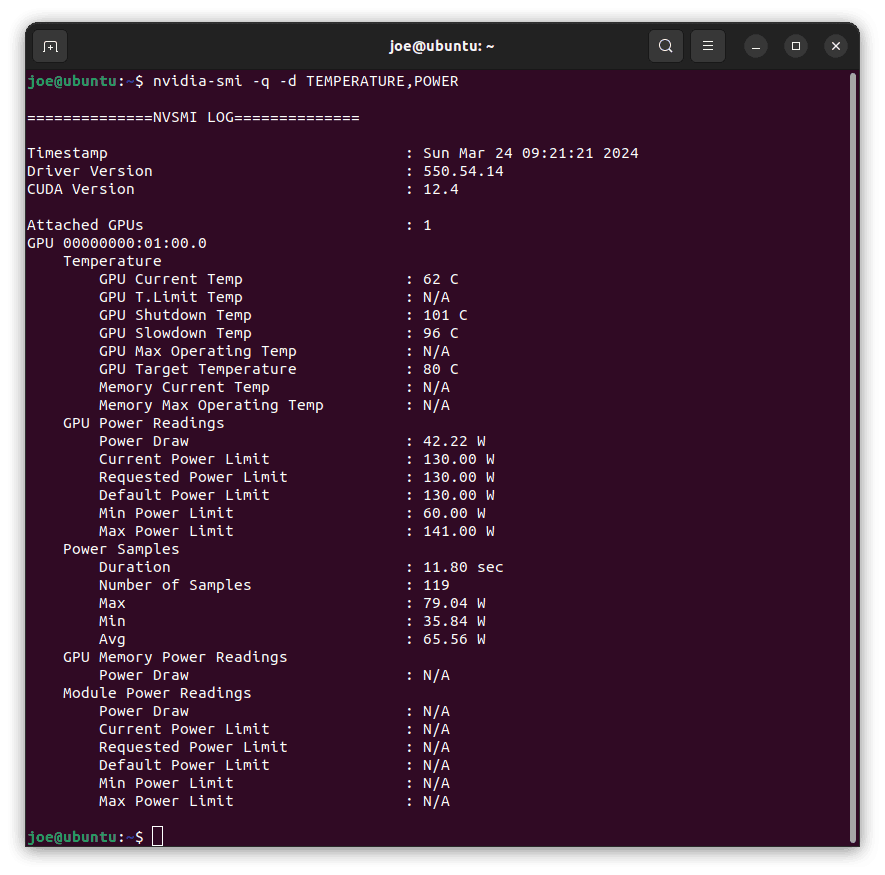
We can explicitly refer to a specific property using a bunch of options with names starting with ‘query’. For example, –query-gpu= examines our GPU. So, let’s check the amount of its total and free memory:
$ nvidia-smi --query-gpu=memory.total,memory.free --format=csv
memory.total [MiB], memory.free [MiB]
2048 MiB, 1621 MiB
The memory.total and memory.free labels correspond to the tree shown by the general nvidia-smi -q command. For information about supported features, we can ask nvidia-smi for help:
$ nvidia-smi --help-query-gpuAnother interesting query switch is –query-compute-apps= to list the active computational tasks:
$ nvidia-smi --query-compute-apps=pid,process_name --format=csv
pid, process_name
58478, ./watershedSegmentationNPP
Once again, for more details, let’s use the command’s help:
$ nvidia-smi --help-query-compute-appsFinally, let’s add that we can combine most of the nvidia-smi options with -l or -lms to obtain a real-time view. As an example, let’s display the memory statistics every second:
$ nvidia-smi -l 1 --query-gpu=memory.total,memory.free --format=csvAll applications presented so far display information about GPU processes. However, it’s sometimes useful to make an independent check. To do so, we can list the processes which use the nvidia device files in the /dev folder. So, let’s use the fuser command:
$ sudo fuser -v /dev/nvidia*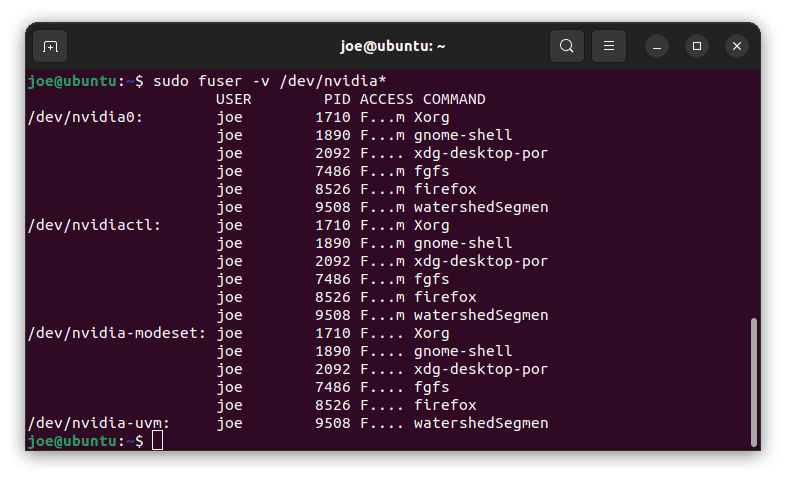
In this tutorial, we learned how to examine the NVIDIA GPU. First, we check the GPU using the NVIDIA-provided nvidia-smi command. Then, we presented a list of text-based monitor programs, nvtop, gpustat, and nvitop.
Next, we focused on detailed queries of GPU properties with nvidia-smi. Finally, via device files, we conducted an alternative search for processes that used GPU.
We performed all tests after loading the GPU with both graphic and computation tasks.