

Yes, we're now running our only Summer Sale. All Courses are 30% off until 20th July, 2026:
Learn through the super-clean Baeldung Pro experience:
>> Membership and Baeldung Pro.
No ads, dark-mode and 6 months free of IntelliJ Idea Ultimate to start with.
1. Introduction
Network diagrams are used for a visual representation when planning and illustrating network structures, project management task sequences, data flow processes, and other educational materials to make the matter easier to understand.
In this tutorial, we’ll explore various ways to create a network diagram in Linux using different tools.
First, we’ll look into a command-line diagram generator in Linux. After that, we’ll discuss several desktop-based editors. Lastly, we’ll discuss online tools to create network diagrams.
For this tutorial, we’ll use the words diagram, graph, and chart interchangeably.
2. Using Graphviz
A basic way to create a network diagram in Linux is to use the Graphviz tool.
Graphviz is a command-line tool that we use to generate diagrams from textual descriptions. It’s specifically used for creating graph-based diagrams which include network topologies.
It’s crucial to note that Graphviz isn’t a command-line editor itself, but rather a command-line tool to generate diagrams from text.
2.1. Install graphviz
First, we install graphviz using the APT package manager:
$ sudo apt-get install graphvizOnce the installation is complete, we’ll create a graphviz file.
2.2. Create graphviz File
Next, we create a file with the dot extension. The .dot extension typically hints at a Graphviz DOT file. Once we create the file, we can add the code to generate a network diagram.
Let’s use the cat command to view the file content:
$ cat networkDiagram.dot
digraph G {
A -> B -> C;
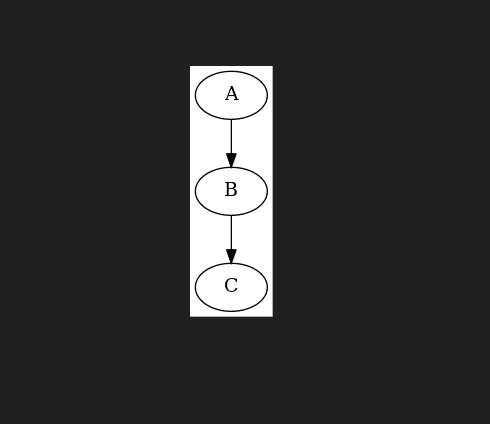
}To create a network diagram, we use the digraph keyword and generate a directed graph G. After that, we add the elements of the graph we want to visualize. Following the prescribed format is crucial – this means starting with the keyword digraph.
Then, we produce a directed graph from node A to B, and from B to C, by writing the node names with edges between them in the form of -> arrows.
2.3. Generate graphviz Diagram
Now, we generate the visual representation of networkDiagram.dot:
$ dot -Tpng -O networkDiagram.dotTo visualize the diagram, we use the dot command, followed by the required arguments:
- -Tpng specifies the desired output format
- -O instructs the dot to save the file rather than display it on the screen
Let’s look at the visual representation of the network diagram:
We can also use different formats to export the network graph. To explore more options about the graphviz tool, we can use the man command.
3. Using Desktop-Based Editors
Desktop-based editors provide a user-friendly and versatile solution for designing network diagrams on the Linux platform. In this section, we’ll discuss using such editors to create network diagrams.
3.1. LibreOffice
Another approach we can use to draw network graphs is LibreOffice.
LibreOffice is a free and open-source office suite that includes a drawing application called LibreOffice Draw. It’s not specifically designed for network diagrams but we can create basic shapes within it.
LibreOffice is often included in Linux distributions by default. If it’s not available, we install LibreOffice using the apt command:
$ sudo apt-get install libreofficeOnce the installation is complete, we can open the LibreOffice Draw application by clicking the Activities panel. Next, we’ll type LibreOffice in the search bar and hit the Return key.
There might be no templates available for network diagrams in LibreOffice Draw. To create a diagram, we select the objects from the toolbar and start drawing a network graph:
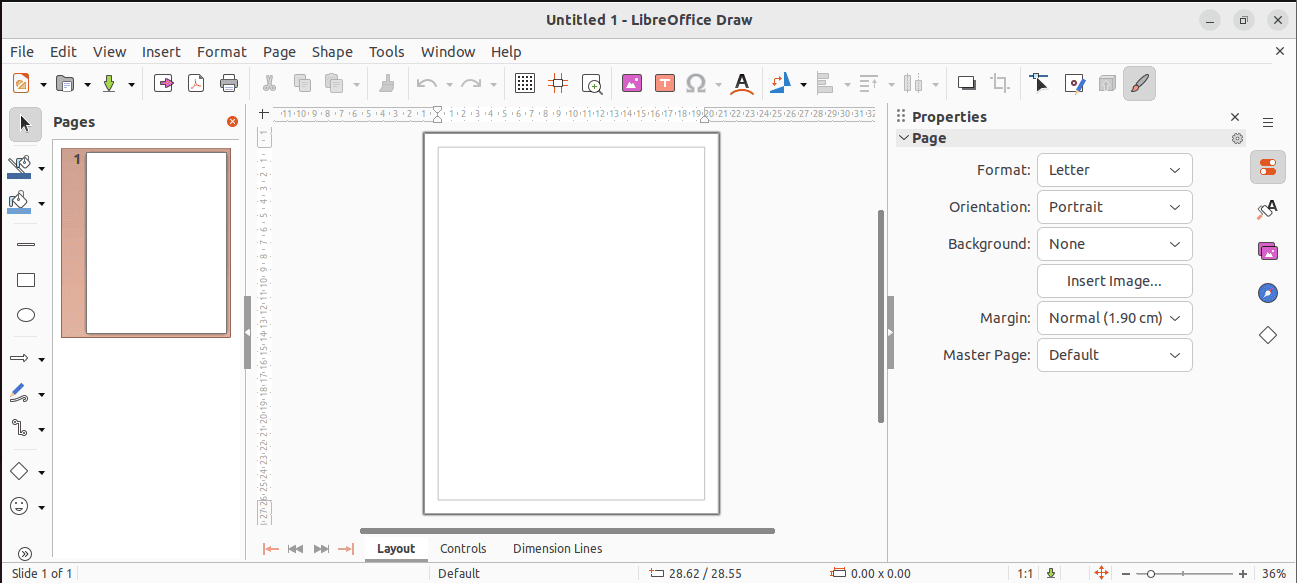
Hence, by dragging and dropping the required shapes and objects, we can draw a network graph.
3.2. DIA (Diagram Editor and Drawing Tool)
Similar to LibreOffice, we can use the Dia application to draw network diagrams.
Dia is a popular open-source diagramming tool. It’s useful because we can create visually appealing stencils and templates.
As Dia may not be available by default on Linux, we’ll install it using the apt-get command:
$ sudo apt-get install diaOnce the installation is complete, we’ll open the Dia application, and start working on it:
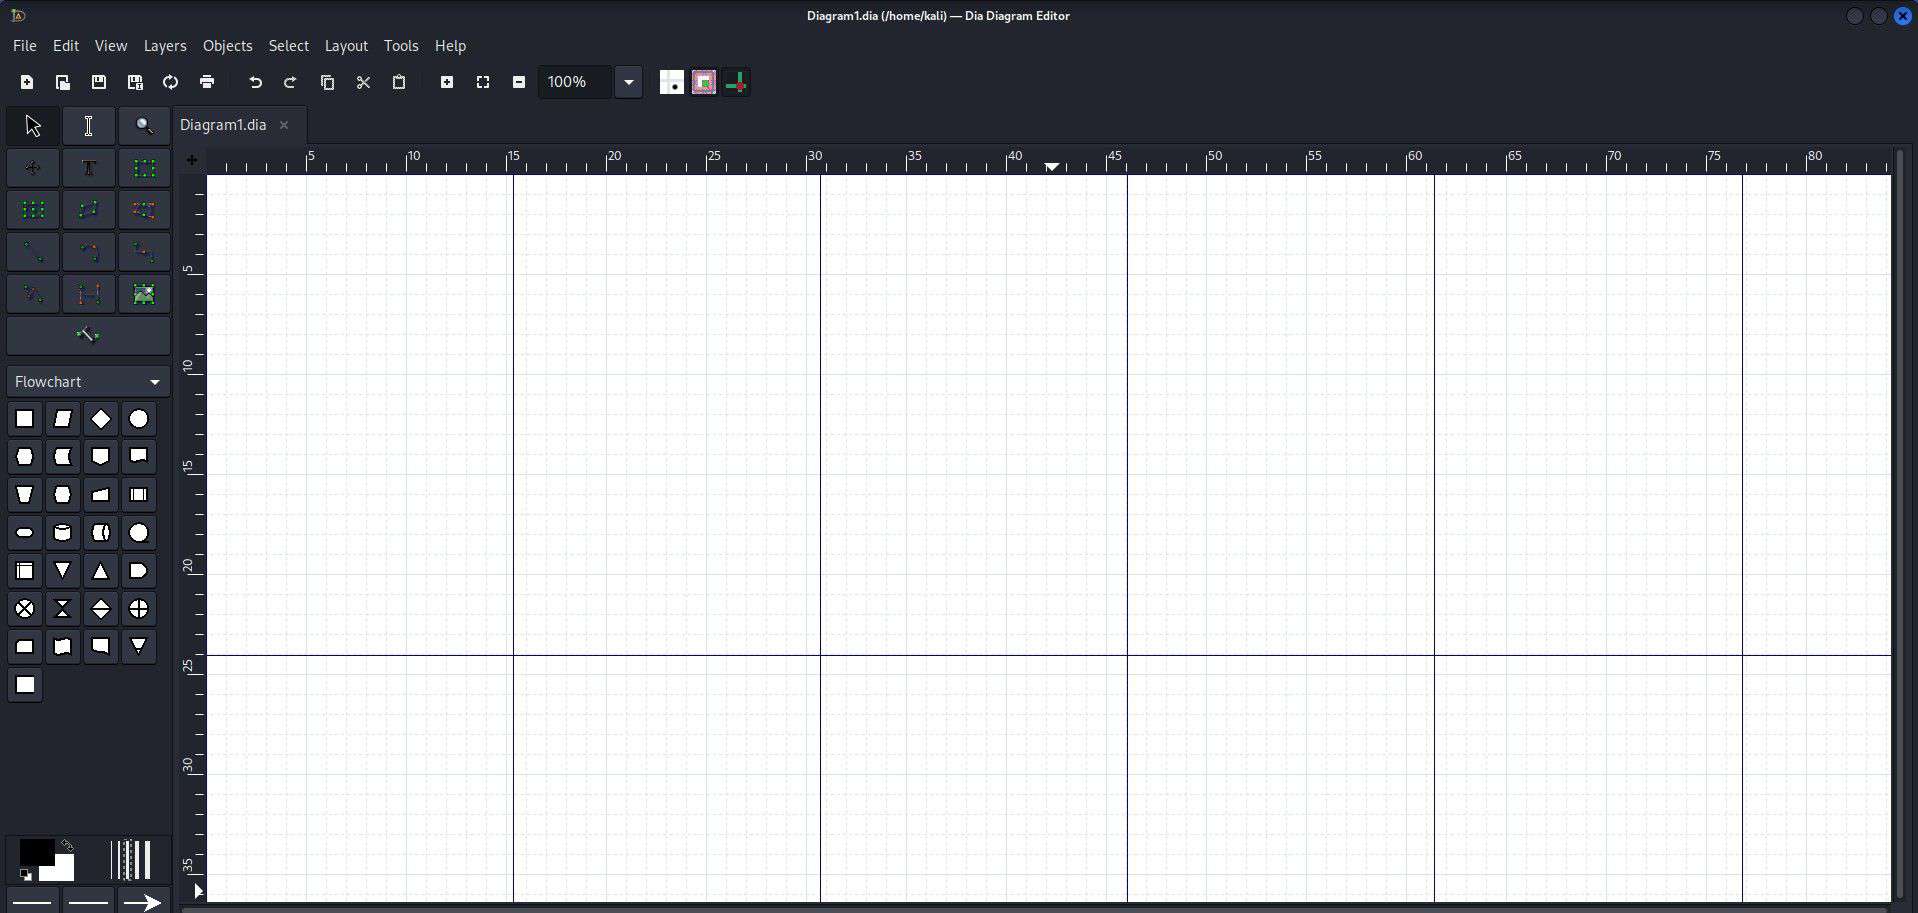
Since Dia doesn’t offer pre-made templates specific to network diagrams, we can manually draw a network diagram by selecting the tools from the toolbar and drawing them using the mouse.
3.3. Inkscape
Another versatile tool to create a network diagram is Inkscape.
Inkscape is an open-source vector graphics editor based on GTK+ toolkit used to create diagrams and illustrations. In addition, it offers a wide range of tools and is capable of creating professional-looking diagrams.
Similar to other drawing tools, it isn’t available by default on Linux. However, we can install Inkscape using the APT package:
$ sudo apt-get install inkscapeAfter the installation is complete, we’ll launch the Inkscape editor from Applications.
Next, we’ll click on the bottom right button New Document to create a new document. Alternatively, we can Load which is next to the New Document button to open an existing file.
Once we click the load button to load the document, we can view the Inkscape GUI:
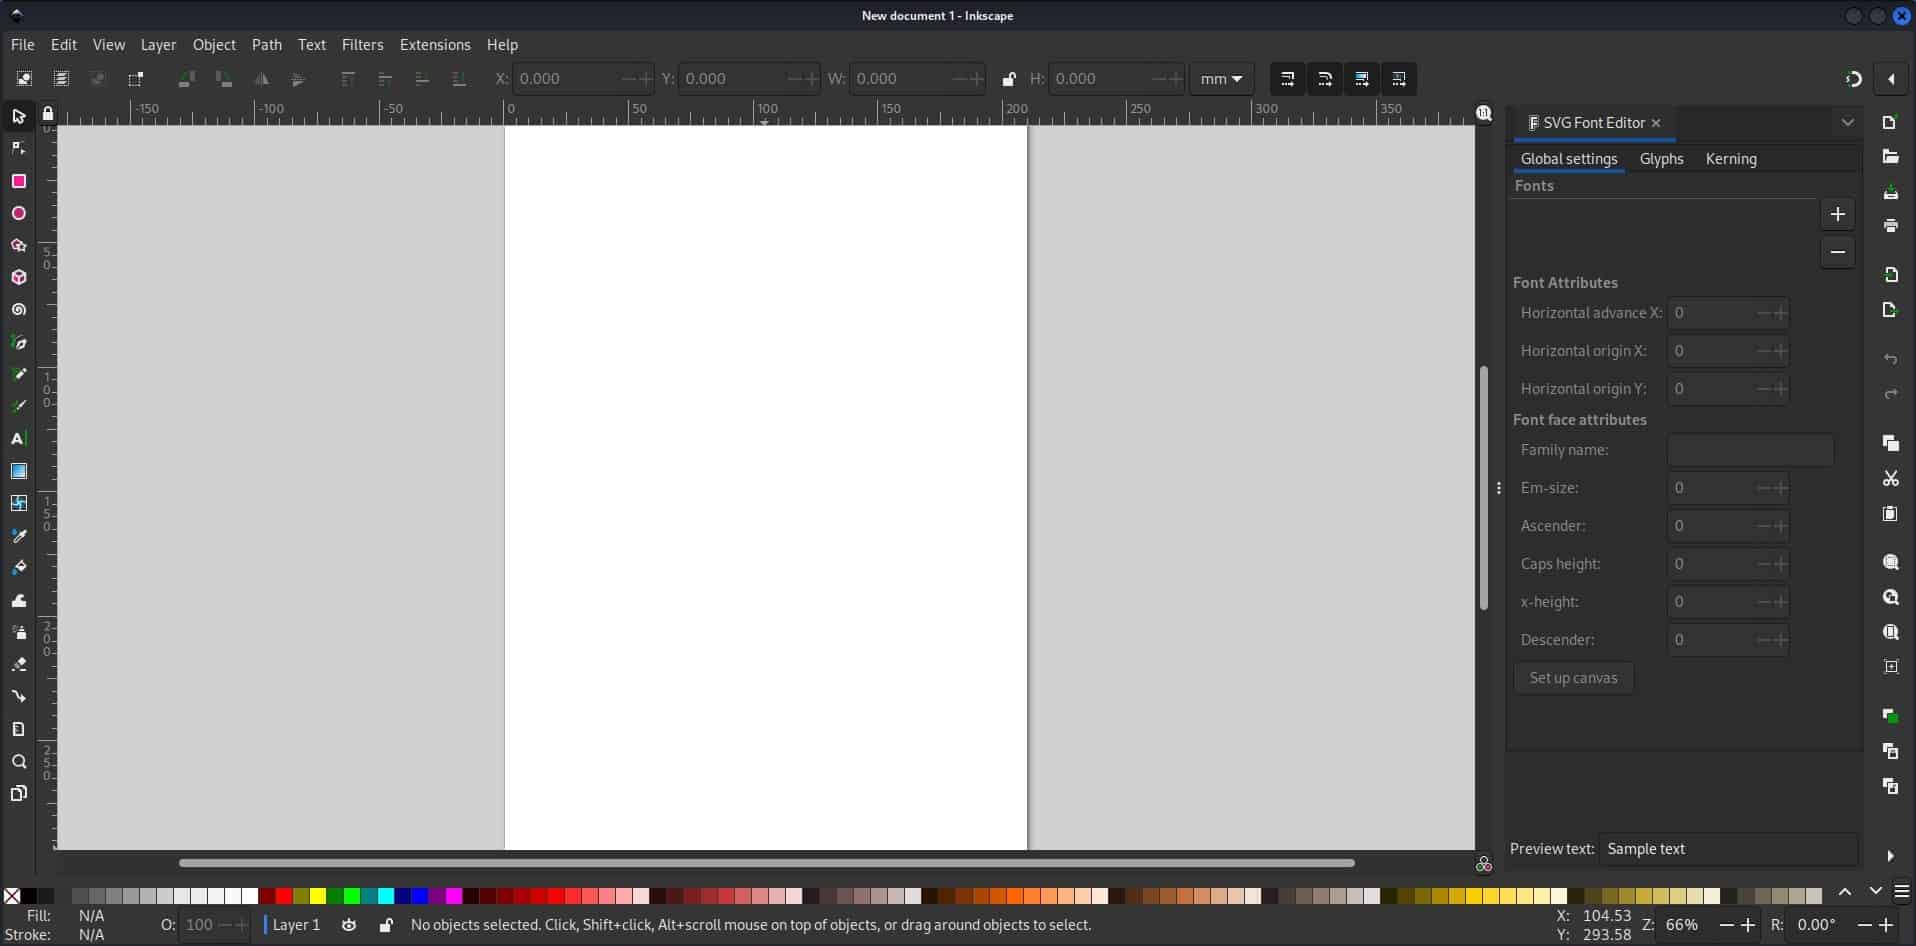
Now, we can drag and drop shapes from the toolbar on the left side of the screen to generate network diagrams.
4. Using Web-Based Editors
We can also use web-based tools to create network diagrams. The advantage of using a web-based editor is that we don’t need to install it to our system, we can use it directly in our web browser. An additional advantage of using a web-based editor is that we can access it anywhere.
4.1. Lucidchart
Lucidchart is an intelligent web-based diagramming tool that offers a variety of templates and shapes for creating network diagrams. It has both free and paid plans. In addition, Lucidchart enables online sharing and improves collaboration.
We can use Lucidchart by visiting its official website.
To create network charts using Lucidchart, we can start with a template:
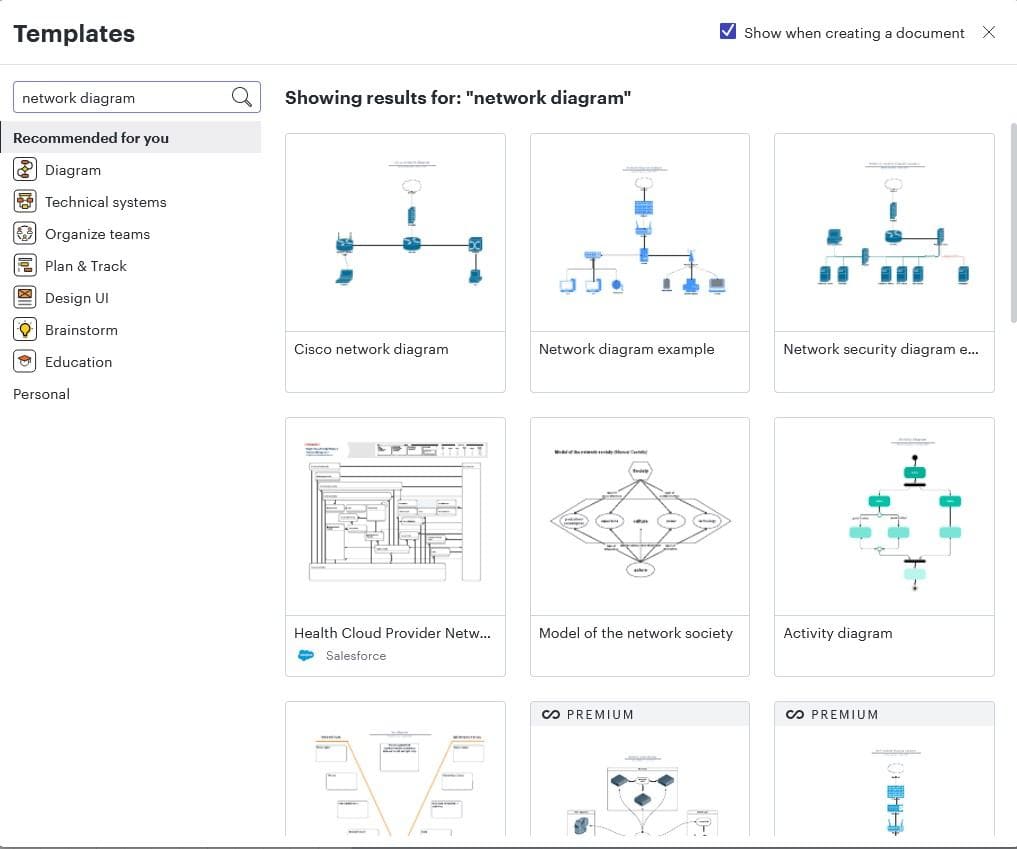
From there, we can easily create interactive network visualizations using a drag-and-drop functionality.
4.2. draw.io
Similarly, we can use draw.io to create compelling graphics. It was previously known as Diagrams.net.
draw.io is a free and open-source web-based diagramming tool. In addition, it offers a wide range of templates and shapes, including network-related elements. It’s crucial to note that draw.io doesn’t have network graph templates.
However, the draw.io tool does support network-related elements which we can drag and drop to create a network chart.
Furthermore, draw.io can be used online or as a self-hosted instance to make a nice network diagram. The additional feature of this application is that it doesn’t require registration or login.
To create a network graph in draw.io, we search for the shapes in the Shapes toolbar:
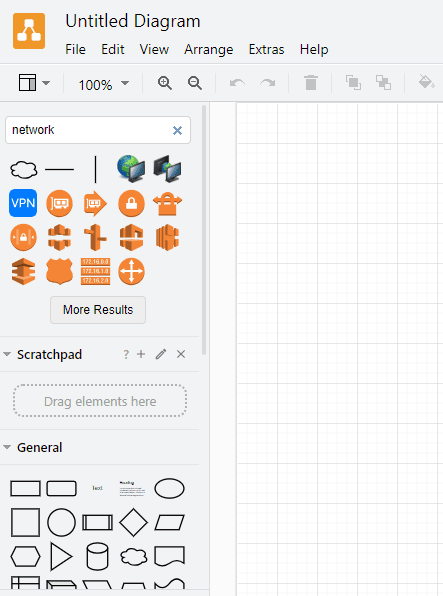
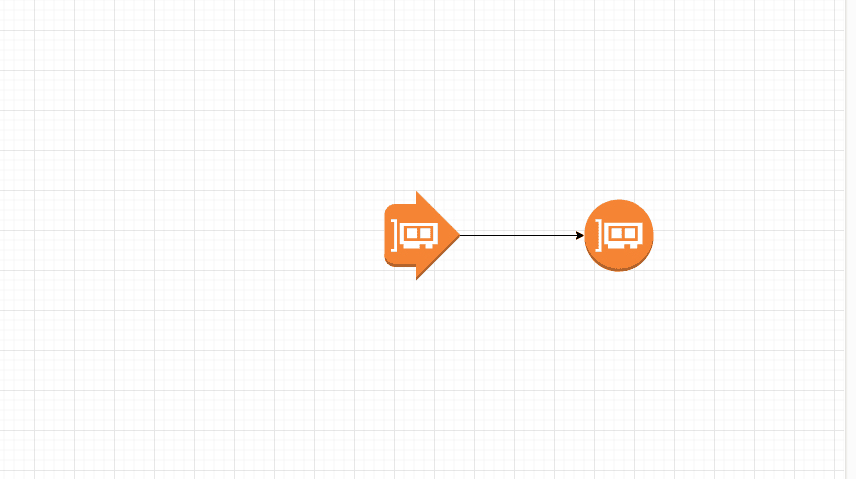
Next, we click the shape to bring it into the canvas:
In addition, we can click More Results to view related elements.
4.3. Cacoo
Cacoo by Nulab is an alternative web-based diagramming and collaboration tool. It offers a user-friendly interface and a variety of templates and shapes for designing architectures and other types of diagrams. In addition, it has free and basic plans for a variety of users.
We can access Cacoo from its official website.
After that, we’ll sign up for the account, and access the workspace:
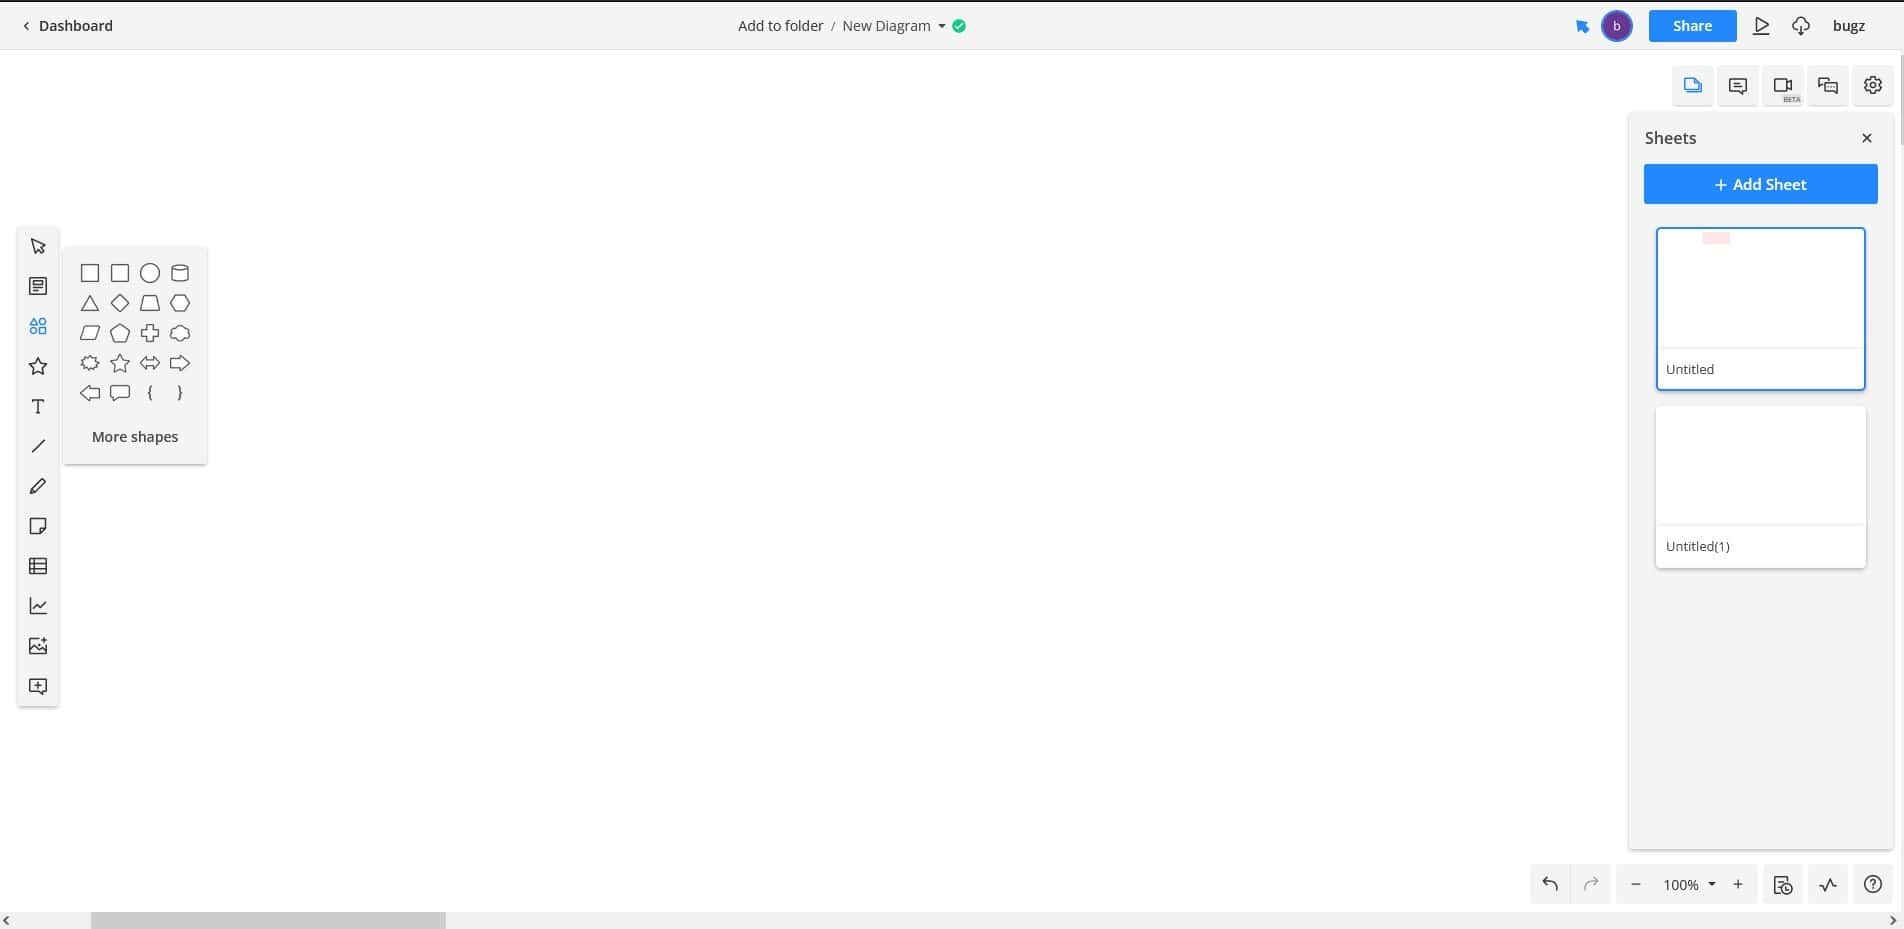
Additionally, Cacoo has a built-in template for network diagrams:
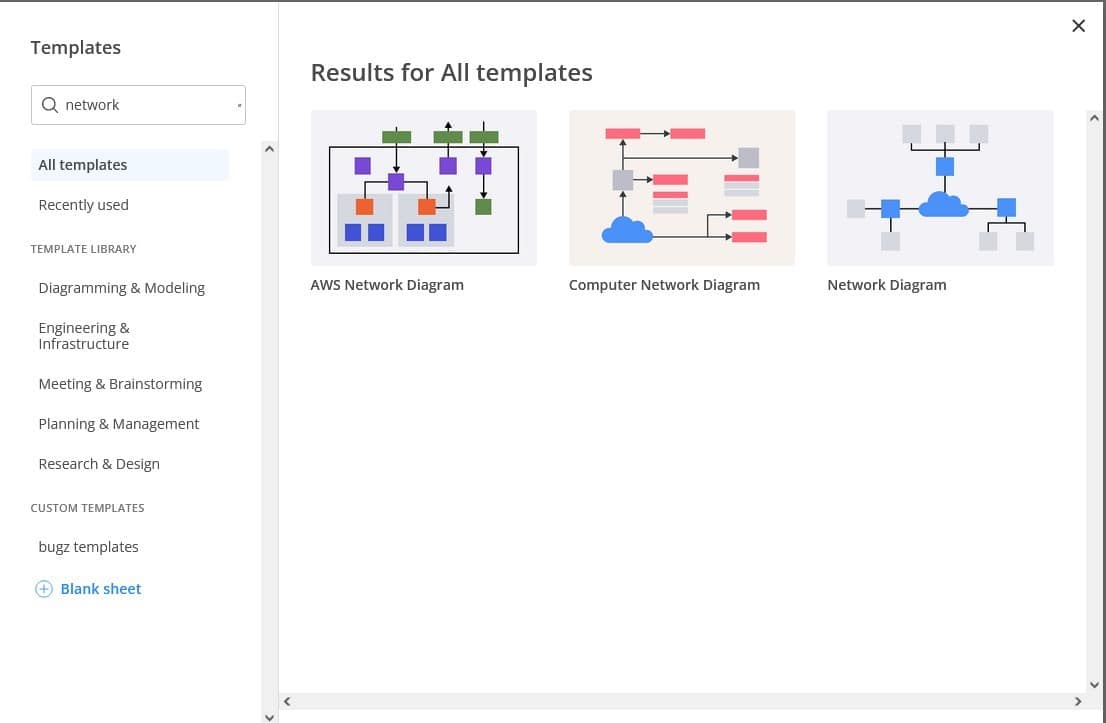
This built-in template option makes it easier for users to create specific graphs.
5. Conclusion
In this article, we explored multiple methods to create a network diagram with a variety of tools.
First, we discussed the Graphviz editor which uses commands to generate network charts in Linux.
After that, we discussed LibreOffice Draw, Dia, and Inkscape. These were desktop-based editors. Lastly, we discussed web-based editors like Lucidchart, Diagrams.net, and Cacoo.
To conclude, each method here has its own advantages and disadvantages. Therefore, the appropriate method to create a network diagram depends on the specific needs and preferences of the users.