

Learn through the super-clean Baeldung Pro experience:
>> Membership and Baeldung Pro.
No ads, dark-mode and 6 months free of IntelliJ Idea Ultimate to start with.
Learn through the super-clean Baeldung Pro experience:
>> Membership and Baeldung Pro.
No ads, dark-mode and 6 months free of IntelliJ Idea Ultimate to start with.
When administering or working with a Linux system, we need information about the system’s performance. So, we have at our disposal various performance gauges. By using them, we can monitor CPU, disk, or network load. However, we need a good understanding of what these statistics really mean.
In this tutorial, we’ll learn about the iowait time and stall pressure statistics.
Let’s notice that iowait is one of the five main CPU states along with system, user, nice and idle. Specifically, it indicates CPU idle when waiting for the I/O request to meet.
So, the iowait statistic says how much time the CPU spends waiting for I/O. Thus, we need at least one process pending at I/O and the CPU doing nothing at the same time to increase this number.
We can find the current value of iowait time in the /proc pseudo file system in the stat virtual file:
$ cat /proc/stat
cpu  474176 2133 104124 3722126 63807 0 2381 0 0 0
cpu0 119080 646 25903 930653 13786 0 2107 0 0 0
cpu1 117160 395 26396 932738 14762 0 37 0 0 0
cpu2 119114 594 25853 928942 17902 0 196 0 0 0
cpu3 118821 497 25971 929792 17356 0 40 0 0 0
...
So, let’s read the fifth column to find the iowait time. This is a total value for all CPUs since the last boot. In addition, we can find this information specified per CPU.
Now let’s look through some tools to monitor iowait. Usually, we’ll obtain a share of iowait time, accumulated during some interval.
But before we start, let’s use stress-ng to simulate processes with a lot of I/O operations:
stress-ng --hdd 4 --timeout 9000sIn this way, we’re going to run four processes performing read and write disk operations through 9000 s. Finally, let’s state that all tests will be performed on Ubuntu 22.04 LTS with kernel version 5.15.0-25-generic.
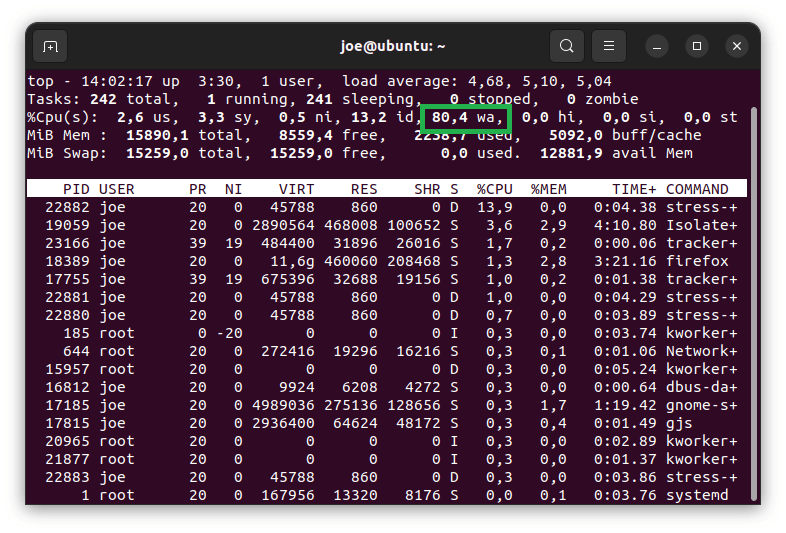
The well-known top, the system and processes monitor provides information about the iowait time in the field wa. Let’s notice that it’s a percentage figure:
Now, let’s use the iostat command with the c switch to report the CPU statistics. In addition, we’re going to print this information in five-seconds intervals:
$ iostat -c 5
Linux 5.15.0-25-generic (ubuntu) 	31.07.2022 	_x86_64_	(4 CPU)

avg-cpu:  %user   %nice %system %iowait  %steal   %idle
          10,95    0,05    2,49    2,44    0,00   84,07


avg-cpu:  %user   %nice %system %iowait  %steal   %idle
           3,56    0,00    4,16   82,64    0,00    9,63


avg-cpu:  %user   %nice %system %iowait  %steal   %idle
           6,66    0,00    3,30   77,42    0,00   12,62
...
Let’s look at the %iowait field, which provides the percentage amount of iowait time. The figure accounts for the period between consecutive reports, with the exception of the first report, which covers the time since the last boot.
When assessing the system’s health with iowait, we should be aware of its flaws. In fact, objections concern both the way how the figure is calculated and how to interpret it.
As we already know, the iowait figure accumulates the wasted time when a task is waiting for I/O and leaves the CPU idle. However, in the case of many CPUs, this picture isn’t so clear anymore. Awaiting task can be abandoned by its original CPU and then picked up by another one to complete.
Moreover, with the modern architecture of multi-core CPU, task stalled by I/O operation isn’t served by any CPU at all. So, now we see that we can hardly relate the waiting task to any CPU.
Now let’s perform a simple demonstration to show the problem with the interpretation of iowait.
First, let’s add I/O stress to the system with:
$ stress-ng --hdd 4 --timeout 9000sAfter waiting a few moments, let’s check iowait with iostat:
avg-cpu:  %user   %nice %system %iowait  %steal   %idle
           2,07    0,00    2,63   81,30    0,00   14,00
We can notice a rather high value of around 80 %, which might indicate an I/O bottleneck. Next, let’s add some CPU stress with:
stress-ng --cpu 4 --timeout 90sFinally, let’s check iowait again:
avg-cpu:  %user   %nice %system %iowait  %steal   %idle
          96,30    0,00    3,70    0,00    0,00    0,00
We should not be misled by a zero value of iowait. After all, the I/O stressors are still working. However, the CPUs have now a lot of work and don’t waste a single cycle. But, let’s notice the missing link in this picture – processors are just doing something else.
So, the worst part is that we completely lost the information about possible I/O overload.
As the bottom line, let’s quote the words of man proc:
Time waiting for I/O to complete. This value is not reliable [...]Let’s take a look at Pressure Stall Information (PSI), which monitors system shortages. With PSI, we can track time wasted by non-idle processes when waiting for resources, such as CPU, memory, and disk. In this way, we obtain information about system performance in a more direct way than CPU statistics can do.
Finally, let’s state that PSI has come with the Linux kernel since version 4.20.
So, let’s look for the PSI statistics in the /proc/pressure pseudo folder. Then, we can inspect one of the cpu, memory, or io virtual files:
$ ls /proc/pressure/
cpu io memoryOf course, we’re going to examine the io file:
$ cat /proc/pressure/io
some avg10=0.02 avg60=0.07 avg300=0.24 total=6948089355
full avg10=0.02 avg60=0.06 avg300=0.17 total=5935722571
Let’s notice two categories, some and full. The some line refers to a situation when at least one process stalls at the I/O resource. Next, full is a time when all processes are stopped. Consequently, it means a total loss of the I/O throughput.
Now, let’s look through the details. So, we have three average values, avg10, avg60, and avg300. The numbers correspond to 10-, 60-, and 300-second time windows when the figures are calculated. Finally, total is a total waiting time in microseconds.
We can use atop to show PSI’s information. Usually, we need to install a package of the same name. Now, let’s start it and find the pressure information in the PSI line:
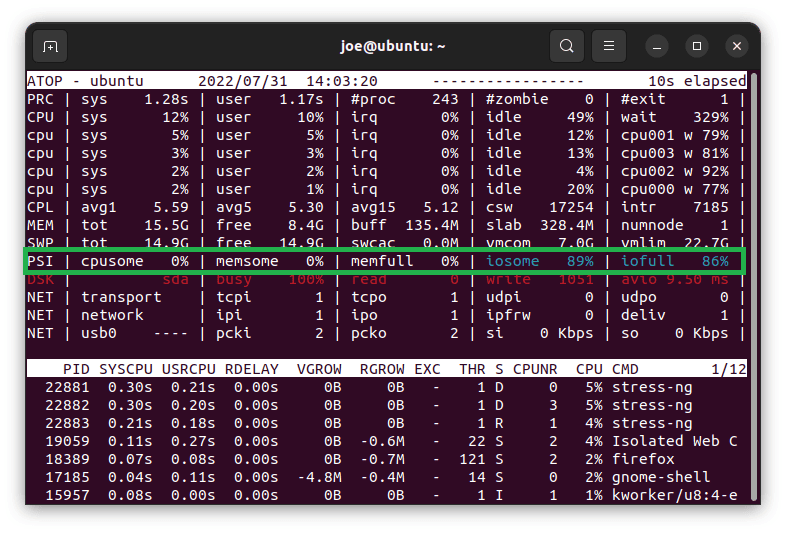
Let’s notice that iosome and iofull provide the I/O figures.
Now let’s check PSI’s figures under conditions similar to that when the iowait failed. So first, we’re going to load the system with I/O operation and subsequently add some CPU stress. So. let’s start with disk stressors:
$ stress-ng --hdd 4 --timeout 9000sLet’s check the excerpt from the atop‘s output to find both iosome and iofull values high:
PSI | cpusome 0% | memsome 0% | memfull 0% | iosome 88% | iofull 84% |Then let’s add some CPU work:
stress-ng --cpu 4 --timeout 900sAnd finally, let’s consult atop one more time:
PSI | cpusome 6% | memsome 0% | memfull 0% | iosome 50% | iofull 0% |Let’s see that even though the full figure dropped to zero exactly as iowait before, some still indicated I/O delays. So, with PSI, we’re not missing information about the system’s I/O load.
In this tutorial, we learned how to monitor resource availability in the context of I/O operations. First, we studied the iowait figure, which is a CPU usage statistic. Then, we examined various ways to read this value. Finally, we discussed its meaning and highlighted its shortcomings.
Next, we moved on to Pressure Stall Information to show its different approach based on the time a process is waiting for resources. Furthermore, we demonstrated how it brought information unreachable with the iowait statistic.