

Learn through the super-clean Baeldung Pro experience:
>> Membership and Baeldung Pro.
No ads, dark-mode and 6 months free of IntelliJ Idea Ultimate to start with.
Last updated: March 18, 2024
Learn through the super-clean Baeldung Pro experience:
>> Membership and Baeldung Pro.
No ads, dark-mode and 6 months free of IntelliJ Idea Ultimate to start with.
When running a cloud server, we may have a plan with a priced bandwidth. For instance, the plan may include the first 1TB of transfer for free and then charge us an extra cost for each 1GB of excess. Some providers charge us for transmission, others for reception, and others for the total transfer.
So, we may want to monitor internet bandwidth usage. This would allow us to know how much bandwidth we’ve been using, so we can take the appropriate action if the bandwidth is too high.
In this tutorial, we’ll learn how to monitor internet bandwidth usage on Linux. We’ll see if we can use the vnstat software to do this. Alternatively, we’ll see that we can read and process the special file /proc/net/dev.
The vnstat software is a great tool to monitor internet bandwidth. It comes with a daemon that collects network usage and stores it, so the data persists after a system reboot.
We can install the vnstat software using the package manager. After that, we have to run the vnstat service so it can collect and store the statistics.
We can use the systemctl command to enable and run the service:
$ systemctl enable --now vnstat

$ systemctl status vnstat
● vnstat.service - vnStat network traffic monitor
   Loaded: loaded (/usr/lib/systemd/system/vnstat.service; enabled; vendor preset: disabled)
   Active: active (running) since Thu 2022-06-30 16:11:07; 6s ago
 Main PID: 25854 (vnstatd)
First, we enabled and then started the service using the enable –now parameters. Then we checked that the service was enabled and running using the status parameter.
Now that the service is running, we need to give it some time until it collects enough data before we can see the usage statistics for the first time.
We can easily see the bandwidth usage statistics in the console by running the vnstat command. This will display the received, transmitted, total, and estimated traffic for each network interface.
Let’s run vnstat to see the bandwidth usage:
$ vnstat
                      rx      /      tx      /     total    /   estimated
 eth0:
       2022-06     18.24 GiB  /  662.75 MiB  /   18.89 GiB
       2022-07     16.01 GiB  /  428.61 MiB  /   16.43 GiB  /  187.54 GiB
     2022-07-01    14.38 GiB  /  361.94 MiB  /   14.74 GiB
         today      1.63 GiB  /   66.66 MiB  /    1.69 GiB  /    2.36 GiB
 tap0:
       2022-06    431.42 MiB  /   11.41 MiB  /  442.83 MiB
       2022-07     86.86 MiB  /    1.46 MiB  /   88.32 MiB  /    1.00 GiB
     2022-07-01    72.34 MiB  /  636.29 KiB  /   72.96 MiB
         today     14.51 MiB  /  860.97 KiB  /   15.36 MiB  /   23.10 MiB
As we see, we got the statistics from the last two months and for each interface. It informs us that the eth0 interface received 166GiB and transmitted 428 MiB during July, the current month.
The estimated column is an estimation of how much we’ll use in that period based on the previous usage. As we’re currently in July, vnstat estimates that we’ll receive and transfer approximately 187GiB this month.
We can also see the information by the hour, day, month, and year. We can do this using the parameters -h, -d, -m, and -y, respectively.
If we have more than one network interface, we can specify it with the -i parameter followed by the interface name. This way, we can print the information only from the interface connected to the internet.
Let’s use the -d and the -i eth0 parameters to see the statistics on a daily basis:
# vnstat -d -i eth0
 eth0  /  daily
          day        rx      |     tx      |    total    |   avg. rate
     ------------------------+-------------+-------------+---------------
     2022-06-28     8.61 GiB |  393.22 MiB |    9.00 GiB |  894.42 kbit/s
     2022-06-29          0 B |         0 B |         0 B |        0 bit/s
     2022-06-30     9.63 GiB |  269.53 MiB |    9.89 GiB |  983.72 kbit/s
     2022-07-01    14.38 GiB |  361.94 MiB |   14.74 GiB |    1.47 Mbit/s
     2022-07-03     1.63 GiB |   67.31 MiB |    1.70 GiB |  234.55 kbit/s
     ------------------------+-------------+-------------+---------------
     estimated      2.27 GiB |   93.60 MiB |    2.36 GiB |
We can notice that vnstat printed the eth0 interface usage day by day. For instance, it informs us that on June 28, we received 8 GiB and transmitted 393 MiB.
If we prefer to visualize the information in a picture, we can use the vnstati command. This is a great tool that displays the bandwidth usage in a png image.
The vnstati command parameters are similar to the vnstat command parameters. So, we can see the usage of the eth0 interface on a monthly basis using the -m -i eth0 parameters. Also, we have to specify the output file with the -o parameter followed by the filename.
Let’s see how to generate an image called monthly.png with the monthly bandwidth usage of the eth0 interface:
$ vnstati -m -i eth0 -o monthly.png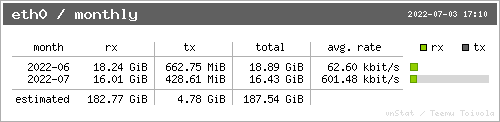
We can see that the image has similar content to what we obtained in the console.
If we want, we can also generate a summary using the -s, -hs, or -vs parameters. The -s parameter generates a basic summary with the last days’ bandwidth usage and the last months’ bandwidth usage.
The -hs and -vs parameters improve the -s parameter by adding the transfer rate of the last 24 hours. We can use the -vs parameter to generate a vertical image with this information. If instead, we prefer a horizontal image, we can use the -hs parameter.
Let’s generate a vertical summary with the eth0 interface statistics:
$ vnstati -vs -i eth0 -o summary.png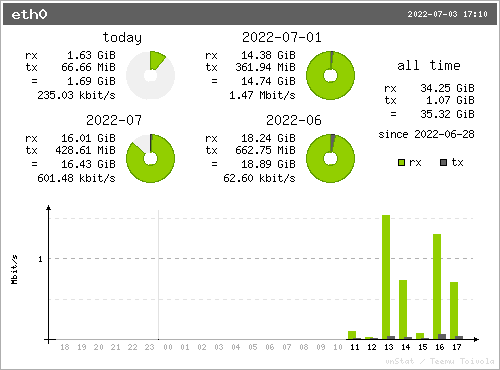
As we see, the image includes the bandwidth usage from the last two days and the last two months. Also, it has a graph hour by hour on the bottom with the transfer rate.
Another useful vnstat functionality is the –alert parameter. We can use it to alert us when the bandwidth usage exceeds a certain limit.
The –alert parameter needs six arguments:
We can learn more about the alert parameters on its man page.
One way we can use this functionality is to write a script that takes some action when a limit is exceeded. For instance, we can send an email to ourselves. Then, we can configure this script as a cron job on a daily basis. This way, we can automate the process of checking the bandwidth usage.
If we use the value 0 in the alert’s output mode parameter, vnstat won’t print any results. Then, we can use the value 3 in the alert’s exit code parameter so that the exit code is 1 if the limit is exceeded and 0 otherwise. We can monitor monthly bandwidth usage with the monthly time interval. And we can check the transmitted bandwidth with the tx parameter.
Let’s write a bash script to alert when the transmitted bandwidth usage exceeds a 1 TiB limit:
#!/bin/bash
if ! vnstat -i eth0 --alert 0 3 monthly tx 1 TiB; then
    # The eth0 interface exceeded the 1 TiB transmitted limit
    # We can send an email to alert us
fi
As we see, we used the 0 output mode, the 3 return code mode, and a 1 TiB transmitted (tx) limit in a month. If we need to monitor both the received and transmitted bandwidth, we can use the total parameter instead of the tx parameter.
We can see that we check if the command returns any code other than 0 using the ! character. This way, the if body is executed when the limit is exceeded. Then, inside the if body, we can add whatever action we want to take when the bandwidth usage is too high.
We also have the alternative to monitoring internet bandwidth usage by reading the /proc/dev/dev file. The special file /proc/net/dev contains the network status, including the total bandwidth received and transmitted for each device.
The advantage of using this file is that we don’t need to install any extra software.
The /proc/net/dev file has the total bandwidth usage since the last boot. So, we don’t know how much bandwidth was used in a particular month. Also, the information is reset to zero when the system boots. So, we would lose track of the bandwidth usage if our server reboots.
Let’s see the /proc/net/dev file content using the cat command:
$ cat /proc/net/dev
Inter-|   Receive                                                   |  Transmit
 face |bytes       packets errs drop fifo frame compressed multicast|bytes     packets errs drop fifo colls carrier compressed
    lo:    2939975     515    0    0    0     0          0         0   2939975     515    0    0    0     0       0          0
  eth0: 2571860916 2242041    0   33    0     0          0      3365 136015011 1263791    0    0    0     0       0          0
  tap0:   12929438   10506    0    0    0     0          0         0    442513    4761    0    0    0     0       0          0
As we see, this file contains the total bytes received and transmitted for each interface. It also contains more information such as packet count, errors, dropped packets, and more.
We can notice that the total received bytes are in the 2nd column, and the total transmitted bytes are in the 10th column. Also, we don’t need the lo and tap0 interfaces because, in this case, we use the eth0 interface for the internet connection. With this information, we can write a simple script that prints the bandwidth usage since the last boot.
Let’s use awk to print the internet bandwidth usage using the /proc/net/dev file:
$ awk '/^\s*eth0:/ {
    RX=$2/1024/1024
    TX=$10/1024/1024
    TOTAL=RX+TX
    print "RX:", RX, "MiB\nTX:", TX, "MiB\nTotal:", TOTAL, "MiB"
}' /proc/net/dev
RX: 2453.29 MiB
TX: 129.875 MiB
Total: 2583.16 MiB
We can see that we used awk to process only the lines starting with eth0. Then, we calculated the received, transmitted, and total bandwidth usage in MiB. So, this means that we have received a total of 2453 MiB and transmitted 129 MiB since the last time the system booted.
We can save the internet bandwidth usage to a log file, so we don’t lose the information if the system reboots. Also, if we write to the log file daily, we can calculate how much bandwidth was used each day and each month.
Let’s write a script that logs the bandwidth usage to a CSV file:
#!/bin/bash
LOG=/var/log/bandwidth_usage_$(date +%Y%m).csv
echo -n "$(date --rfc-3339=date)," >> $LOG
awk '/^\s*eth0:/ {
    RX=$2/1024/1024
    TX=$10/1024/1024
    TOTAL=RX+TX
    print RX "," TX "," TOTAL
}' /proc/net/dev >> $LOG
As we see, our script generates a log file inside the /var/log folder. We use the date command to calculate the year and month, so we can write one log file for each month. Then, we write a line containing the current date followed by the received, transmitted, and the sum of both in MiB.
The bandwidth usage is accumulative, so each line represents the bandwidth usage from the last system boot until the line timestamp.
Now, we can configure our script as a cron job on a daily basis. One way to do this is by moving our script to the /etc/cron.daily folder. This way, the system will run our script every day, and the script will log a new entry for that day.
After a few days, we can see the log file:
$ cat /var/log/bandwidth_usage_202207.csv
2022-07-01,1481.08,32.52,1513.6
2022-07-02,1755.88,67.22,1818.1
2022-07-03,2368.69,133.17,2501.87
We can notice that we received 2368MiB and transmitted 133MiB from the last system boot until July 3.
Using this log file, we can subtract the last and first rows to calculate how much was used in a month. In this case, the sum of the received and transmitted bandwidth usage from July 1 until July 3 is 988.27 MiB (2501.87 – 1513.6).
In this article, we saw how to monitor internet bandwidth usage.
First, we learned how to install and run the vnstat service. We saw how to monitor the bandwidth usage with the vnstat and vnstati commands. Also, we saw we can use the –alert parameter to check whether the bandwidth usage exceeded a limit.
Then, we learned about the /proc/net/dev file. First, we saw how to process this file to monitor the bandwidth usage. Then, we saw we could generate a log file on a daily basis with bandwidth usage.