
1. Introduction
In our previous article, we introduced Lightrun – a Developer Observability platform. In this article, we’re going to look deeper into the features that it offers, how we can best use them with our applications, and what we can get from it.
2. Snapshots
In our last article, we briefly examined what snapshots are and what they can do for us. Here, we’re going to look in more depth at what they are, how we can best use them, and what they can do for us.
Snapshots are similar to debugger breakpoints. We can register a snapshot on any line of code in our application. Every time it’s triggered it will automatically record the full stack trace and the value of every visible variable. Just like normal breakpoints, this will include local variables, method parameters, and class fields, and will do so up the entire stack frame.
The main difference between snapshots and debugger breakpoints is that snapshots are non-intrusive. They do not cause anything to block – be it the entire application or just the executing thread. They record the current state of execution, and the application carries on without interrupting the application in any way.
Traditional blocking breakpoints such as in a debugger would cause either the single thread or else the entire application to stop pause whilst we are looking at the details. Lightrun allows us to do all of this without affecting the live application at all.
2.1. Placing Snapshots
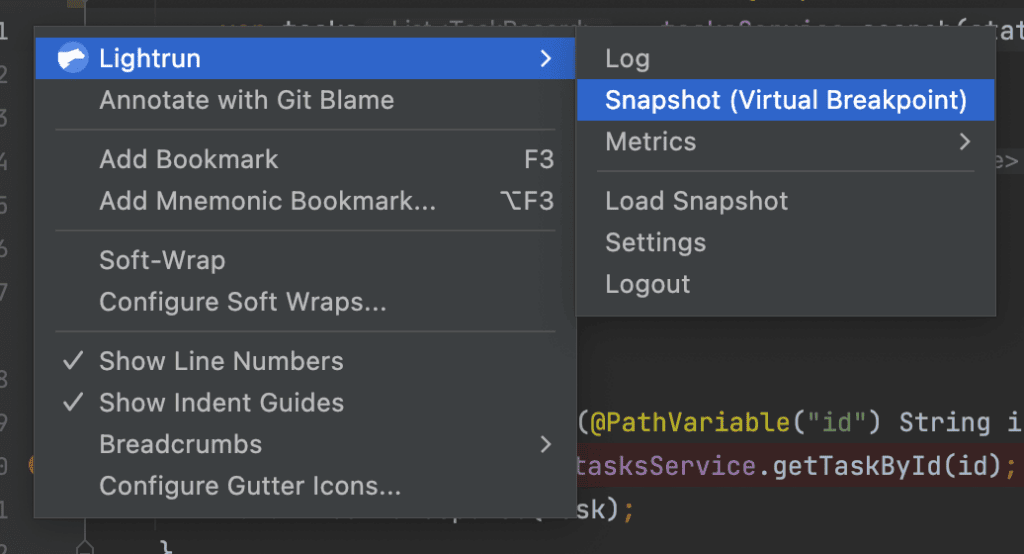
Snapshots are placed into our application directly from our code editor. In this article, we are using IntelliJ IDEA, but everything can also be achieved from Visual Studio Code as well. We need to determine where in the application we want to place a snapshot. We can then right-click on this line of code and select “Lightrun > Snapshot (Virtual Breakpoint)” from the menu:
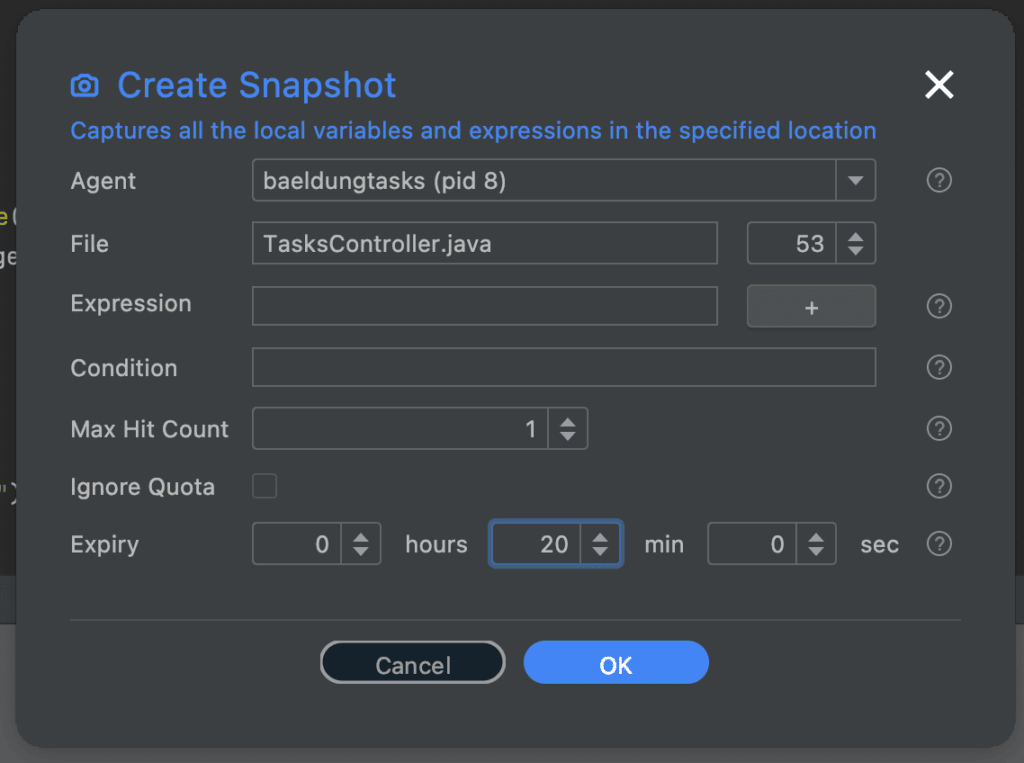
Doing this will then open a dialog allowing us to specify the details of the snapshot:
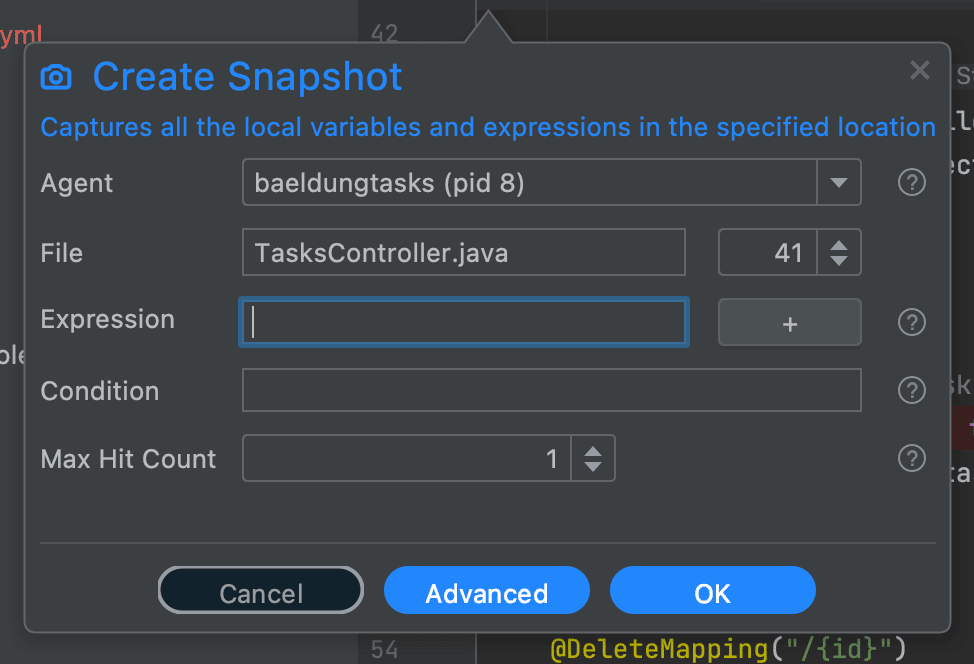
The default behavior of this is relatively simple but often this is what is most useful. It will:
- Take a snapshot of the exact line selected.
- With no conditions on when to trigger the snapshot.
- With no extra expressions to record with the snapshot.
- Recording only the first time the snapshot is triggered.
- Expiring one hour after it was added.
This means that it will record the exact state of execution the next time this line of code is executed, as long as it was within the next hour. When we’re diagnosing an issue this is often the most useful setup, because we want to be in control of what is recorded without getting any noise in the recordings. We’ll see more about all of these later in the article.
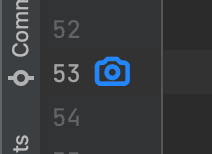
Once we have done this, a blue camera icon is placed next to the line of code that the snapshot is registered for. This indicates that our snapshot has been successfully placed and will record when triggered:
When the snapshot gets triggered, we’ll automatically have the details available to see in our editor. This looks and functions almost exactly the same as the IntelliJ breakpoint panel, because it is designed to serve the same purpose:
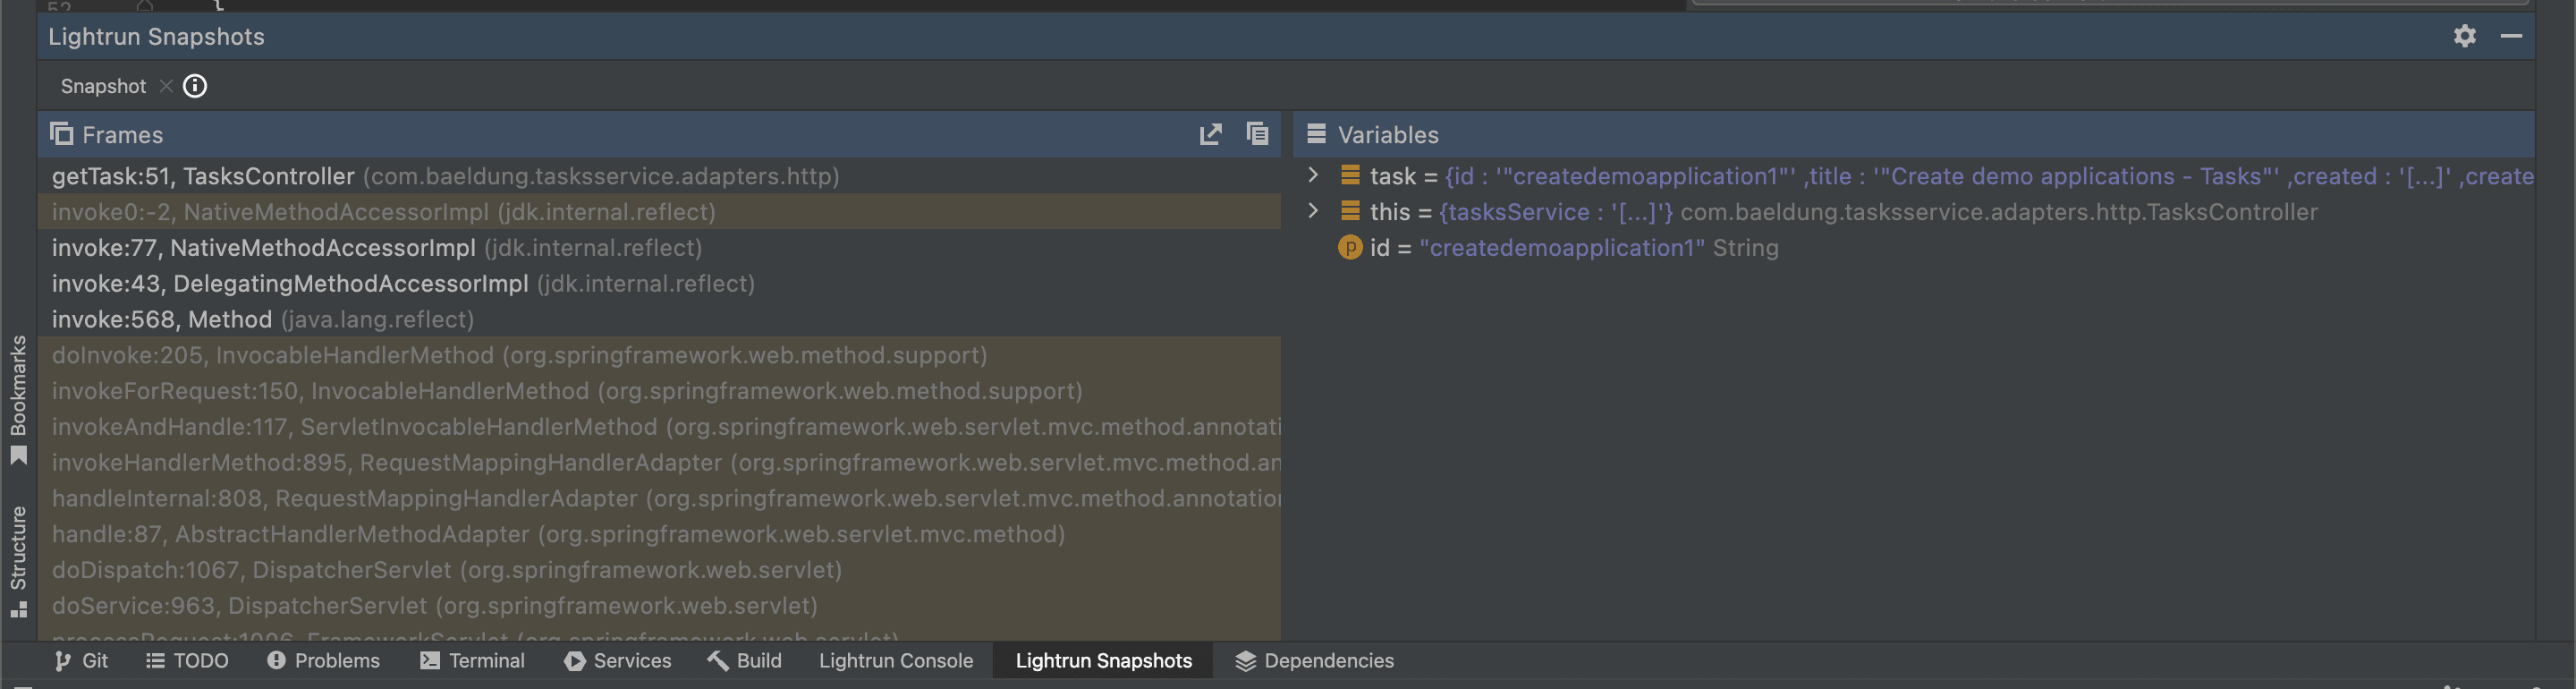
Here we can immediately see the full stack trace to our execution, and the variables that we could access. This includes the variable this, inside of which we can see the fields of the current class instance. We can also drill into these as far as we want, and click into other methods in the stack frame, in the exact same way as with a traditional debugger.
2.2. Conditional Snapshots
In some scenarios, we want to record our snapshots only when certain conditions are met. For example, only when the current user is a particular username.
Lightrun snapshots allow us to specify a condition as part of setting them up. This is very similar to the way conditional breakpoints work in our debugger. Our condition is specified as a Java expression that evaluates to either true or false. This can access anything that would be visible at the point the snapshot is triggered, meaning any local variables, parameters, class fields, or anything else.
For example, imagine we have a method with a parameter id. We want to record a snapshot when this is called, but only when the ID provided is a particular value. We can set this up with a condition triggered exactly as desired:
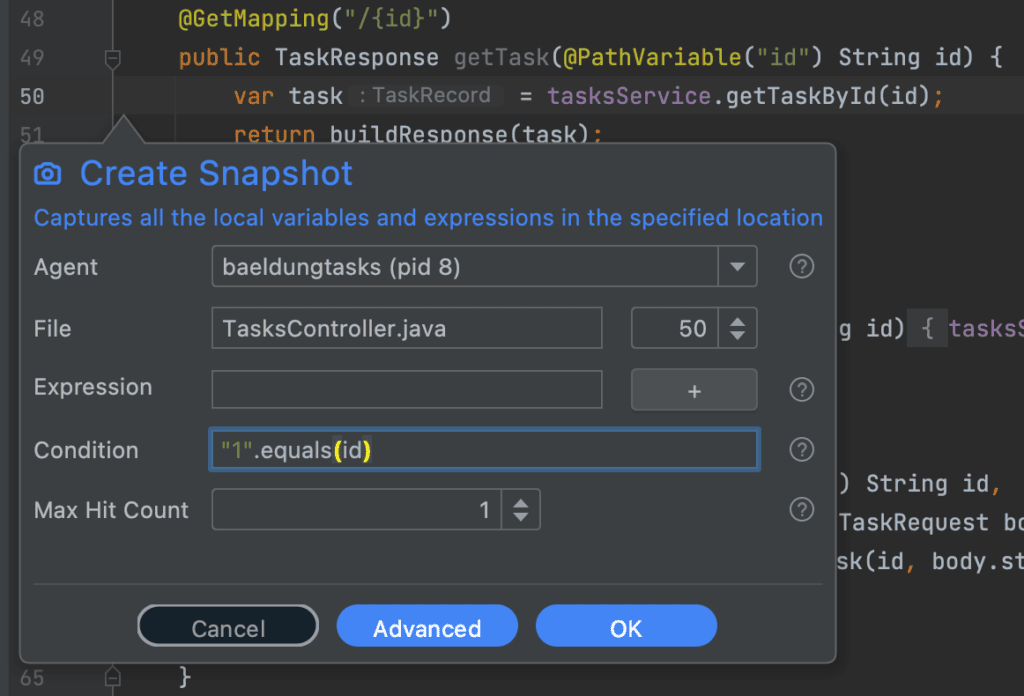
This means that the snapshot will only be triggered when called with our particular test value, but any other live usage of the service will be ignored unless they happen to use the same value. This helps ensure that what we see in our snapshots pane is exactly what we want, without any extra noise cluttering it up and making our diagnosis harder.
2.3. Additional Expressions
In some situations, we may have additional values that we want to record as part of a snapshot.
These might be computations from other values just to make life easier – for example, drilling into nested values to surface them easier. These might also be calls to get values that otherwise wouldn’t be recorded – for example, from static variables such as RequestContextHolder or SecurityContextHolder. They can even be method calls on any of the values that we can see, and record the result of these methods.
Expressions are added in a very similar way to conditions, by entering the expression to be recorded into the Snapshot dialog:
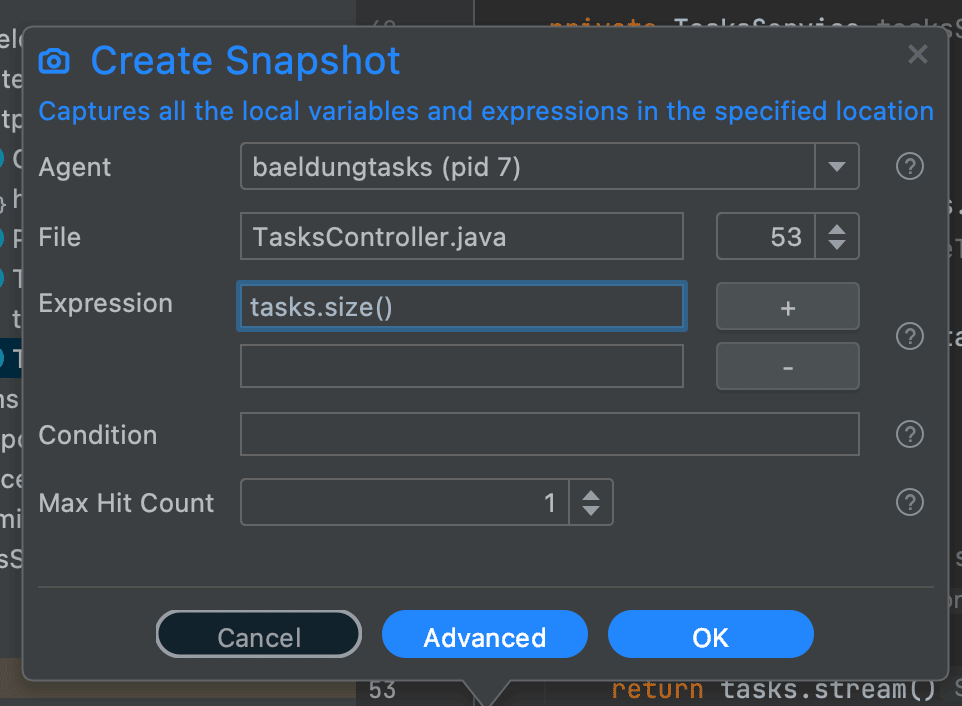
We can add as many expressions as needed to a single snapshot, and all of them will be calculated and recorded whenever the snapshot is triggered.
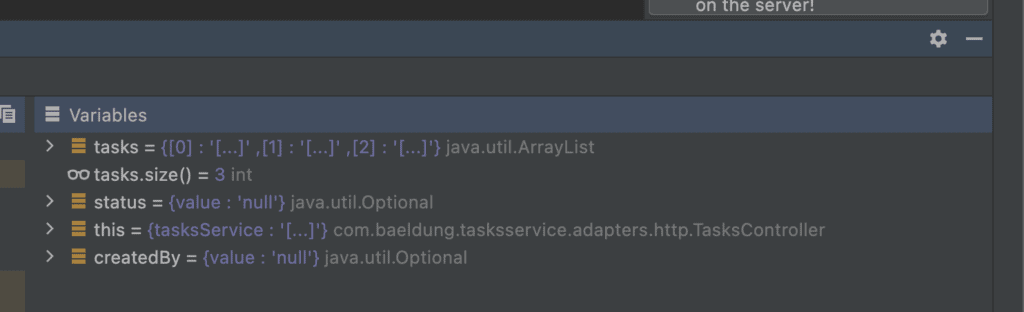
These values then appear in the recorded snapshot as part of the “Variables” pane, with a different icon to indicate that they were manually added expressions instead of automatically detected variables:
2.4. Recording Multiple Snapshots
In some situations, we might want to record multiple snapshots from the same place. For example, we might want to run several slightly different requests through the system and be able to compare the snapshots for them to identify the differences.
Lightrun Snapshots will by default only record a single snapshot, but we can configure it to instead record as many as we want by entering a maximum hit count into the Snapshot dialog:
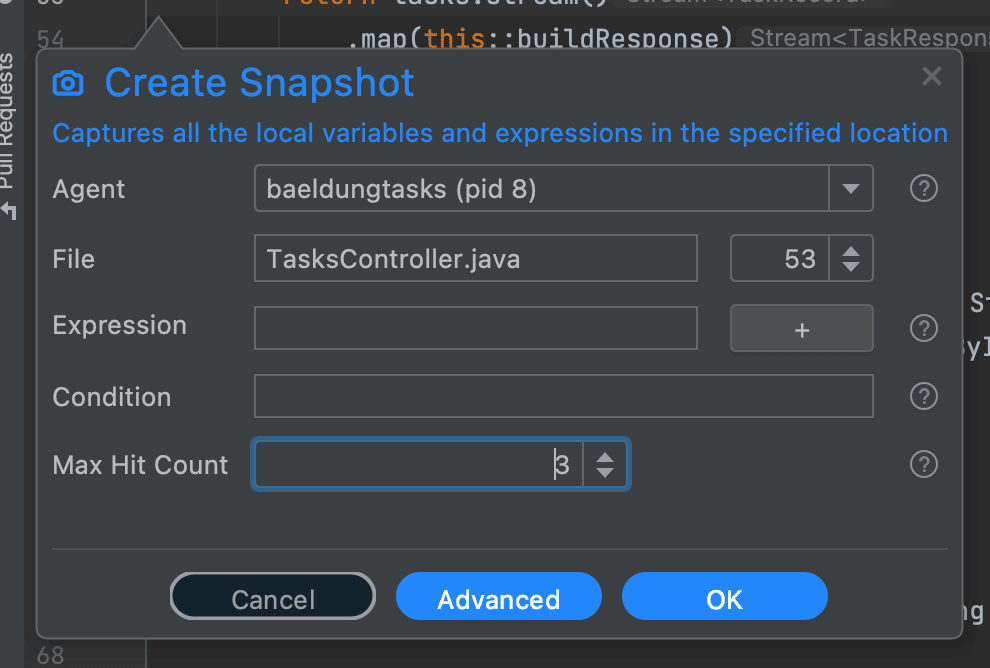
Doing this will then record snapshots for this number of executions, and make them available to us in our editor:
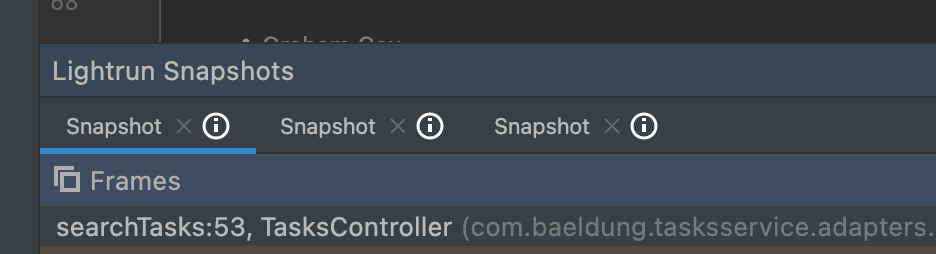
Now that we have multiple snapshots to work with, we need to know which ones are which. By clicking on the “i” icon to the side of the “Snapshot” tabs we get an information dialog about this exact snapshot:
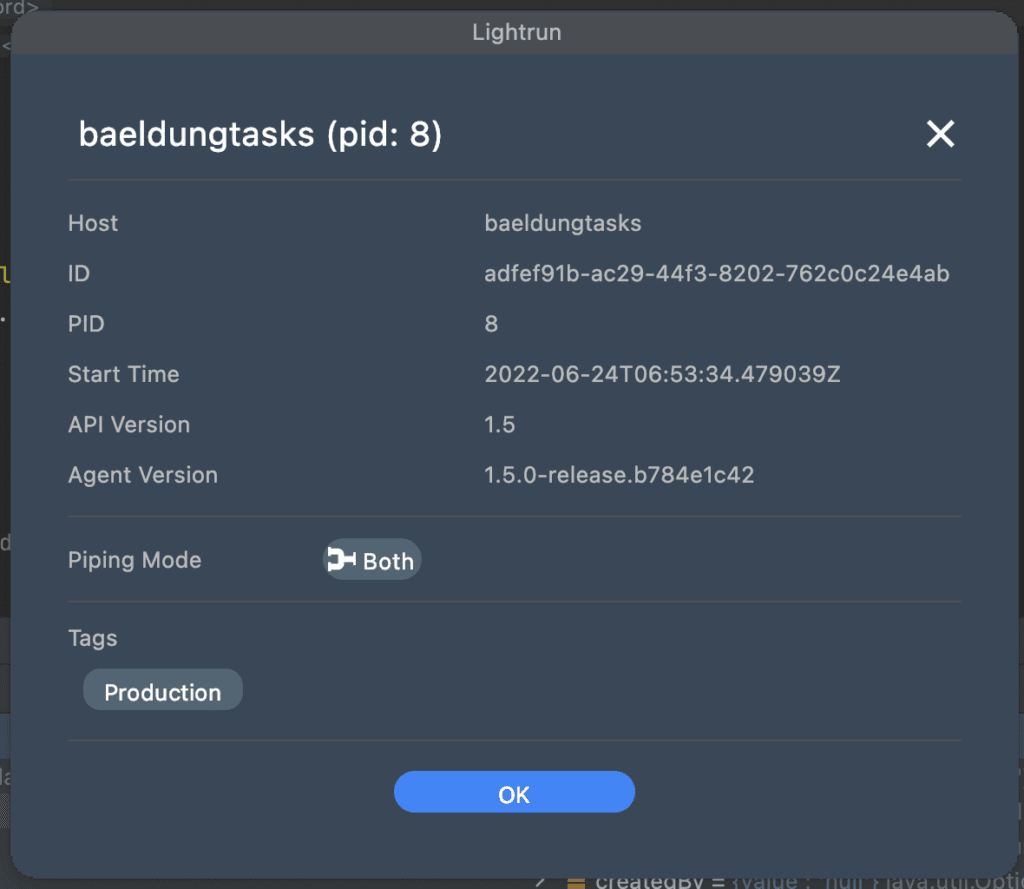
Here we can see the server instance that the snapshot was recorded from and the time that it was recorded. We can now record as many snapshots as we need and determine which ones are which so that we can better diagnose what’s going on.
2.5. Automatically Expiring Snapshots
Recording snapshots does have a small performance cost on our application. They also cause data transfer from our application to the Lightrun servers, which can potentially incur costs. This means that whilst snapshots are immensely useful for diagnosing issues, we want to ensure that they don’t hang around longer than they’re needed. Lightrun solves this for us by automatically expiring snapshots so that they only impact our application for our exact needs and no more.
By default, snapshots will automatically be disabled after 1 hour. We can set this to an incredibly short period of time if we want to do some focused testing ourselves with minimal impact. Alternatively, we can set this to a very long period of time, for example, to capture any occurrences of a particular issue happening overnight, over a weekend, or even longer.
We can adjust the duration for which the snapshot will be active from the “Advanced” section of the Create Snapshot dialog. This gives us an extra option for the Expiry time, which lets us specify, in hours, minutes, and seconds, how long the snapshot will be active for:
After this time the snapshot will remain present so that the recorded snapshots are still available. However, it will stop recording anything – even if we haven’t yet reached the maximum hit count. If we don’t change this then the default will be 1 hour. When this time passes, the camera icon for our snapshot turns red to indicate that it is no longer active:
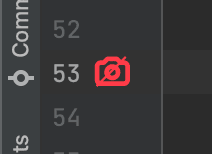
Note that the snapshot remains in our system because otherwise, the recorded data wouldn’t be available. However, it won’t record any more data unless it is re-enabled.
3. Logs
Another facility that Lightrun offers are the ability to add logging statements into our application dynamically without needing to change or restart anything.
Logs are similar to Snapshots in how they are configured but are different in their purposes. Snapshots work by recording the exact state of the thread at the time they are triggered. Logs instead will write out to the log stream the information required.
This means that many log messages – either built into the application or dynamically added by Lightrun – will mix together in the log stream and give a bigger picture of what’s happening. We will get to see both the log messages from our application and any logs added by Lightrun combined into the same stream, giving us a full picture of exactly what is happening.
3.1. Adding Dynamic Logs
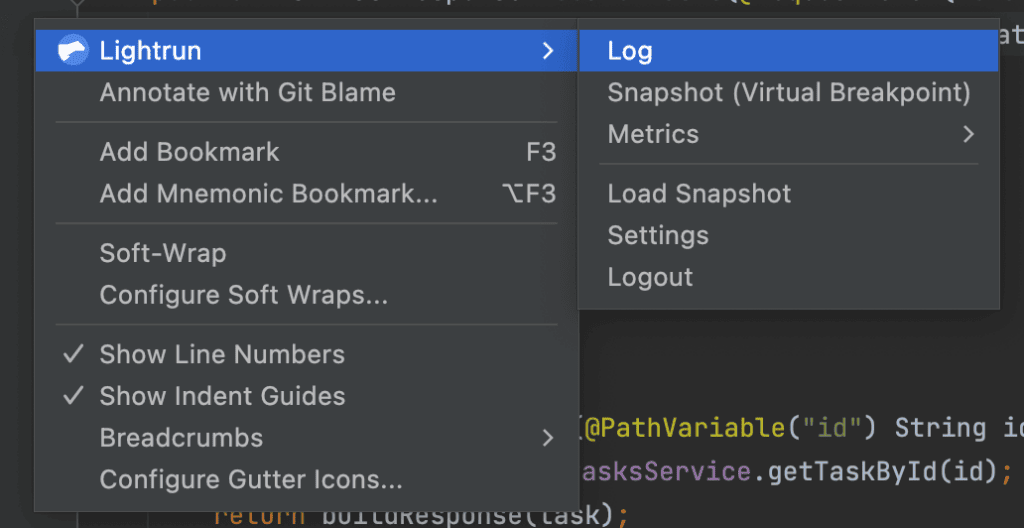
Adding dynamic logs with Lightrun is done in a very similar way to adding Snapshots. We right-click on the line we want to add the log statement before and select “Lightrun > Log” from the menu:
This then gives us a dialog to configure the dynamic log statement with, and then add it to our running application:
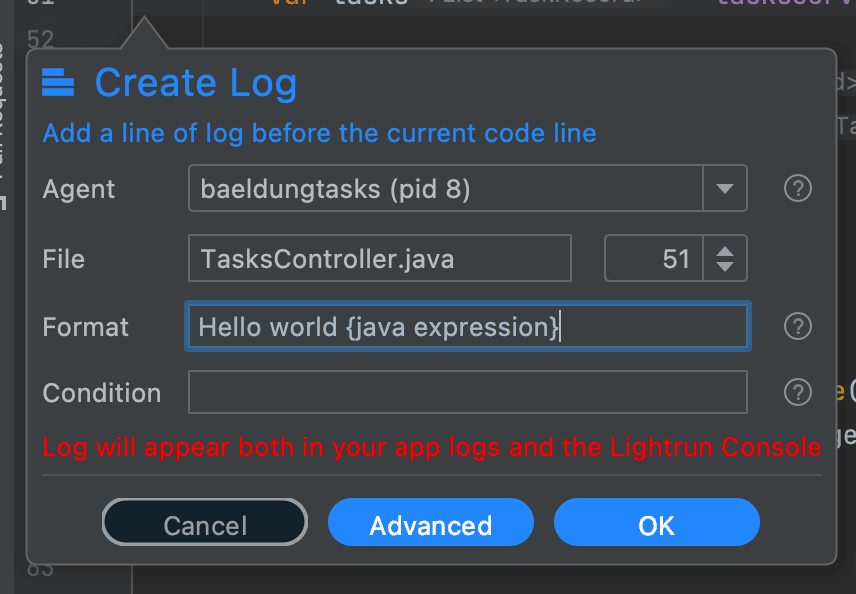
This gives us the ability to specify the log message that will be output – which can include dynamic expressions as part of the message. We can also specify a condition required to trigger the log message, in exactly the same way as snapshot conditions work.
By default, these log messages will expire after 1 hour, but this can also be changed the same as for snapshots by clicking on the “Advanced” button.
Log messages also have a logging level, which defaults to INFO but we can change them to DEBUG, WARN, or ERROR as desired.
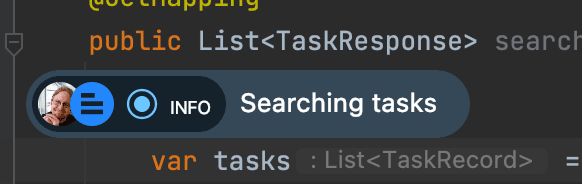
Once we’ve added a log statement, the editor will indicate this in the code view to show where the log statement is and what it is doing:
3.2. Viewing Logs
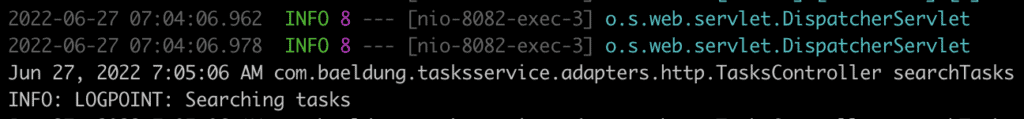
By default, our dynamic log messages are written out using Java Util Logging. In this case, we are able to see them interleaved with any other log messages that the application produces, which can give more information:
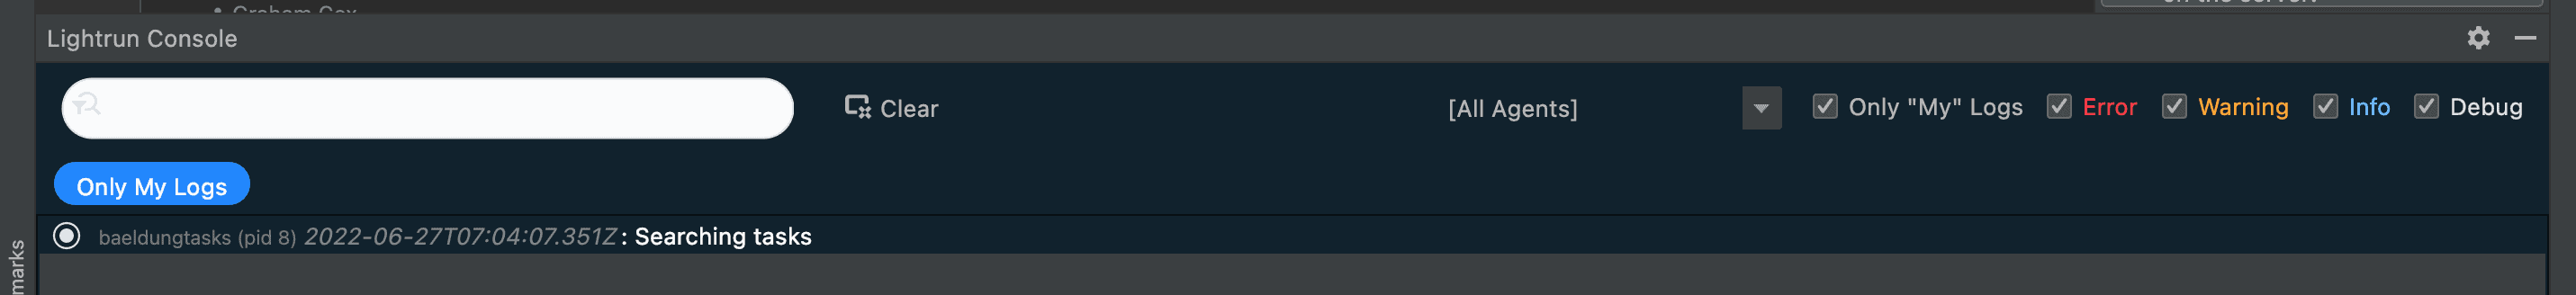
It is also possible to have the log messages sent to our editor to view locally. These can be seen in the Lightrun console similar to how we see Snapshots. This can be very useful if we want to add logging to a system without adding extra noise to the output log files, especially if those logs are being consumed by other team members or other systems:
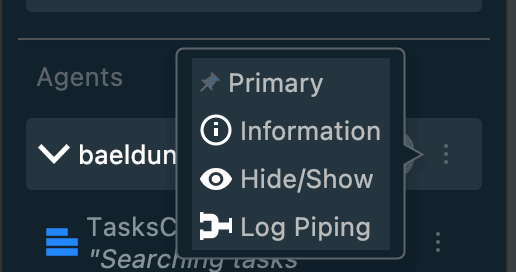
We can change where the log messages output goes by opening the agent menu in the sidebar and selecting Log Piping:
From here we can select between App – which means writing to the configured Java Util Logging setup of the application, Plugin – which means writing to the Lightrun Plugin active in our editor, or Both. Note that this is done for an entire Lightrun agent and not for individual log messages.
Because of the way the Lightrun agent works, the Java Util Logging config is not the standard one from the application. Instead, there are some Lightrun agent flags that are needed to configure the destination and output format of the Lightrun dynamic logger when it’s writing to Java Util Logging.
3.3. Logging Expressions
Logging simple strings is already useful. However, logging values from the application is significantly more useful. In the same way that our snapshots can include custom expressions, we’re able to do this for logs.
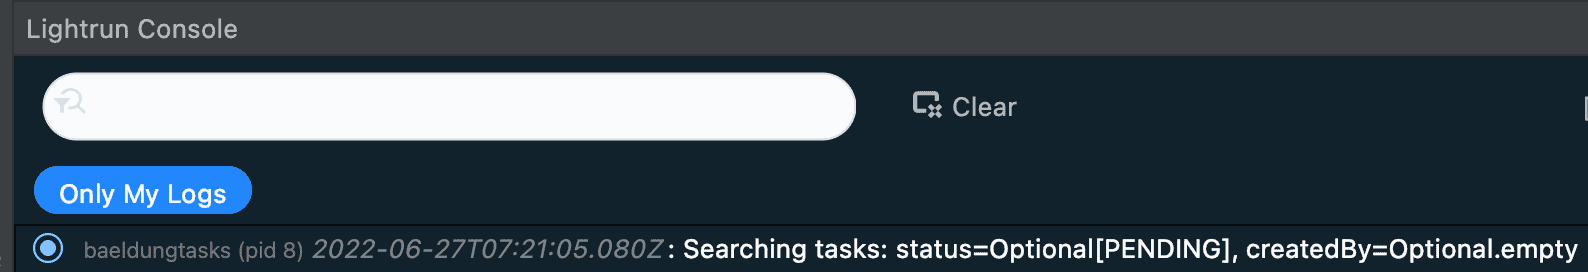
When we do this with logs, we’re adding the expression directly into the log message. This is done by wrapping the expression in curly braces:
Searching tasks: status={status}, createdBy={createdBy}When we do this, any of these expressions will be automatically expanded when the log statement is generated:
These expressions can be anything that can be determined at the point the log statement is generated, in the exact same way as for snapshots.
These expressions can sometimes take up a lot of CPU time to calculate. If this happens, Lightrun may automatically pause a particular log so that they do not interfere with the running of the application. As such, it is recommended to keep logging expressions as simple as possible.
4. Metrics
The final action that we can perform with Lightrun is to record some metrics about our application. This gives us the ability to see usage details of our application – for example, how often certain things happen or how long they take.
In the same way as with Snapshots and Logs, Metrics are added by right-clicking on the appropriate line of code and selecting “Lightrun > Metrics”:
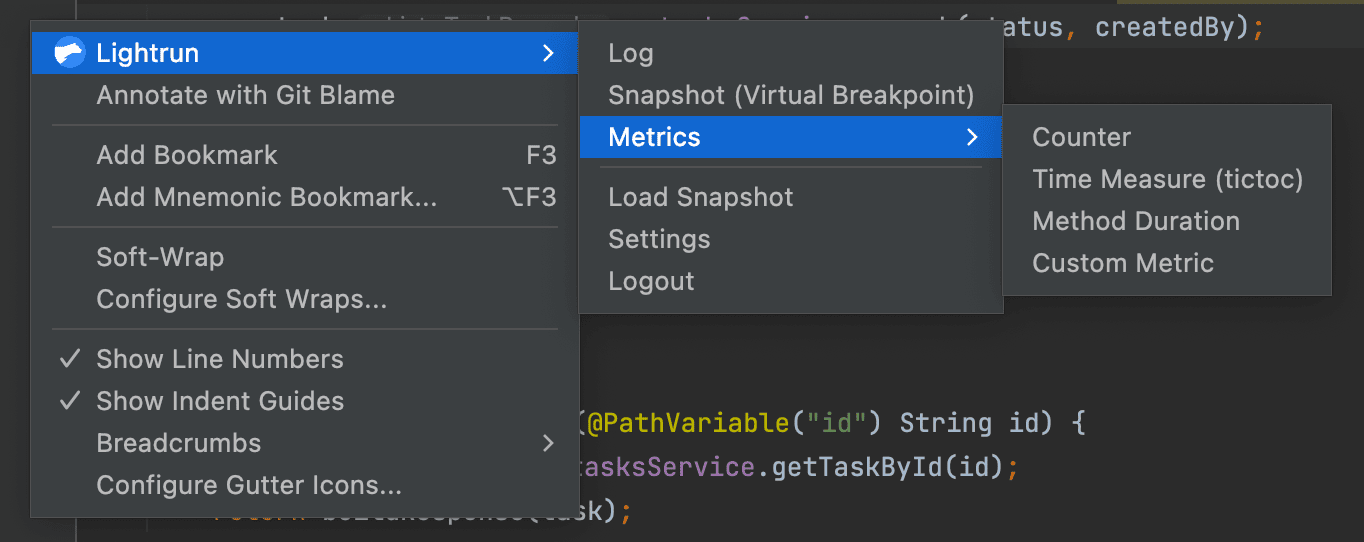
Immediately we can see that this is slightly different – we have different types of metrics that we can add:
- Counter – This records a simple count of the number of times a line of code was executed.
- Time Measure – This records the time it takes to get between two lines of code.
- Method Duration – This records the time it takes between entering and exiting a method.
- Custom Metric – This uses a custom expression to generate the metric, based on values available in the code.
In each case, we get the standard Lightrun dialog for creating our metric. This lets us configure the metric, including adding a name for the metric, conditions under which it is triggered, and an expiry time after which it stops working – in the exact same way that we can for Snapshots and Logs.
These metrics are output to the logging process by default, but can also be integrated into StatsD, Prometheus, and other tools if desired.
4.1. Counters
Counters are a simple measure of the number of times some code was executed. Every time our line of code is reached, the counter increments by 1, and we can then see how often this has happened.
Adding a counter is done by selecting Counter from the Lightrun menu and then filling in the dialog:
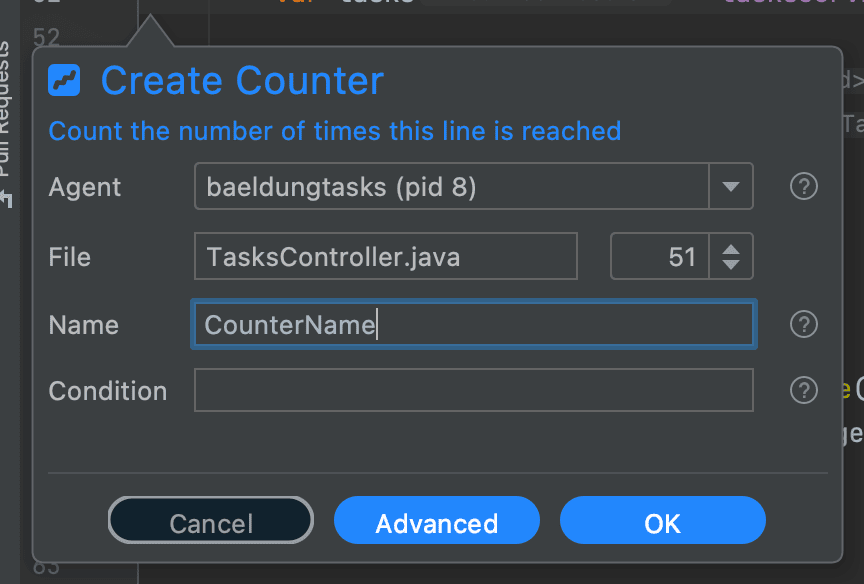
Most of this is fairly standard. The only bit that is unusual is the “Name” field – we need to give every counter a unique name so that we can track them all.
In particular, one powerful feature here is that we can set up counters – as with all of the metrics – that have conditions attached to them. This gives us the ability to count the number of times a certain line of code is reached only when other conditions are met, for example only for a certain user or affecting certain records.
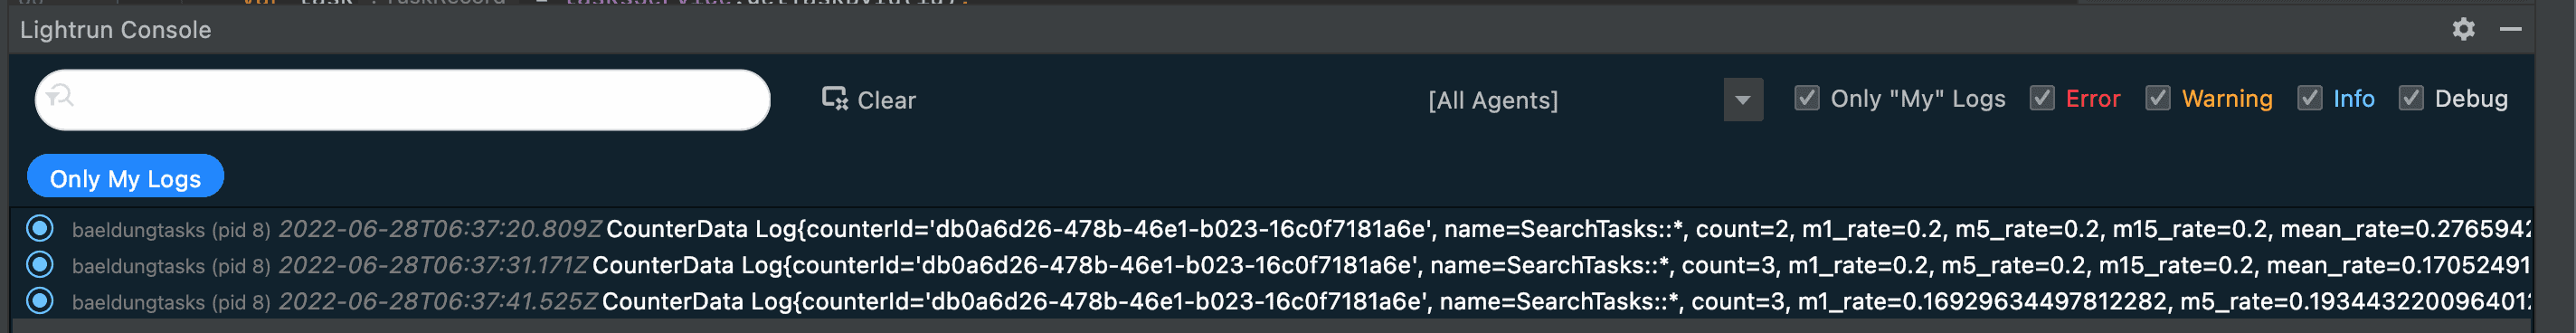
Adding a counter doesn’t do anything immediately. However, once it is triggered for the first time, it will start reporting out the metric values in a similar way to how logs are output – to the logging output based on the piping setting.
Our editor shows the values from the metric every 10 seconds:
Whereas the log output shows the metric every second:
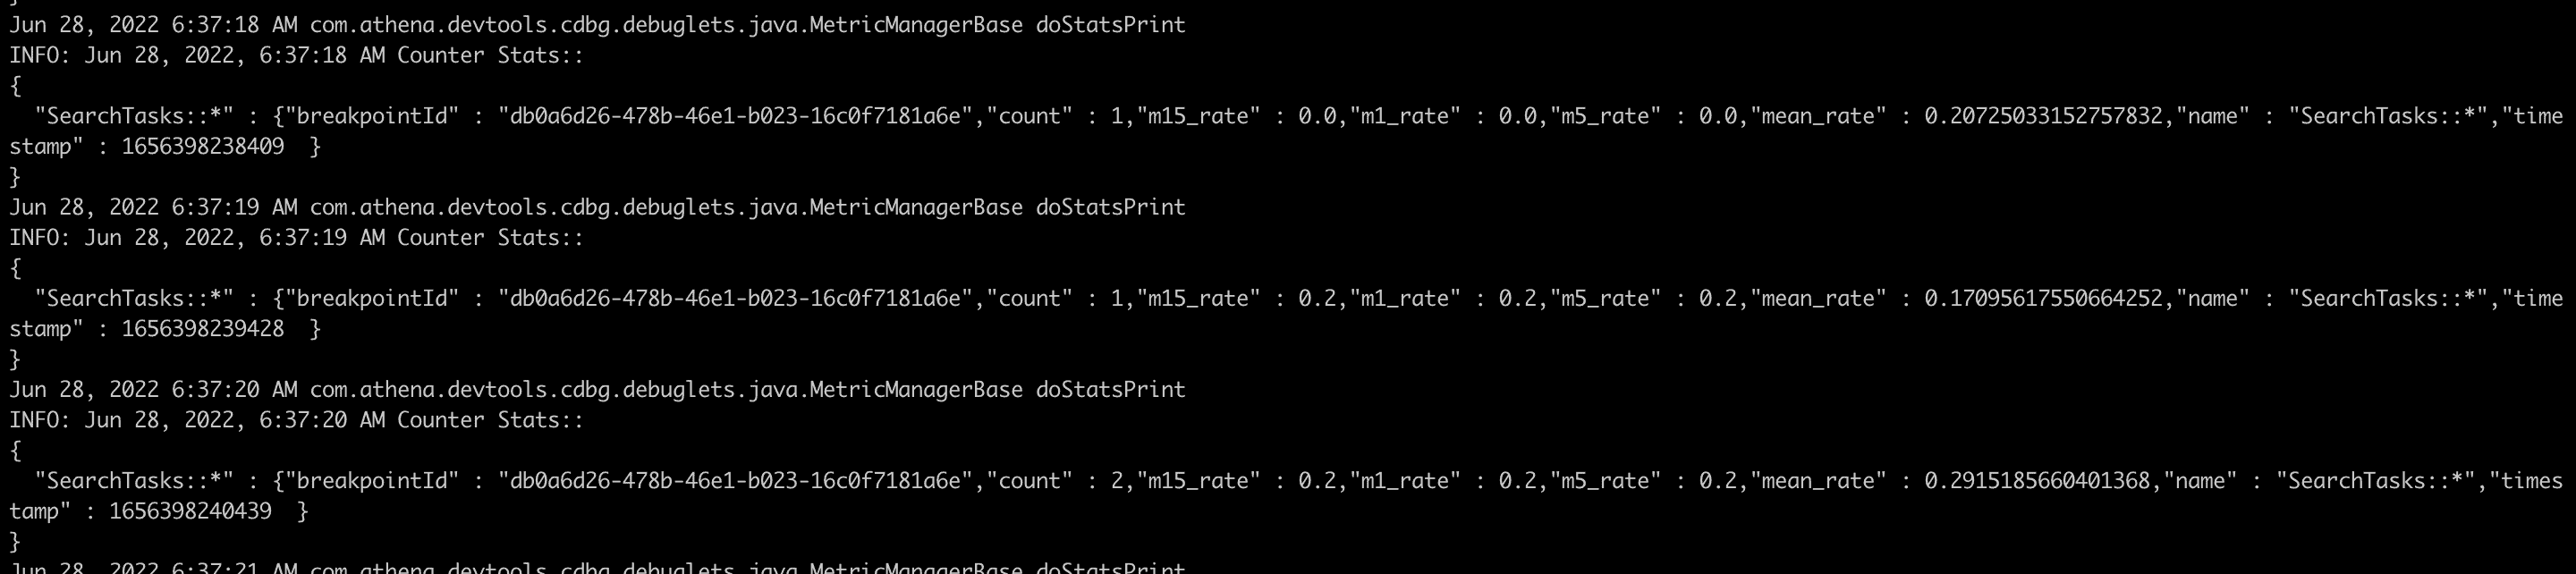
This output is controlled by the exact same setting as log output and will interleave our metrics with our logs to give a better picture of what is happening. This lets us track over time how the metric has changed, to see the rate at which the code was triggered.
4.2. Time Duration
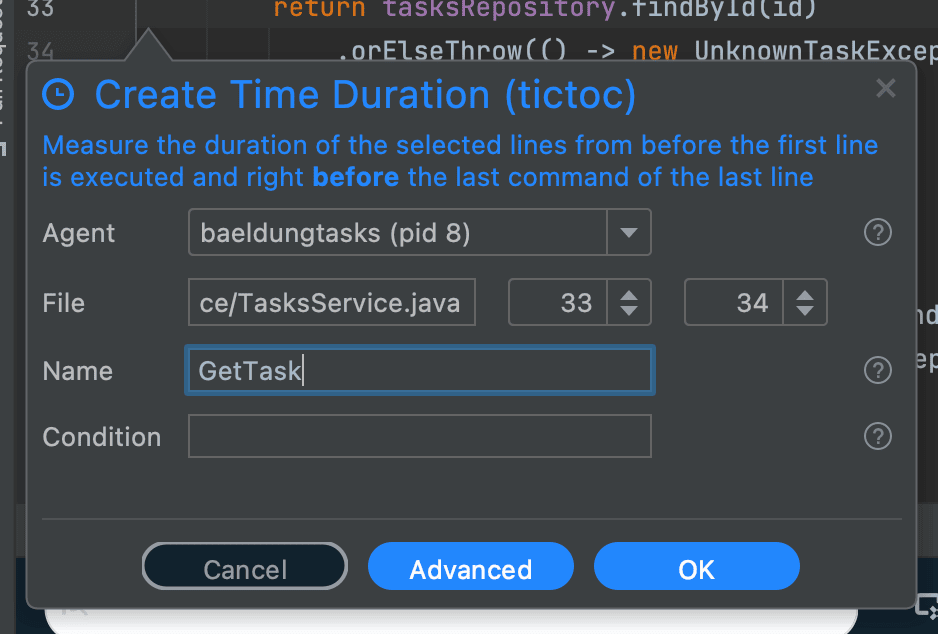
Where Counters are used to measure the number of times a line of code was executed, a Time Duration is used to measure how long the code is running. These are also called “TicToc” metrics – Tic to start recording and Toc to stop recording, similar to the noise of a clock.
When creating a time duration, we need to configure exactly which piece of code we’re measuring. This is done by specifying the lines to start and stop recording on – either by selecting a block of code before opening the dialog or by entering the line numbers within the dialog:
Other than this, creating a time duration is the same as creating a counter.
Once created, these metrics will start outputting immediately, rather than waiting for the first time they are triggered. These outputs are to both the plugin and application standard output, exactly the same as for counters, and will show us how often the section of code was run and the fastest, slowest, and mean times that the code has taken to run:
4.3. Method Duration
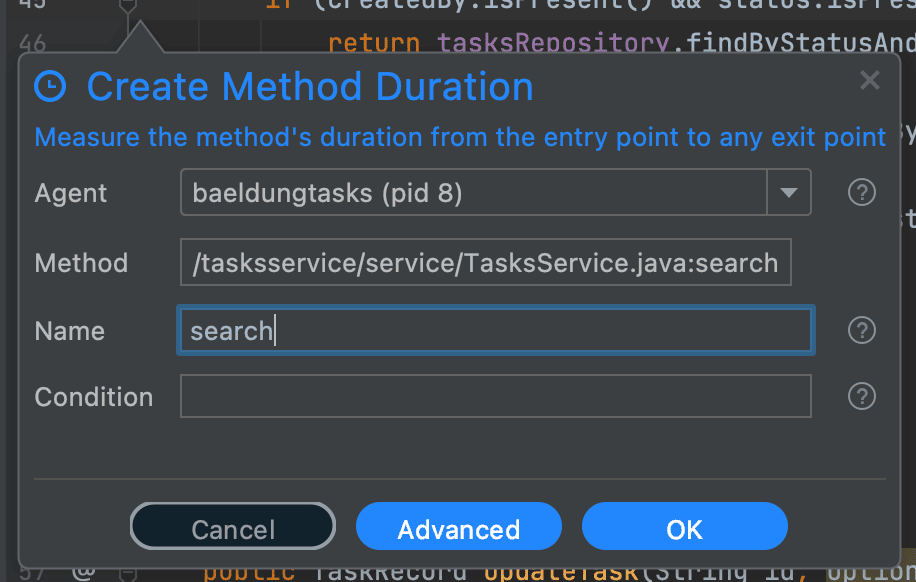
Method Duration metrics are essentially the same as Time Duration, but instead of specifying start and end lines we specify the full method:
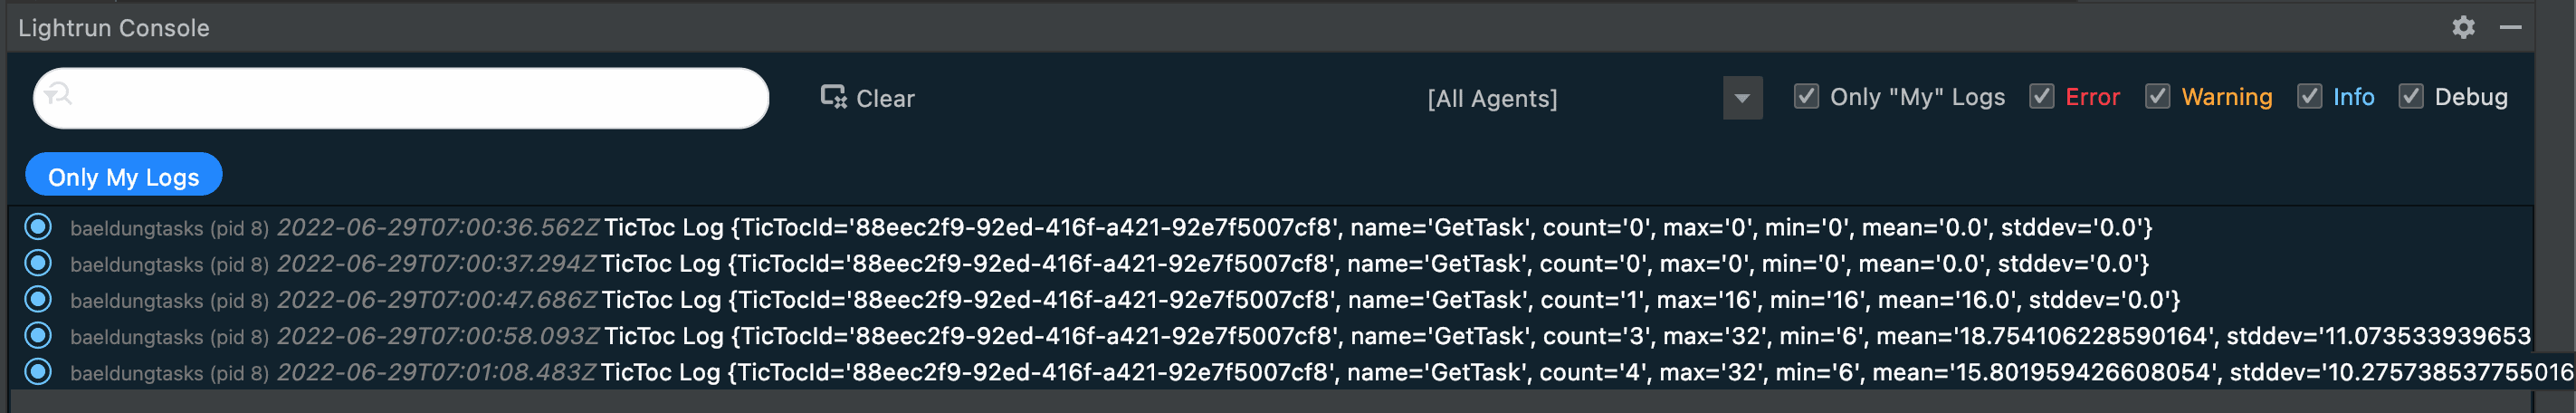
Once added, this functions exactly the same as time duration metrics covering the whole method body. The start time is considered to be when the method is entered, and the end time is when it is left, regardless of whether it’s by a return or an exception:
We can see from the output here that these are actually “TicToc Log” entries too, only Lightrun has automatically determined the start and stop points for us based on the method itself and not based on lines of code.
4.4. Custom Metric
Our final metric is simply a custom metric. This lets us aggregate numbers that are present in our code somehow, whatever those numbers are. For example, we might want to count the number of records returned in some search results.
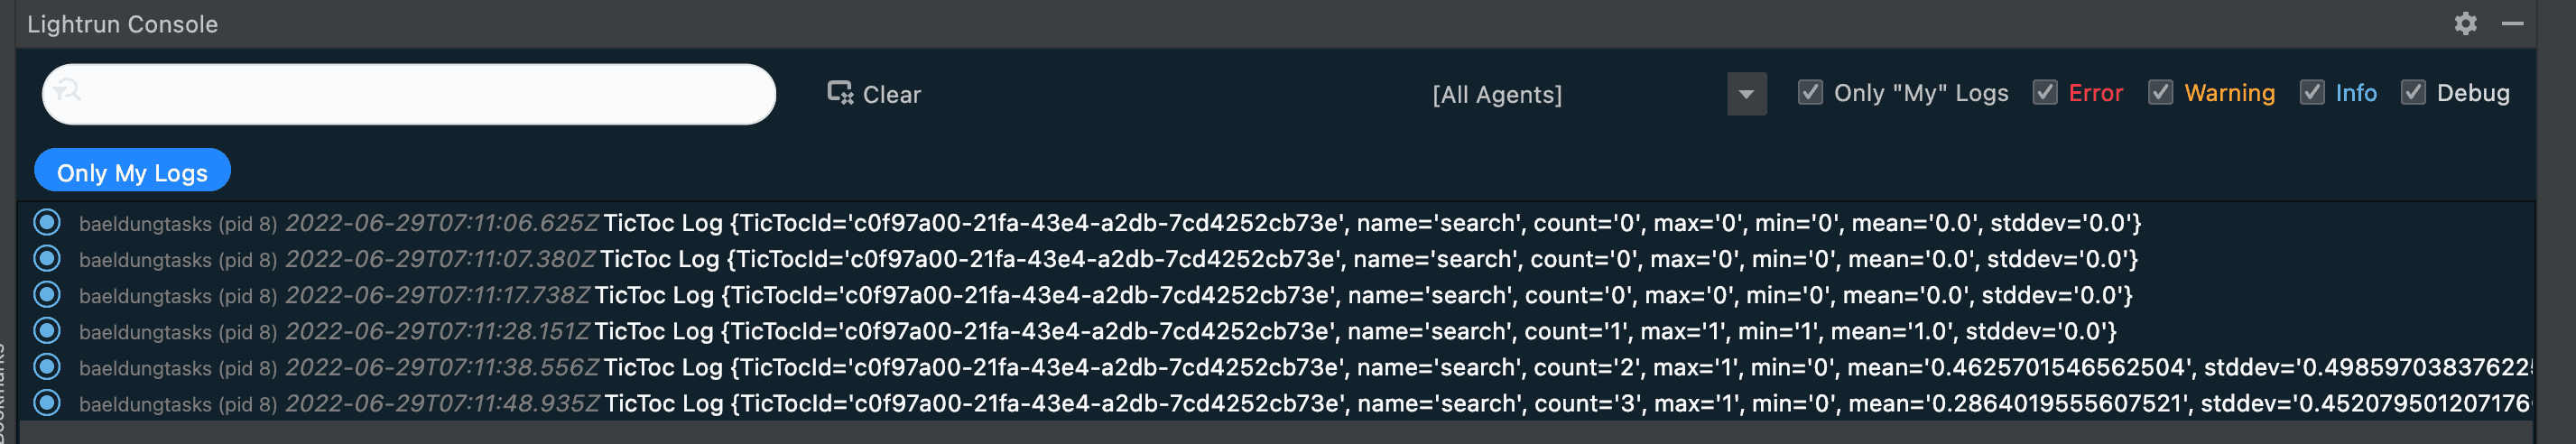
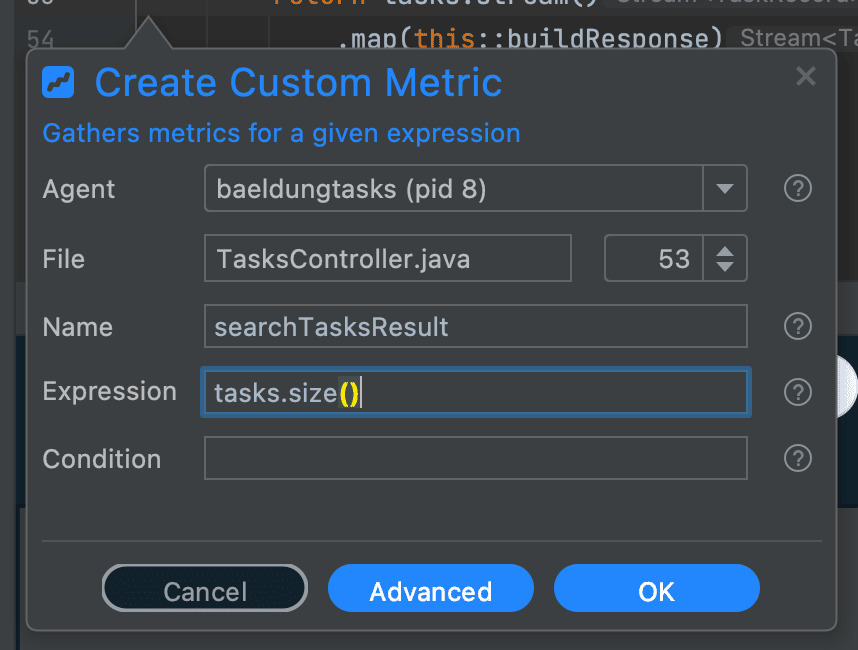
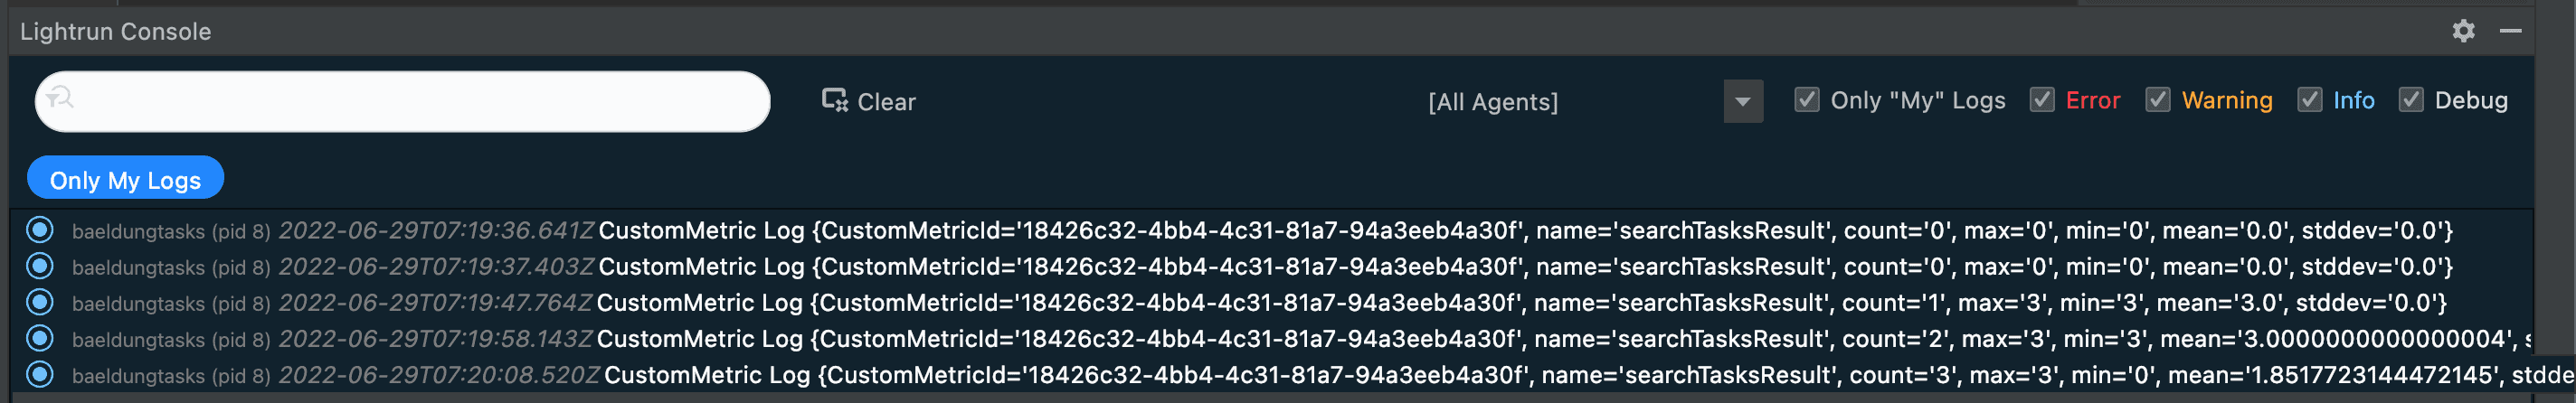
When creating this type of metric, we’re required to specify an expression. This expression returns the number that our metric will aggregate, and like elsewhere it can be any expression that can be calculated at this point in our code:
When these metrics output, it shows us the number of times it was triggered and the maximum, minimum, and mean values for our expression:
5. Summary
Here we have covered in detail the main ways that Lightrun can give us more insight into our applications and better understand how they are working.
Why not use it in your next application, to better understand what is going on or even to help diagnose any issues that might be going on?