1. Introduction
We’ve recently looked at Lightrun – a Developer Observability platform – to see what it can offer us to observe better and understand our applications.
Spring heavily uses annotations to control various pieces of functionality, which can work in multiple ways. This can make writing applications incredibly efficient – we only need to add an appropriate annotation to enable functionality. However, when this doesn’t work, diagnosing can be frustrating since there are no direct method calls to look through.
In this article, we’ll explore using Lightrun to diagnose how Spring annotations work within our application.
2. Debugging Transaction Boundaries
Spring uses the @Transactional annotation to mark methods that should execute within a transaction. This works by Spring detecting the annotation at construction time and constructing a JDK Proxy to wrap our class instance. This proxy is responsible for handling all the transaction boundary details. This ensures that the transaction starts before our method and is correctly tidied up after it finishes.
Therefore, debugging transactions means we must first identify where we need to look. This can most easily be done by adding a snapshot to one of our transactional methods and executing it, therefore capturing a stacktrace:
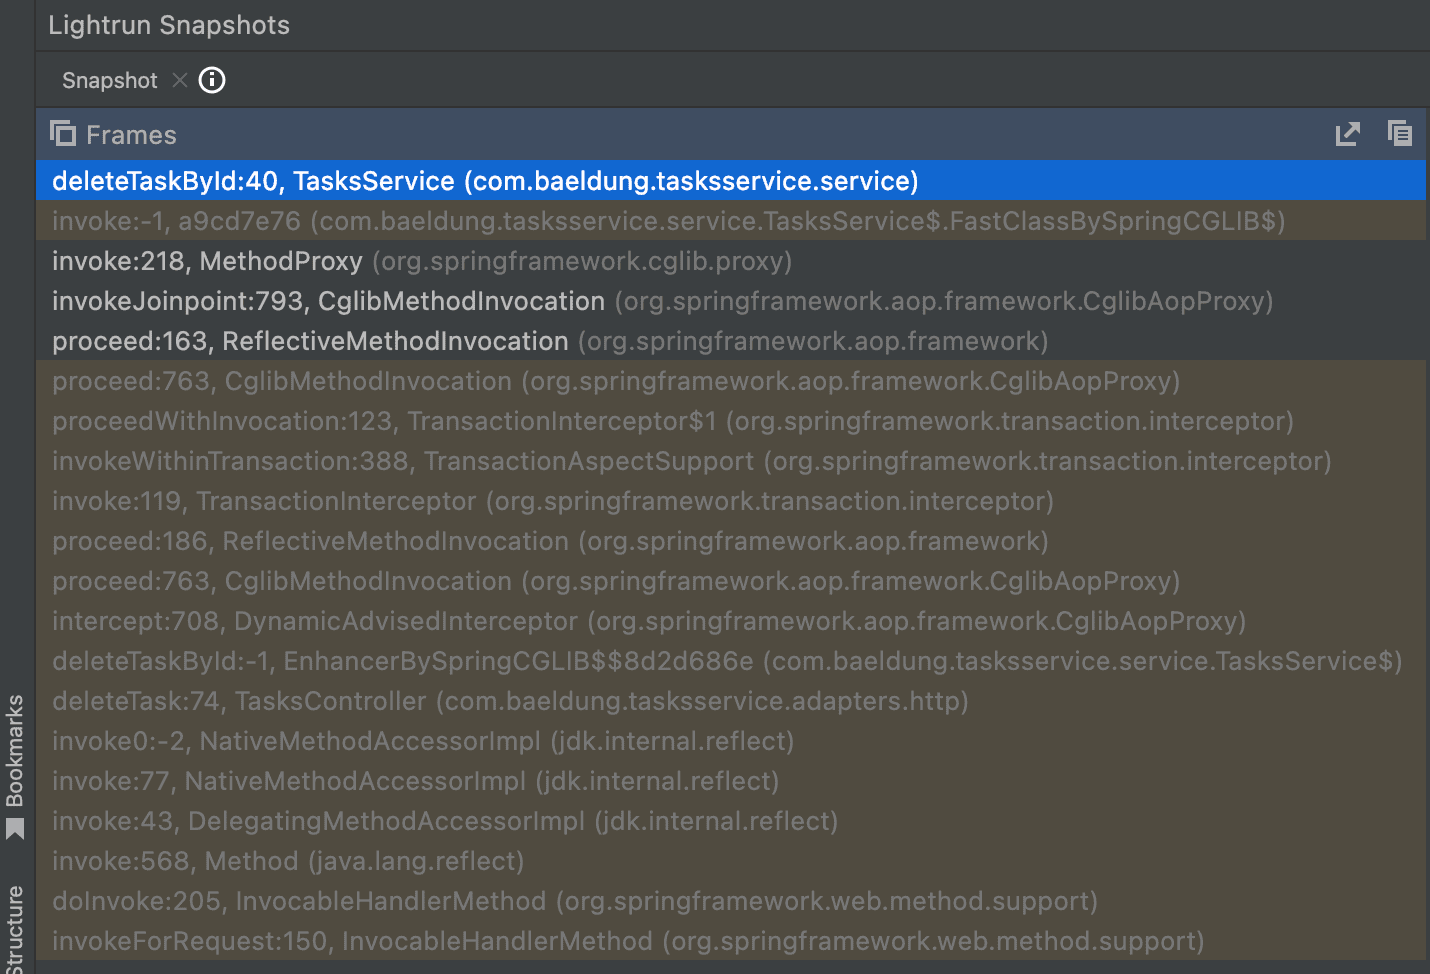
Here we can see the entire stacktrace between our controller – deleteTask:74, TasksController – and our transactional service – deleteTaskById: 40, TasksService. Since our code has this as a direct method call, Spring inserted everything between the two for us.
So now we need to determine which of these is important. Many of these entries focus on the proxy and the reflection calls needed to make things work. However, there are three in the middle that sound very focused on transactions instead:
- invoke:119, TransactionInterceptor
- invokeWithinTransaction:388, TransactionAspectSupport
- proceedWithInvocation:123, TransactionInterceptor$1
Further, we can infer from these method names roughly what is happening. It seems highly likely that invokeWithinTransaction is the place within the Spring code where the transaction boundary is managed. As such, this is the place we should focus on for debugging precisely what is happening.
If we open this code in our IDE, we can see exactly what is happening here:
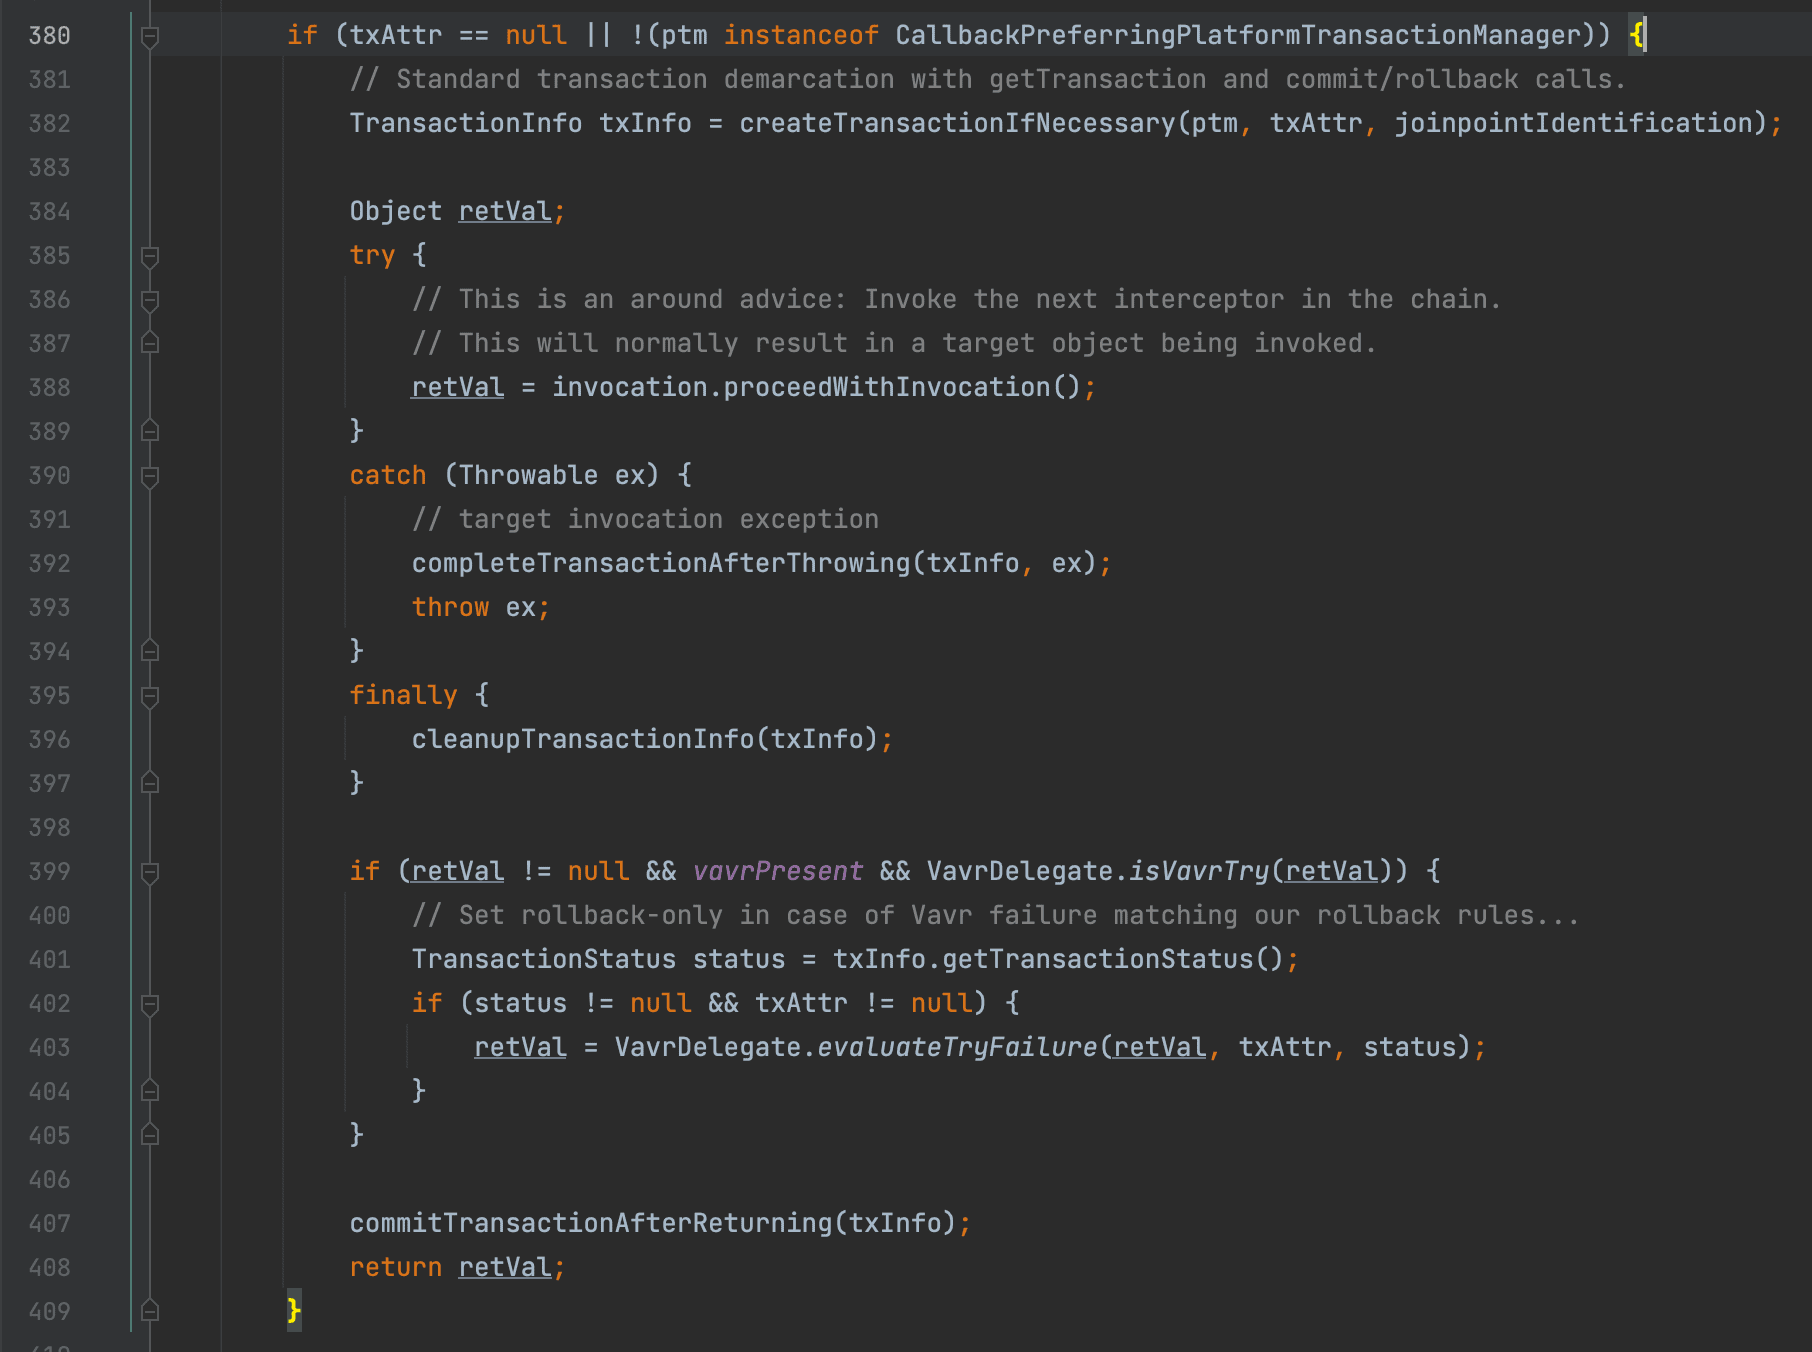
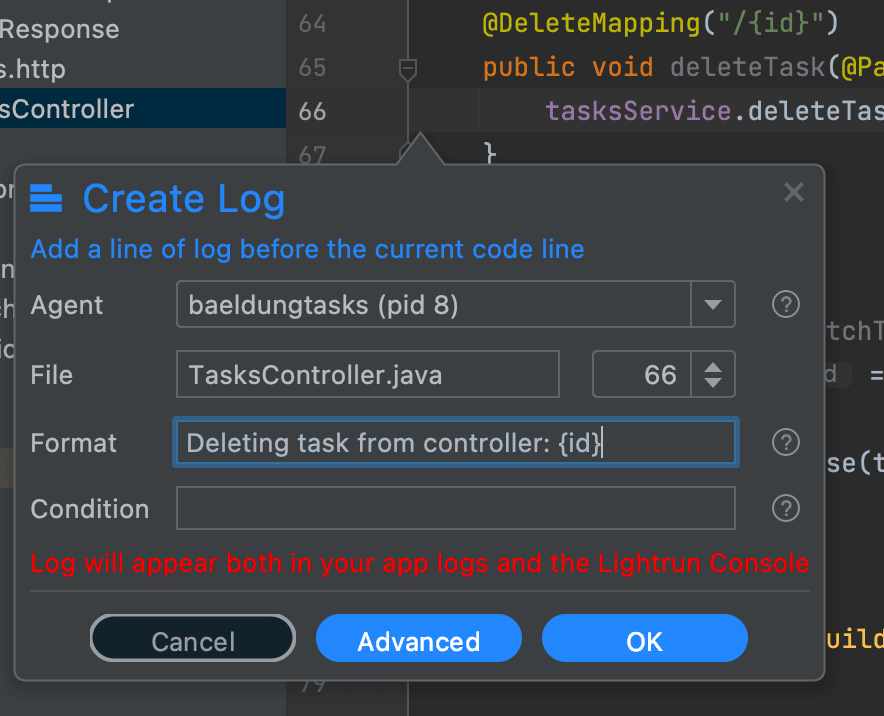
To better understand how this influences our code, we can use Lightrun to add logs to some appropriate lines at runtime. For example:
- A log after line 382 shows the newly started transaction.
- A log on line 392 shows if an exception has aborted the transaction.
- Finally, a log on line 408 shows the result at the end of the transaction.
If we then add logs to our controller and service – so that we can see actions both inside and outside of our transaction – then we can see exactly what is happening:
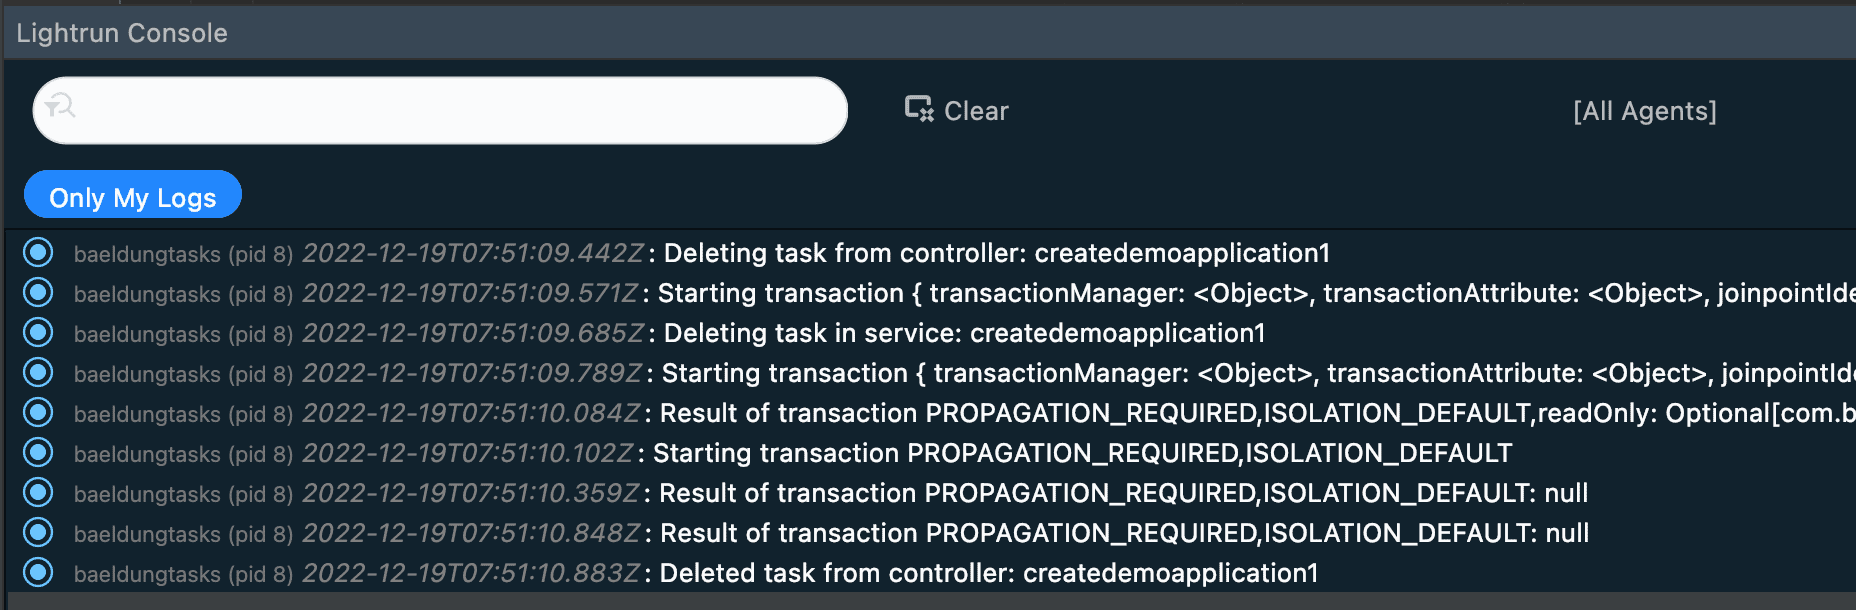
So we can see that there are three Spring transactions started here – one is outside of our service call, and the other two are inside of it. These two inside the service coincide with the fact that we have two repository calls involved here. However, because they all have PROPAGATION_REQUIRED then, they actually participate in the same database transaction instead.
This already gave us information about exactly when the transactions start and finish, whether they will roll back, and what the output is. And we did all of this without ever interrupting the running application.
3. Debugging Caching Boundaries
Spring supports caching method results by adding appropriate annotations to our method calls. Doing this will cause Spring to automatically insert code around the method call to cache the result and to return the cached value instead of actually calling the method if that’s deemed appropriate.
Caching is notoriously difficult to debug because a cache hit will mean that the underlying code is never called and thus will not fire any logs within it. This includes logs that we’ve written directly into the code but also logs added by Lightrun. However, Lightrun allows us to put these logs in our code and the caching code itself.
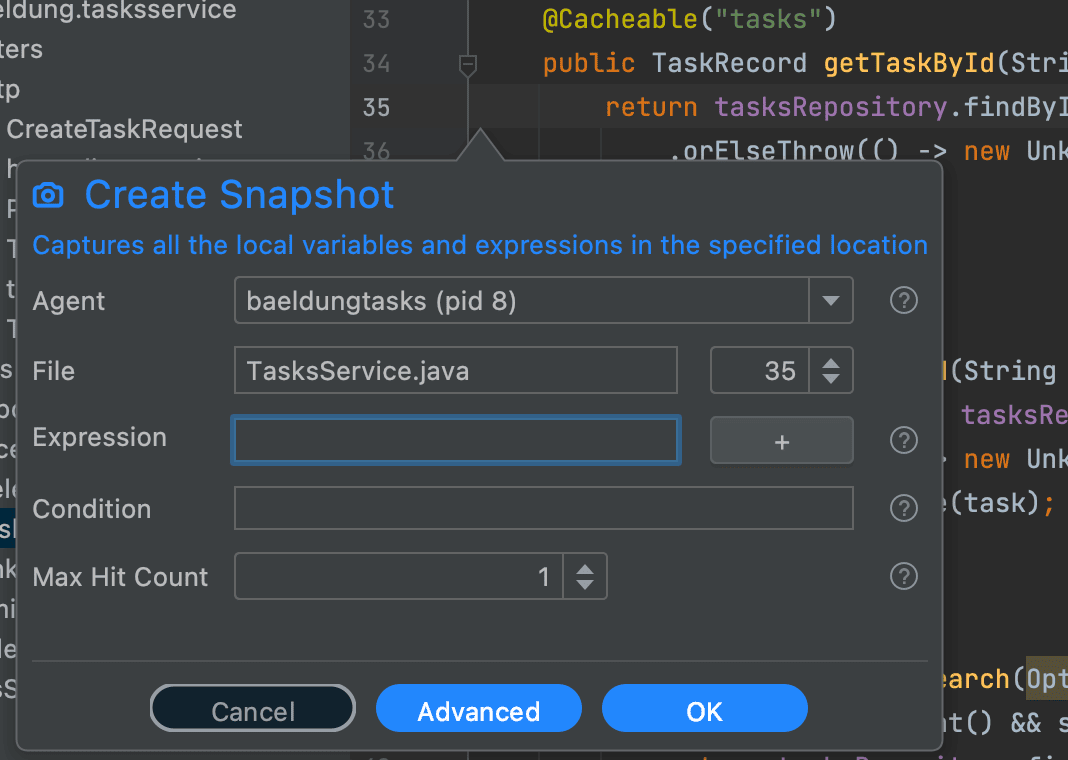
As before, we can use a Snapshot to get a view of our code and all the bits that Spring has injected in between:
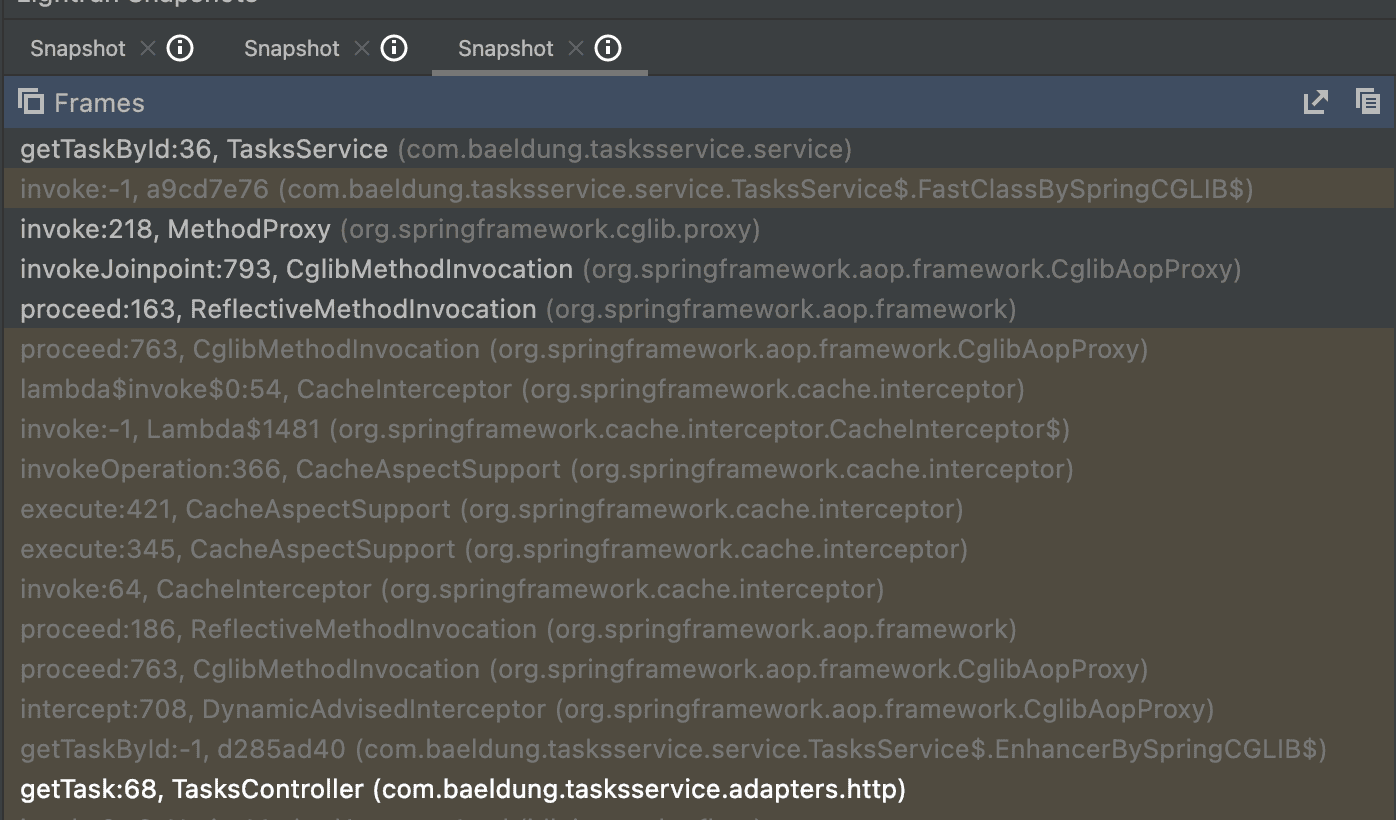
Here we can see our controller and service and all the calls that Spring has inserted between. In this case, the classes of interest are CacheInterceptor and CacheAspectSupport. If we look further, we will see that CacheInterceptor is actually a subclass of CacheAspectSupport, so this is actually all one class anyway.
In particular, from inspecting the code, we can see that the interesting functionality is in CacheAspectSupport.execute():
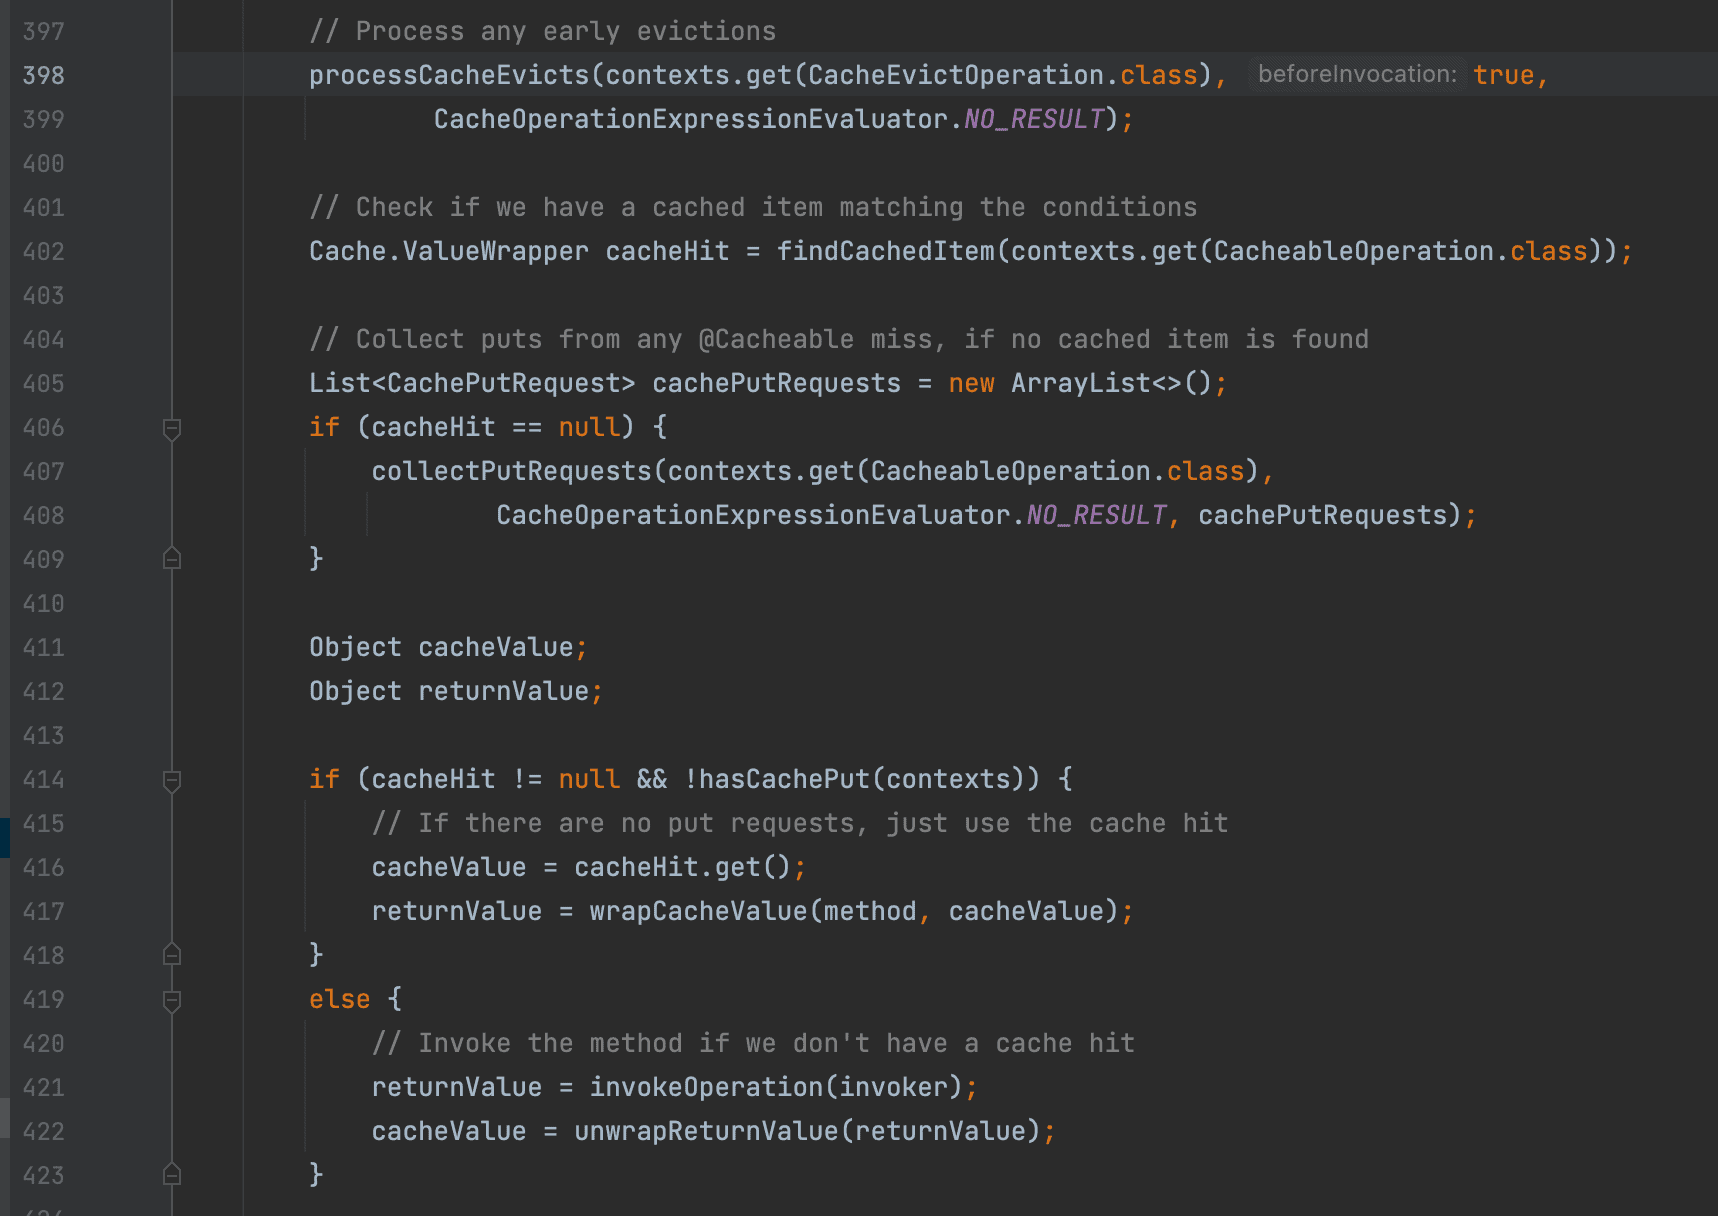
In the middle of this, we can see that we’re checking if the cache was a hit or a miss and acting accordingly. As such, we can use Lightrun to add some logs around here to see exactly what’s going on regardless of whether it’s a cache hit or miss:
- A log on line 414 allows us to see whether we have a cache hit or miss.
- A log on line 421 allows us to indicate that we’re about to call our underlying method.
- A log after line 423 shows us the return value, whether it was a cache hit or miss.
We can now see exactly what is happening with our cached results:
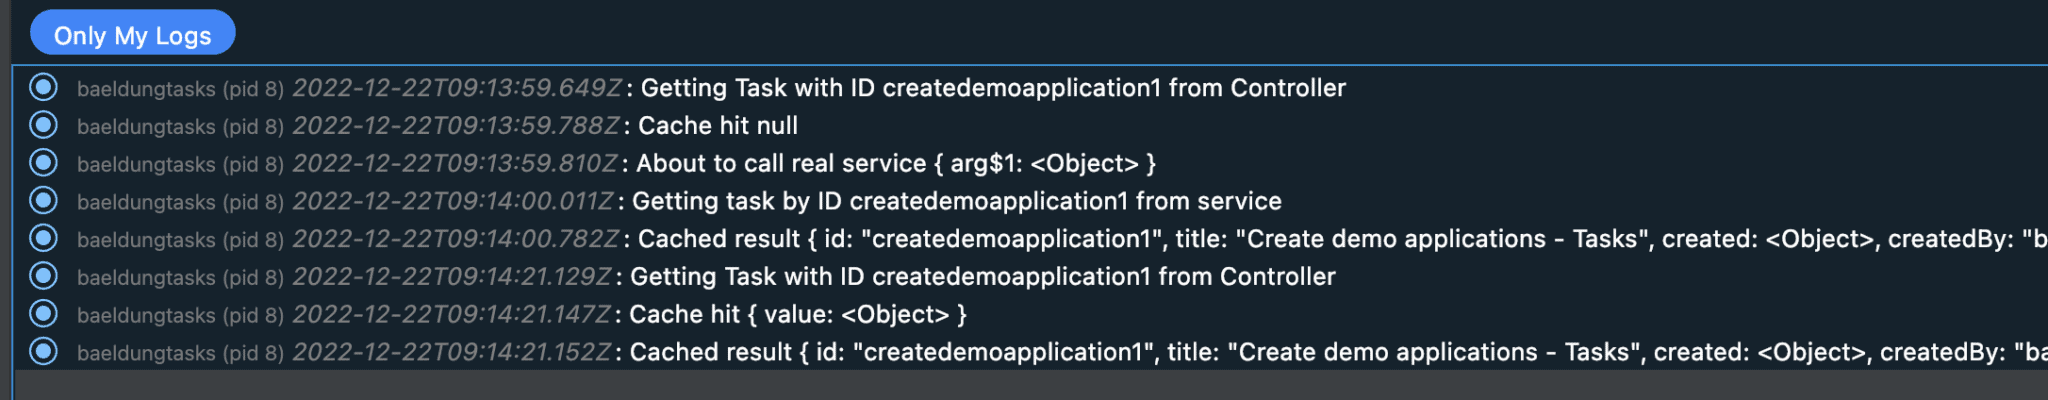
Here we can see two calls to retrieve the same resource. The first one comes in, gets a cache miss, and goes on to call the real service. The second one comes in, gets a cache hit, and so the real service isn’t called.
Without Lightrun, the best we could see would be that the controller gets called in both cases and the service is only called in the first case, but we’d have no idea why that was the case.
4. Debugging Request Mappings
Spring WebMVC is an essential part of the Spring framework, and fundamental to how it handles HTTP requests and forwards them to the correct controllers. However, it can be frustrating to work out precisely what is happening if this goes wrong.
Lightrun gives us some extra tools to see exactly what’s going on in the same way as before. However, this is slightly more effort to achieve because Spring’s internals is more complicated in this area.
As before, to start with, we need a way in. We do this by adding a snapshot to any controller and then triggering it to get a stack trace showing the calls leading to the controller method:
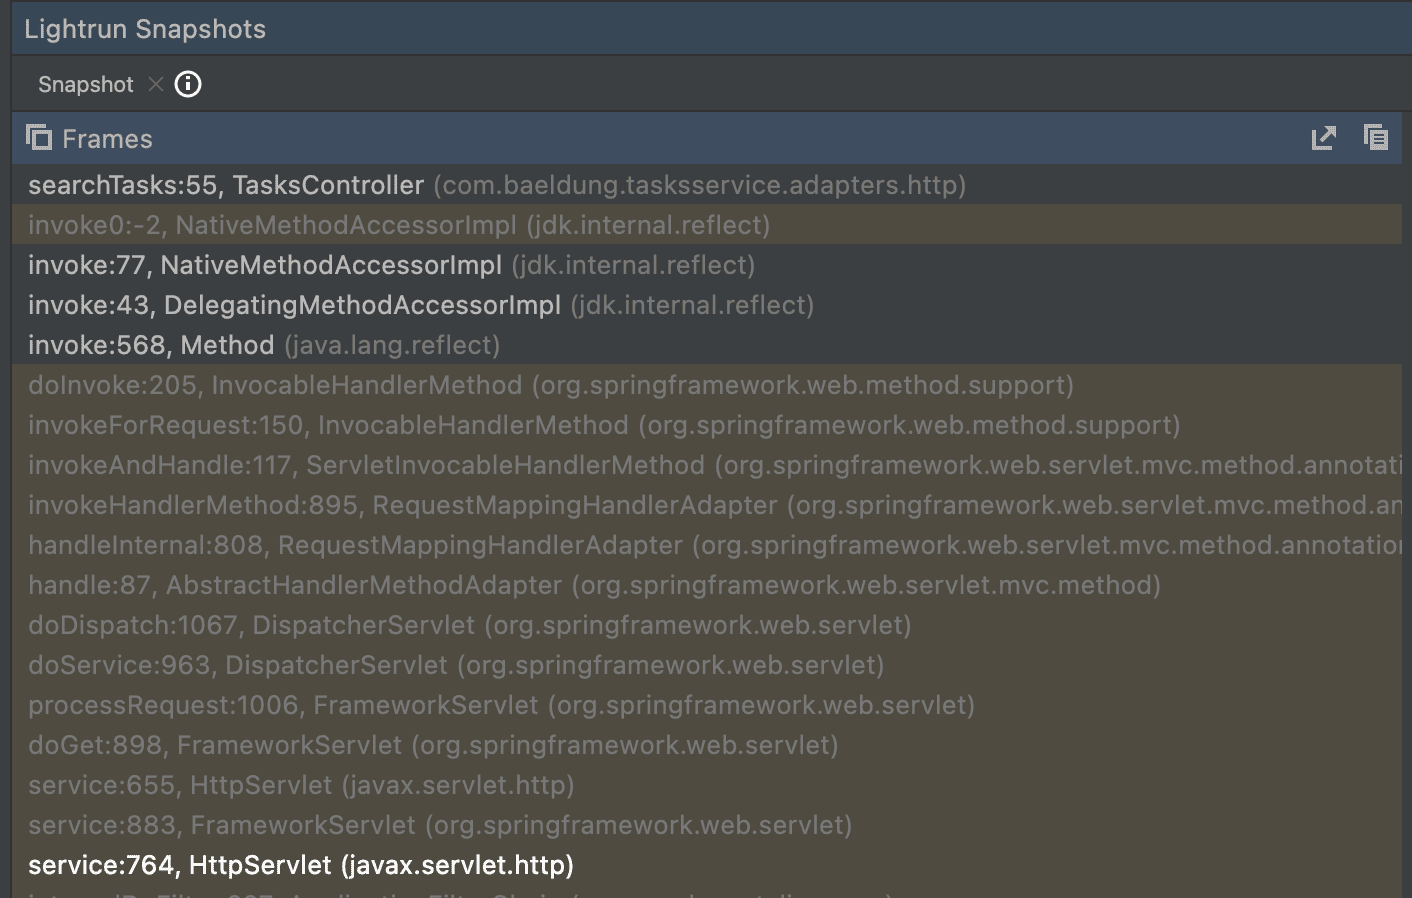
After some exploration, we can see that DispatcherServlet.doDispatch() is interesting because it has a call to getHandler(). This seems like the place that will determine the handler to use for a given HTTP request. This shows us several stack frames throughout Spring that lead to our controller.
Looking inside this, we can see that it iterates over a collection of HandlerMapping instances and asks each of those in turn if it can handle the request:
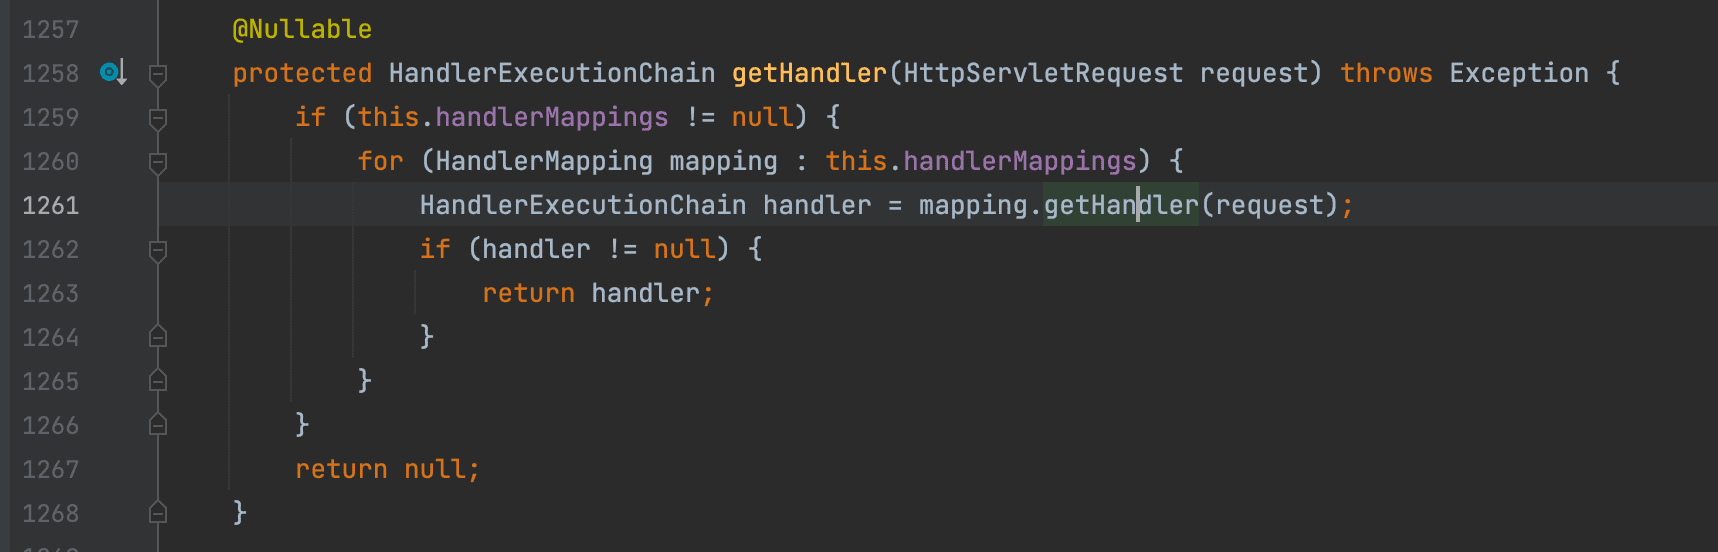
This is an abstract method with a few options, so let’s add a log statement on like 1261 and see what’s actually happening:

This immediately shows us the involved handler mappings. And, importantly, the last one is the one that returned something for this request, so let’s look there next.
The actual implementation of getHandler() within RequestMappingHandlerMapping is in the superclass AbstractHandlerMapping. However, this immediately works in terms of getHandlerInternal() within AbstractHandlerMethodMapping. That works in terms of lookupHandlerMethod(), so let’s look there instead.
The first interesting part seems to be addMatchingMappings(), so we’ll add a log into this and see exactly what happens:
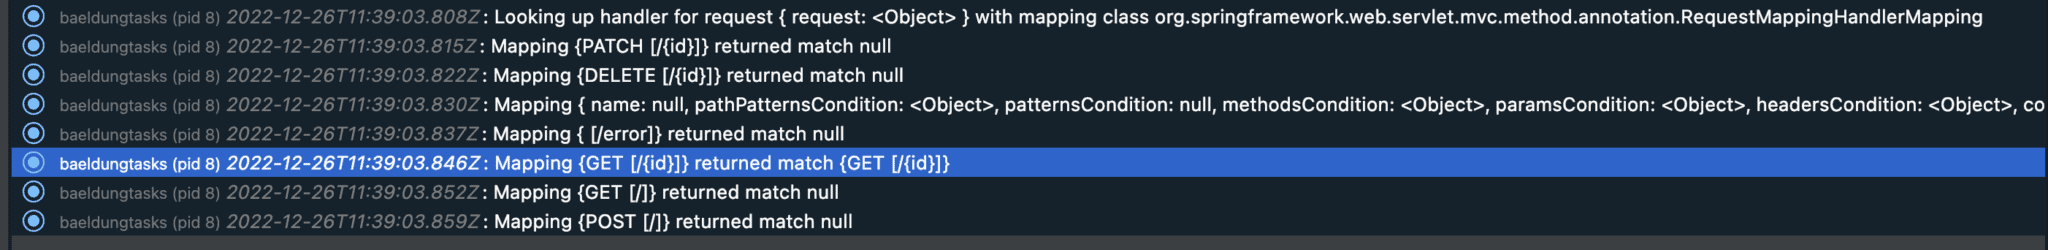
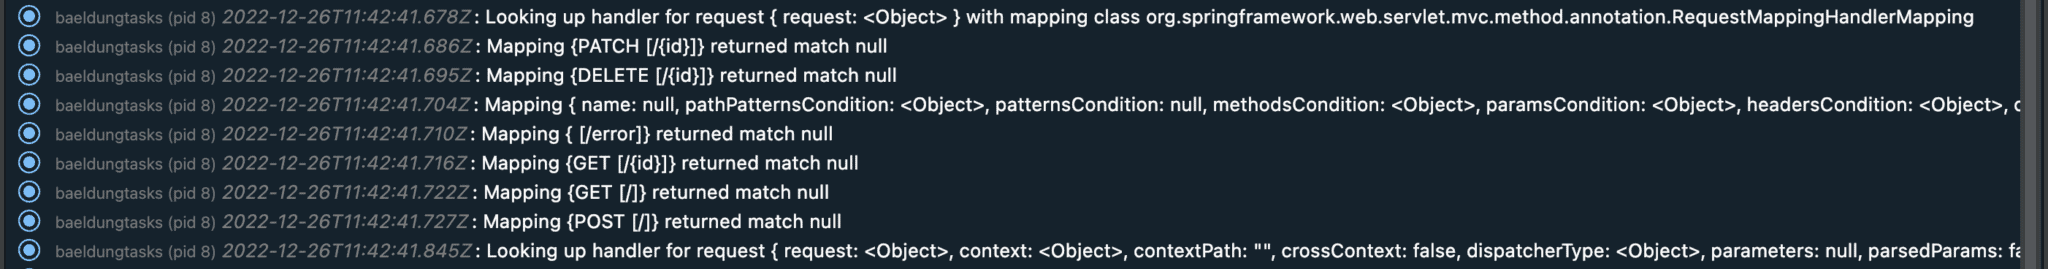
Unsurprisingly most of these didn’t return a match. However, one did. This shows that we have a handler for “GET /{id}” that matches our request – which is precisely what we expected. If none of these returned a match, we’d immediately know that the problem was with the request mapping. For example, if we made an HTTP call with an unsupported HTTP method or an incorrect URI path, then we would see null matches for everything here, and that would tell us what the problem was:
Having gotten this far, if we needed to, we could further diagnose calls to the handler method if that is the problem. But if the problem was that we weren’t getting called at all, then we’ve already understood why that is and can solve the problem.
5. Conclusion
In this article, we’ve looked at a few examples of Spring annotations and how to use Lightrun to diagnose what is happening with them. In particular, we’ve seen how to use some of these tools to understand when things are working and when they aren’t working.
These same techniques will work equally well with any other libraries and frameworks. Why not try them out next time you need to diagnose other libraries you are working with?
If you want to read more about Lightrun, check out their blog.