Java Static Analysis Tools in Eclipse and IntelliJ IDEA
Last updated: February 19, 2026


Mocking is an essential part of unit testing, and the Mockito library makes it easy to write clean and intuitive unit tests for your Java code.
Get started with mocking and improve your application tests using our Mockito guide:
Handling concurrency in an application can be a tricky process with many potential pitfalls. A solid grasp of the fundamentals will go a long way to help minimize these issues.
Get started with understanding multi-threaded applications with our Java Concurrency guide:
Spring 5 added support for reactive programming with the Spring WebFlux module, which has been improved upon ever since. Get started with the Reactor project basics and reactive programming in Spring Boot:
Since its introduction in Java 8, the Stream API has become a staple of Java development. The basic operations like iterating, filtering, mapping sequences of elements are deceptively simple to use.
But these can also be overused and fall into some common pitfalls.
To get a better understanding on how Streams work and how to combine them with other language features, check out our guide to Java Streams:
Explore Spring Boot 3 and Spring 6 in-depth through building a full REST API with the framework:
Yes, Spring Security can be complex, from the more advanced functionality within the Core to the deep OAuth support in the framework.
I built the security material as two full courses - Core and OAuth, to get practical with these more complex scenarios. We explore when and how to use each feature and code through it on the backing project.
You can explore the course here:
Spring Data JPA is a great way to handle the complexity of JPA with the powerful simplicity of Spring Boot.
Get started with Spring Data JPA through the guided reference course:
Refactor Java code safely — and automatically — with OpenRewrite.
Refactoring big codebases by hand is slow, risky, and easy to put off. That’s where OpenRewrite comes in. The open-source framework for large-scale, automated code transformations helps teams modernize safely and consistently.
Each month, the creators and maintainers of OpenRewrite at Moderne run live, hands-on training sessions — one for newcomers and one for experienced users. You’ll see how recipes work, how to apply them across projects, and how to modernize code with confidence.
Join the next session, bring your questions, and learn how to automate the kind of work that usually eats your sprint time.
Yes, we're now running our only Summer Sale. All Courses are 30% off until 20th July, 2026:
Yes, we're now running our only Summer Sale. All Courses are 30% off until 20th July, 2026:
1. Overview
In our introduction to FindBugs, we looked at the functionality of FindBugs as a static analysis tool and how it can be directly integrated into IDEs like Eclipse and IntelliJ Idea.
In this article, we’re going look into few of the alternative static analysis tools for Java – and how these integrate with Eclipse and IntelliJ IDEA.
2. PMD
Let’s start with PMD.
This mature and quite well-established tool analyzes source code for possible bugs, suboptimal codes and other bad practices; it also looks at more advanced metrics such as cyclomatic complexity for the codebase it analyzes.
2.1. Integration With Eclipse
The PMD plugin can be directly installed from Eclipse Marketplace. The plugin can also be manually downloaded here as well. Once installed, we can run the PMD check directly from the IDE itself:
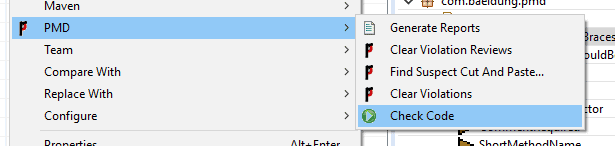
It’s worth noting we can run PMD at the project level or at individual class level.
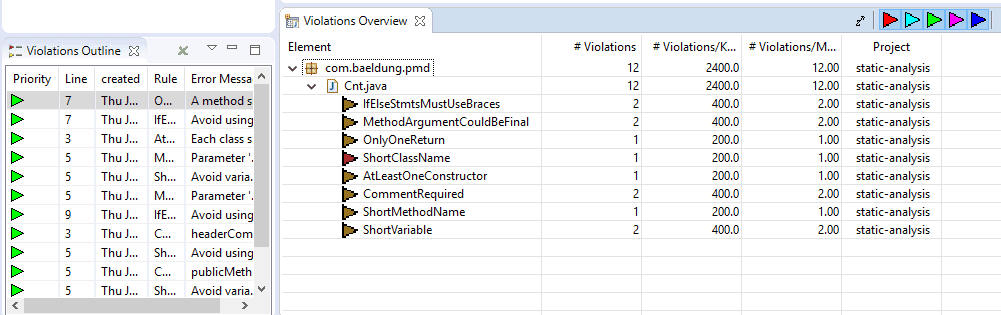
The results are shown below – with different colors for different levels of the finding which ranges from “warning” to “blocker” in the increasing order of severity:
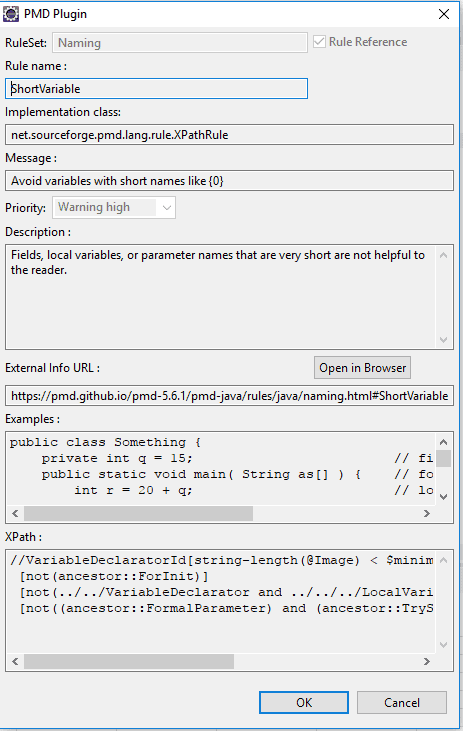
We can dig into the details of each entry by right clicking it and selecting “show details” from the context menu. Eclipse will display a brief description of the issue and possible remediation how to solve it:
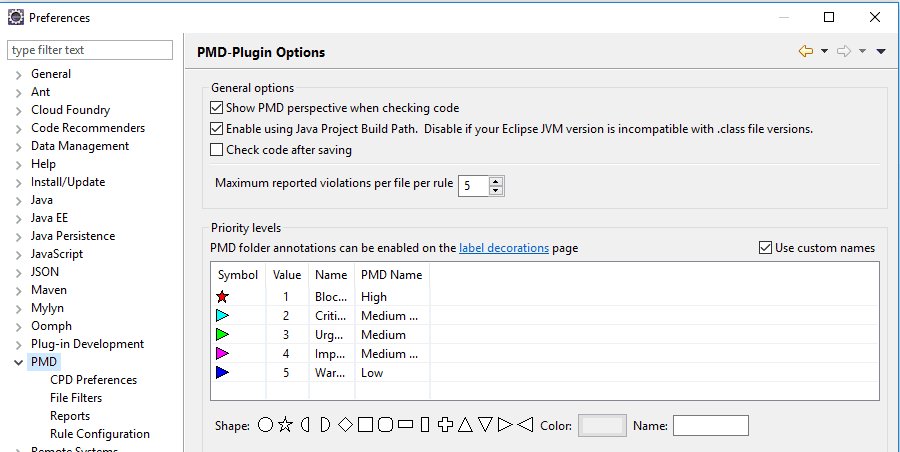
It’s also possible to change the configuration of the PMD scan – we can do that in the menu, under Window -> Preferences -> PMD to launch the configuration page. Here, we can configure scan parameters, rule set, result display settings, etc.
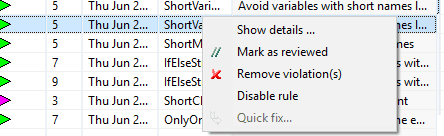
If we need to deactivate some specific rules for the project – we can simply remove them from the scan:
2.2. Integration With IntelliJ
Of course, IntelliJ has a similar PMD plugin – which can be downloaded and installed from the JetBrains plugin store.
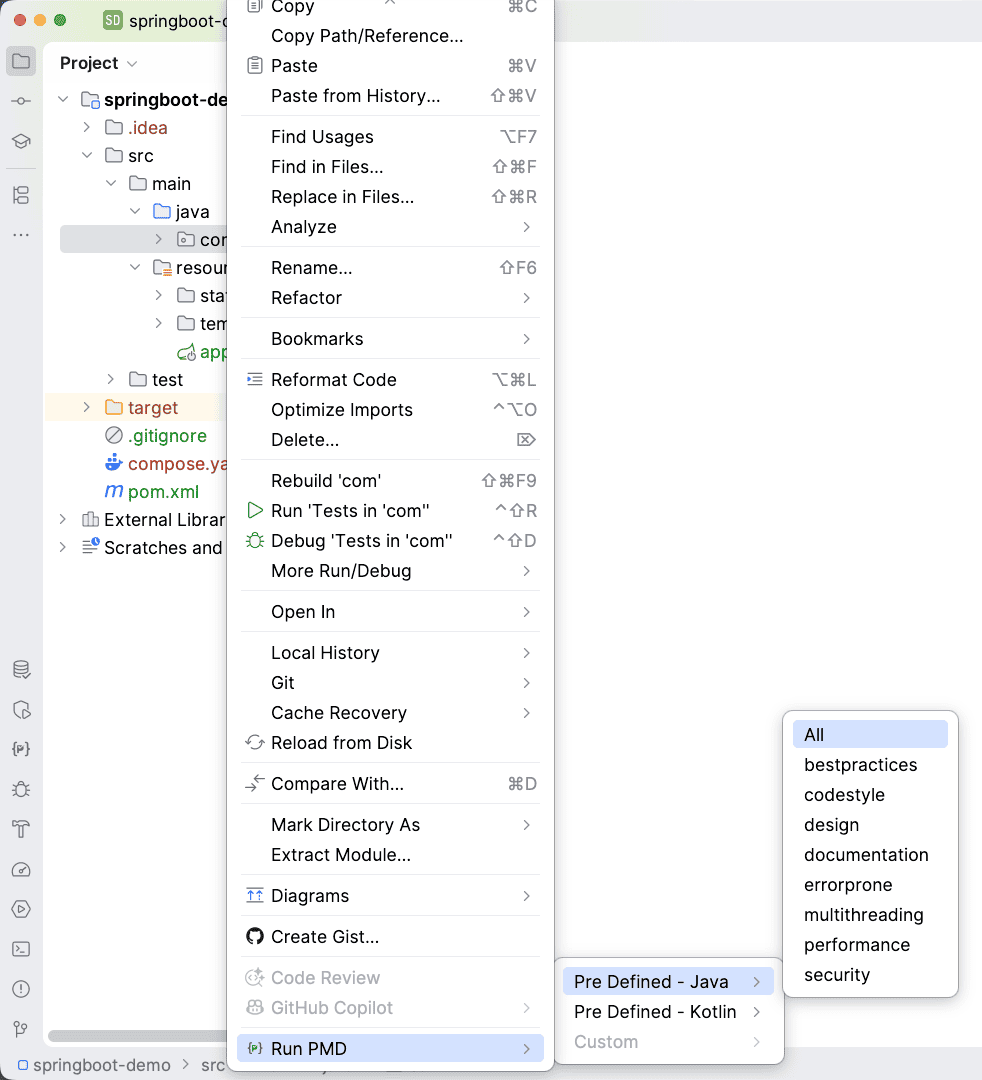
We can similarly run the plugin right in the IDE – by right-clicking the source we need to scan and selecting PMD scan from the context menu:
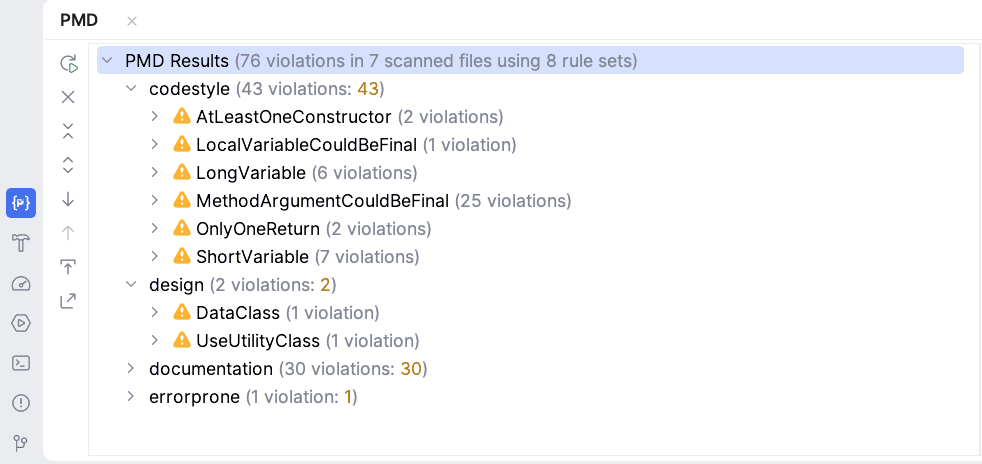
Results are displayed immediately but, unlike in Eclipse, if we try to open the description it will open up a browser with a public web page on finding information:
We can set the behavior of the PMD plugin from the settings page, by going to File -> Settings -> other settings -> PMD to view configuration page. From the settings page, we can configure the rule set by loading a custom rule set with our own testing rules.
3. JaCoCo
Moving on – JaCoCo is a test coverage tool – used to keep track of unit test coverage in the codebase. Simply put, the tool calculates the coverage using a number of strategies e.g.: lines, class, methods, etc.
3.1. Integration With Eclipse
JaCoCo can be directly installed from the marketplace. An install link is also hosted on the official site available here.
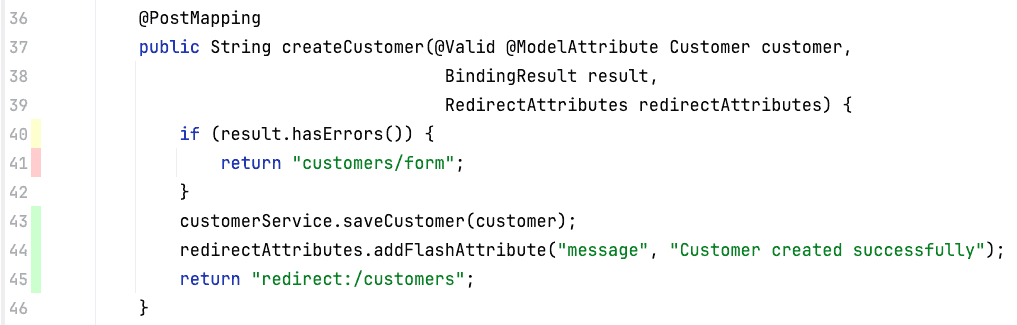
The tool can be executed from project level to individual method level. The Eclipse plugin uses different color schemes to pinpoint what portion of the code is covered by the test cases and what is not covered:
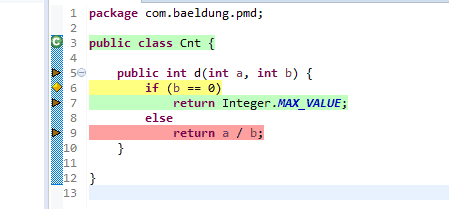
Our method is dividing two provided integer parameters and return the result. If the second parameter is zero it will return a max value for the integer data type.
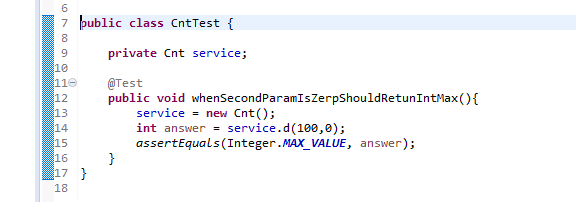
In our test case, we’re only testing out the scenario where the second parameter is zero:
In this case, we can see that line 6 is colored in yellow. Only one branch of the ‘if’ condition is tested and runs in our simple test. Therefore it’s not completely tested and marked in yellow.
Furthermore, line 7 has green color – it means that it is fully tested. Finally, line 9 is highlighted with a red color, which means that this line is not tested at all by our unit tests.
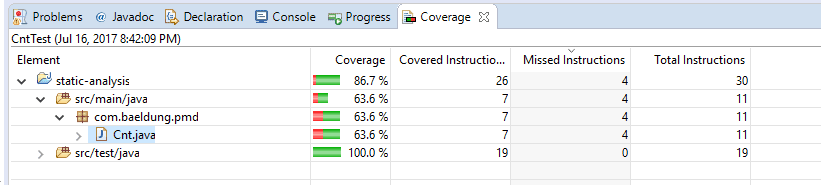
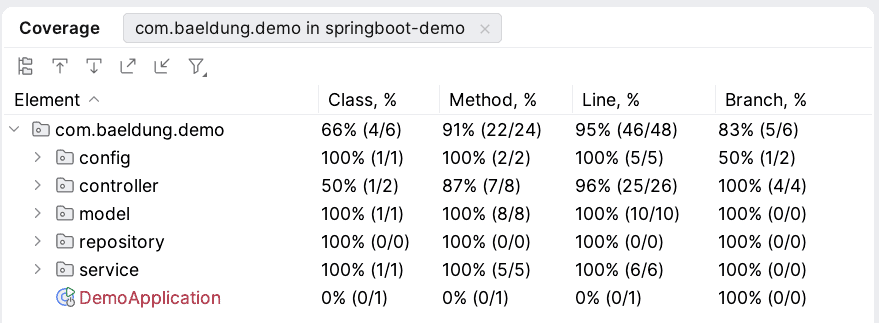
We can see a summary of the test coverage where it displays how much code is covered under unit tests in class level and package levels:
3.2. Integration With IntelliJ IDEA
JaCoCo is bundled by default with the latest IntelliJ IDEA distribution, so there’s no requirement to install the plugin separately.
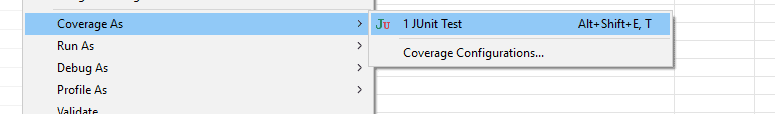
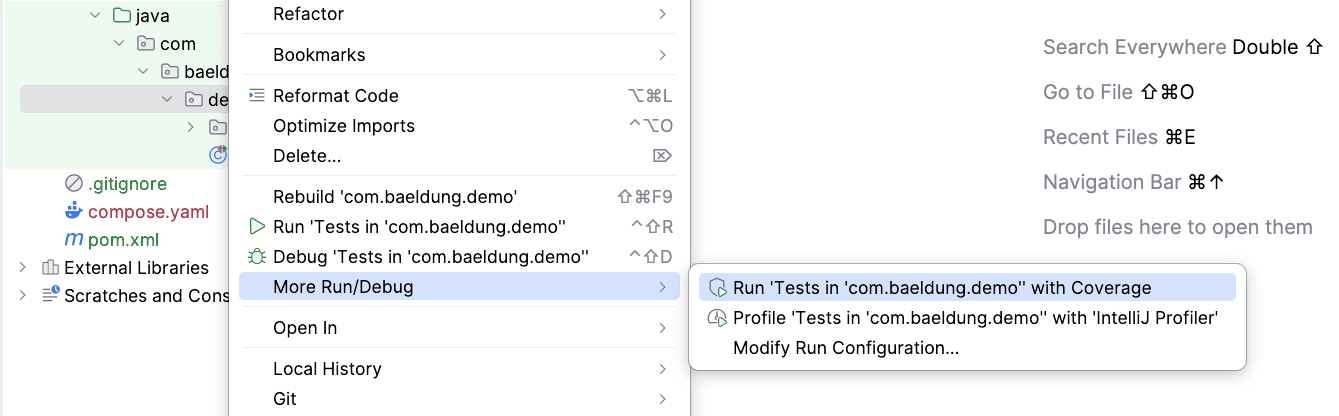
When executing unit tests, we can select what coverage runner we need to use. We can run the test cases either at the project level or at the class level:
Similar to Eclipse, JaCoCo displays results using different color schemes for the coverage.
We can see the summary of the test coverage where it displays how much of the code is covered under unit tests in class level and package levels.
4. Cobertura
Finally, it’s worth mentioning Cobertura – this is similarly used to keep track of unit test coverage in the codebase.
The latest version of Eclipse doesn’t support the Cobertura plugin at the time of writing; the plugin does work with earlier Eclipse versions.
Similarly, IntelliJ IDEA doesn’t have an official plugin which can execute the Cobertura coverage.
5. Conclusion
We looked at integration with Eclipse and IntelliJ IDEA for three widely used static analysis tools. FindBug was covered in a previous introduction to FindBugs.


