

Mocking is an essential part of unit testing, and the Mockito library makes it easy to write clean and intuitive unit tests for your Java code.
Get started with mocking and improve your application tests using our Mockito guide:
Handling concurrency in an application can be a tricky process with many potential pitfalls. A solid grasp of the fundamentals will go a long way to help minimize these issues.
Get started with understanding multi-threaded applications with our Java Concurrency guide:
Spring 5 added support for reactive programming with the Spring WebFlux module, which has been improved upon ever since. Get started with the Reactor project basics and reactive programming in Spring Boot:
Since its introduction in Java 8, the Stream API has become a staple of Java development. The basic operations like iterating, filtering, mapping sequences of elements are deceptively simple to use.
But these can also be overused and fall into some common pitfalls.
To get a better understanding on how Streams work and how to combine them with other language features, check out our guide to Java Streams:
Explore Spring Boot 3 and Spring 6 in-depth through building a full REST API with the framework:
Yes, Spring Security can be complex, from the more advanced functionality within the Core to the deep OAuth support in the framework.
I built the security material as two full courses - Core and OAuth, to get practical with these more complex scenarios. We explore when and how to use each feature and code through it on the backing project.
You can explore the course here:
Spring Data JPA is a great way to handle the complexity of JPA with the powerful simplicity of Spring Boot.
Get started with Spring Data JPA through the guided reference course:
Refactor Java code safely — and automatically — with OpenRewrite.
Refactoring big codebases by hand is slow, risky, and easy to put off. That’s where OpenRewrite comes in. The open-source framework for large-scale, automated code transformations helps teams modernize safely and consistently.
Each month, the creators and maintainers of OpenRewrite at Moderne run live, hands-on training sessions — one for newcomers and one for experienced users. You’ll see how recipes work, how to apply them across projects, and how to modernize code with confidence.
Join the next session, bring your questions, and learn how to automate the kind of work that usually eats your sprint time.
Handling concurrency in an application can be a tricky process with many potential pitfalls. A solid grasp of the fundamentals will go a long way to help minimize these issues.
Get started with understanding multi-threaded applications with our Java Concurrency guide:
1. Introduction
Applications sometimes hang up or run slowly, and identifying the root cause is not always a simple task. A thread dump provides a snapshot of the current state of a running Java process. However, the generated data includes multiple long files. Thus, we’ll need to analyze Java thread dumps and dig for the issue in a big chunk of unrelated information.
In this tutorial, we’ll see how to filter out that data to efficiently diagnose performance issues. Also, we’ll learn to detect bottlenecks or even simple bugs.
2. Threads in the JVM
The JVM uses threads to execute every internal and external operation. As we know, the garbage collection process has its own thread, but also the tasks inside a Java application create their own.
During its lifetime, the thread goes through a variety of states. Each thread has an execution stack tracking the current operation. Besides, the JVM also stores all the previous methods successfully called. Therefore, it is possible to analyze the complete stack to study what happened with the application when things go wrong.
To showcase the topic of this tutorial, we’ll use as an example a simple Sender-Receiver application (NetworkDriver). The Java program sends and receives data packets so we’ll be able to analyze what is happening behind the scenes.
2.1. Capturing the Java Thread Dump
Once the application is running, there are multiple ways to generate a Java thread dump for diagnostics. In this tutorial, we’ll use two utilities included in JDK7+ installations. Firstly, we’ll execute JVM Process Status (jps) command to discover the PID process of our application:
$ jps
80661 NetworkDriver
33751 Launcher
80665 Jps
80664 Launcher
57113 Application
Secondly, we get the PID for our application, in this case, the one next to the NetworkDriver. Then, we’ll capture the thread dump using jstack. Finally, we’ll store the result in a text file:
$ jstack -l 80661 > sender-receiver-thread-dump.txt2.2. Structure of a Sample Dump
Let’s have a look at the generated thread dump. The first line displays the timestamp while the second line informs about the JVM:
2021-01-04 12:59:29
Full thread dump OpenJDK 64-Bit Server VM (15.0.1+9-18 mixed mode, sharing):
Next section shows the Safe Memory Reclamation (SMR) and non-JVM internal threads:
Threads class SMR info:
_java_thread_list=0x00007fd7a7a12cd0, length=13, elements={
0x00007fd7aa808200, 0x00007fd7a7012c00, 0x00007fd7aa809800, 0x00007fd7a6009200,
0x00007fd7ac008200, 0x00007fd7a6830c00, 0x00007fd7ab00a400, 0x00007fd7aa847800,
0x00007fd7a6896200, 0x00007fd7a60c6800, 0x00007fd7a8858c00, 0x00007fd7ad054c00,
0x00007fd7a7018800
}
Then, the dump displays the list of threads. Each thread contains the following information:
- Name: it can provide useful information if developers include a meaningful thread name
- Priority (prior): the priority of the thread
- Java ID (tid): the unique ID given by the JVM
- Native ID (nid): the unique ID given by the OS, useful to extract correlation with CPU or memory processing
- State: the actual state of the thread
- Stack trace: the most important source of information to decipher what is happening with our application
We can see from top to bottom what the different threads are doing at the time of the snapshot. Let’s focus only on the interesting bits of the stack waiting to consume the message:
"Monitor Ctrl-Break" #12 daemon prio=5 os_prio=31 cpu=17.42ms elapsed=11.42s tid=0x00007fd7a6896200 nid=0x6603 runnable  [0x000070000dcc5000]
   java.lang.Thread.State: RUNNABLE
	at sun.nio.ch.SocketDispatcher.read0([email protected]/Native Method)
	at sun.nio.ch.SocketDispatcher.read([email protected]/SocketDispatcher.java:47)
	at sun.nio.ch.NioSocketImpl.tryRead([email protected]/NioSocketImpl.java:261)
	at sun.nio.ch.NioSocketImpl.implRead([email protected]/NioSocketImpl.java:312)
	at sun.nio.ch.NioSocketImpl.read([email protected]/NioSocketImpl.java:350)
	at sun.nio.ch.NioSocketImpl$1.read([email protected]/NioSocketImpl.java:803)
	at java.net.Socket$SocketInputStream.read([email protected]/Socket.java:981)
	at sun.nio.cs.StreamDecoder.readBytes([email protected]/StreamDecoder.java:297)
	at sun.nio.cs.StreamDecoder.implRead([email protected]/StreamDecoder.java:339)
	at sun.nio.cs.StreamDecoder.read([email protected]/StreamDecoder.java:188)
	- locked <0x000000070fc949b0> (a java.io.InputStreamReader)
	at java.io.InputStreamReader.read([email protected]/InputStreamReader.java:181)
	at java.io.BufferedReader.fill([email protected]/BufferedReader.java:161)
	at java.io.BufferedReader.readLine([email protected]/BufferedReader.java:326)
	- locked <0x000000070fc949b0> (a java.io.InputStreamReader)
	at java.io.BufferedReader.readLine([email protected]/BufferedReader.java:392)
	at com.intellij.rt.execution.application.AppMainV2$1.run(AppMainV2.java:61)

   Locked ownable synchronizers:
	- <0x000000070fc8a668> (a java.util.concurrent.locks.ReentrantLock$NonfairSync)
At a first glance, we see that the main stack trace is executing java.io.BufferedReader.readLine which is the expected behavior. If we look further down we’ll see all the JVM methods executed by our application behind the scenes. Therefore, we are able to identify the root of the problem by looking at the source code or other internal JVM processing.
At the end of the dump, we’ll notice there are several additional threads performing background operations such as Garbage Collection (GC) or object termination:
"VM Thread" os_prio=31 cpu=1.85ms elapsed=11.50s tid=0x00007fd7a7a0c170 nid=0x3603 runnable
"GC Thread#0" os_prio=31 cpu=0.21ms elapsed=11.51s tid=0x00007fd7a5d12990 nid=0x4d03 runnable
"G1 Main Marker" os_prio=31 cpu=0.06ms elapsed=11.51s tid=0x00007fd7a7a04a90 nid=0x3103 runnable
"G1 Conc#0" os_prio=31 cpu=0.05ms elapsed=11.51s tid=0x00007fd7a5c10040 nid=0x3303 runnable
"G1 Refine#0" os_prio=31 cpu=0.06ms elapsed=11.50s tid=0x00007fd7a5c2d080 nid=0x3403 runnable
"G1 Young RemSet Sampling" os_prio=31 cpu=1.23ms elapsed=11.50s tid=0x00007fd7a9804220 nid=0x4603 runnable
"VM Periodic Task Thread" os_prio=31 cpu=5.82ms elapsed=11.42s tid=0x00007fd7a5c35fd0 nid=0x9903 waiting on condition
Finally, the dump displays the Java Native Interface (JNI) references. We should pay special attention to this when memory leak occurs because they aren’t automatically garbage collected:
JNI global refs: 15, weak refs: 0Thread dumps are fairly similar in their structure, but we’ll want to get rid of the non-important data generated for our use case. On the other hand, we’ll need to keep and group the important information from the tons of logs produced by the stack trace. Let’s see how to do it!
3. Recommendations to Analyze a Thread Dump
In order to understand what is happening with our application, we’ll need to efficiently analyze the generated snapshot. We’ll have a lot of information with precise data of all the threads at the time of the dump. However, we’ll need to curate the log files, making some filtering and grouping to extract useful hints from the stack trace. Once we prepared the dump we’ll be able to analyze the problem using different tools. Let’s see how to decipher the content of a sample dump.
3.1. Synchronization Issues
One interesting tip to filter out the stack trace is the state of the thread. We’ll mainly focus on RUNNABLE or BLOCKED threads and eventually TIMED_WAITING ones. Those states will point us in the direction of a conflict between two or more threads:
- In a deadlock situation in which several threads running hold a synchronized block on a shared object
- In thread contention, when a thread is blocked waiting for others to finish. For example, the dump generated in the previous section
3.2. Execution Issues
As a rule of thumb, for abnormally high CPU usage we only need to look at RUNNABLE threads. We’ll use thread dumps together with other commands to acquire extra information. One of these commands is top -H -p PID, which displays what threads are consuming the OS resources within that particular process. We also need to look at the internal JVM threads such as GC just in case. On the other hand, when the processing performance is abnormally low, we’ll look at BLOCKED threads.
In those cases, a single dump will most surely not be enough to understand what is happening. We’ll need a number of dumps at close intervals in order to compare the stacks of the same threads at different times. On the one hand, one snapshot is not always enough to find out the root of the problem. On the other hand, we need to avoid noise between snapshots (too much information).
To understand the threads’ evolution over time, a recommended best practice is to take at least 3 dumps, one at every 10 seconds. Another useful tip is to split the dumps into small chunks to avoid crashes loading the files.
3.3. Recommendations
In order to efficiently decipher the root of the problem, we’ll need to organize the huge amount of information in the stack trace. Therefore, we’ll take into consideration the following recommendations:
- In execution issues, capture several snapshots with an interval of 10 seconds will help to focus on the actual problems. It is also recommended to split the files if needed to avoid loading crashes
- Use naming when creating new threads to better identify your source code
- Depending on the issue, ignore internal JVM processing (for instance GC)
- Focus on long-running or blocked threads when issuing abnormal CPU or memory usage
- Correlate the thread’s stack with CPU processing by using top -H -p PID
- And most importantly, use Analyzer tools
Analyzing the Java thread dumps manually could be a tedious activity. For simple applications, it is possible to identify the threads generating the problem. On the other hand, for complex situations, we’ll need tools to ease this task. We’ll showcase how to use the tools in the next sections, using the dump generated for the sample thread contention.
4. Online Tools
There are several online tools available. When using this kind of software we need to take into account security issues. Remember that we could be sharing the logs with third-party entities.
4.1. FastThread
FastThread is probably the best online tool to analyze thread dumps for production environments. It provides a very nice graphical user interface. It also includes multiple functionalities such as CPU usage by threads, stack length, and most used and complex methods:
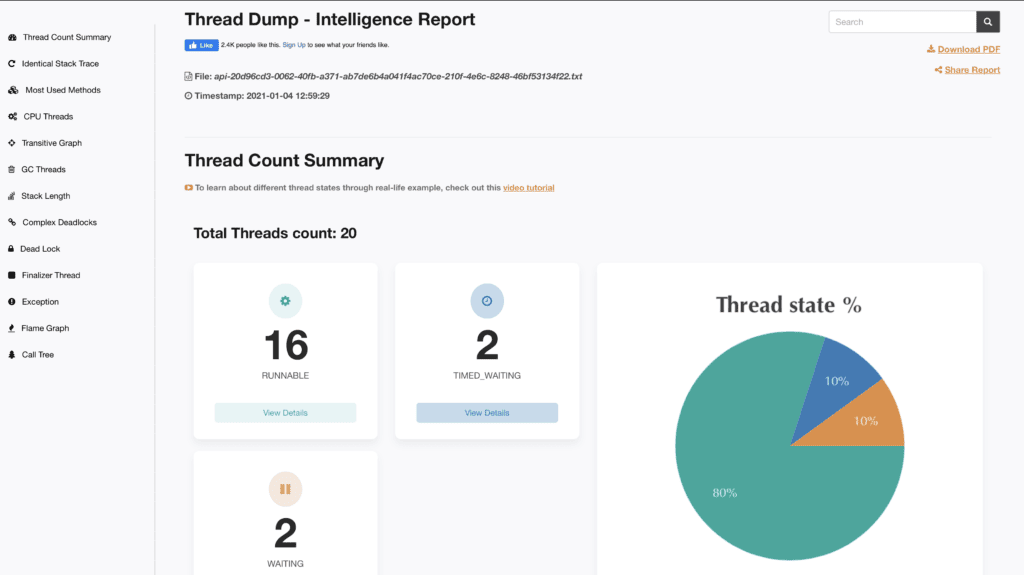
FastThread incorporates a REST API feature to automate the analysis of the thread dumps. With a simple cURL command, it’s possible to instantly send the results. The main drawback is security because it stores the stack trace in the cloud.
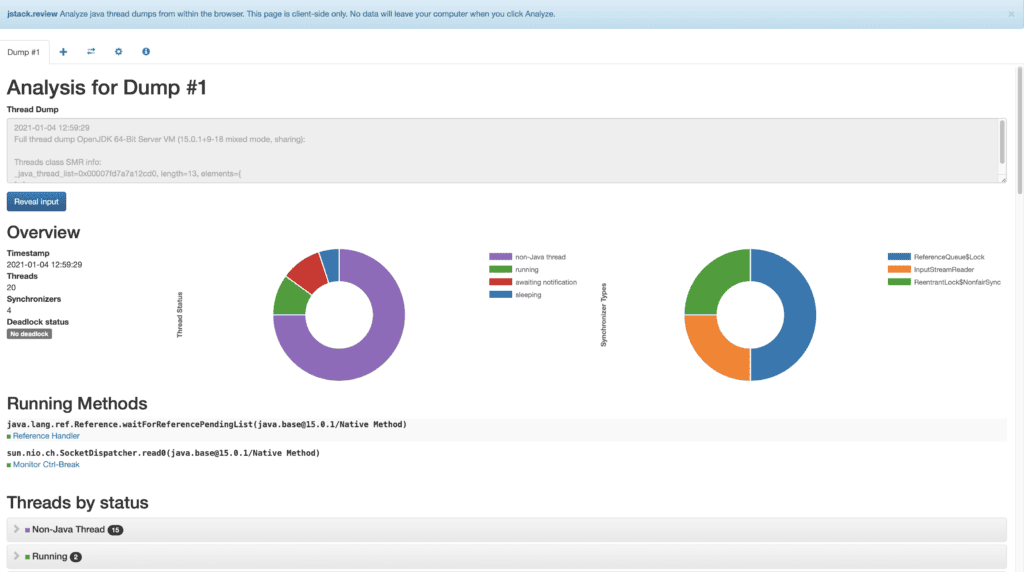
4.2. JStack Review
JStack Review is an online tool that analyzes the dumps within the browser. It is client-side only, thus no data is stored outside your computer. From the security perspective, this is a major advantage to use it. It provides a graphical overview of all the threads, displaying the running methods but also grouping them by status. JStack Review separates threads producing stack from the rest which is very important to ignore, for instance, internal processes. Finally, it also includes the synchronizers and the ignored lines:
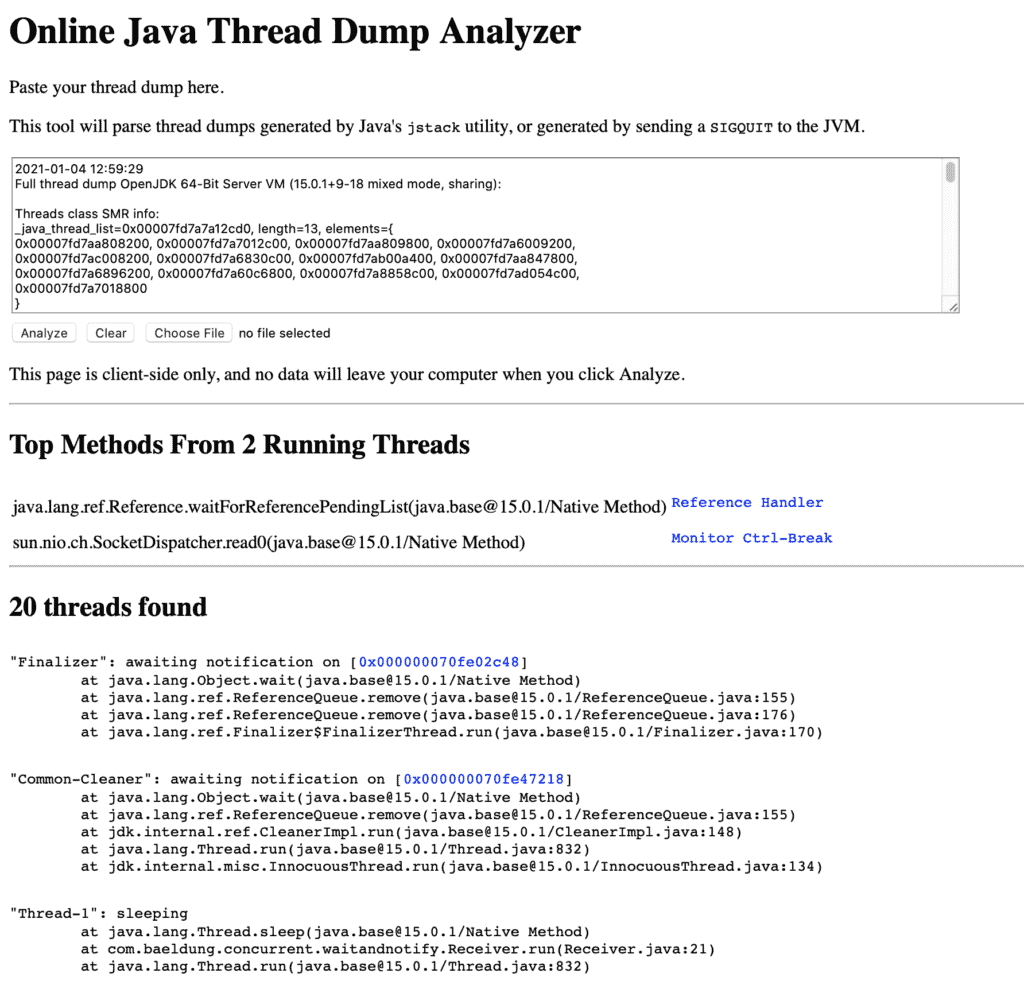
4.3. Spotify Online Java Thread Dump Analyzer
Spotify Online Java Thread Dump Analyser is an online open-source tool written in JavaScript. It shows the results in plain text separating the threads with and without the stack. It also displays the top methods from the running threads:
5. Standalone Applications
There are also several standalone applications that we can use locally.
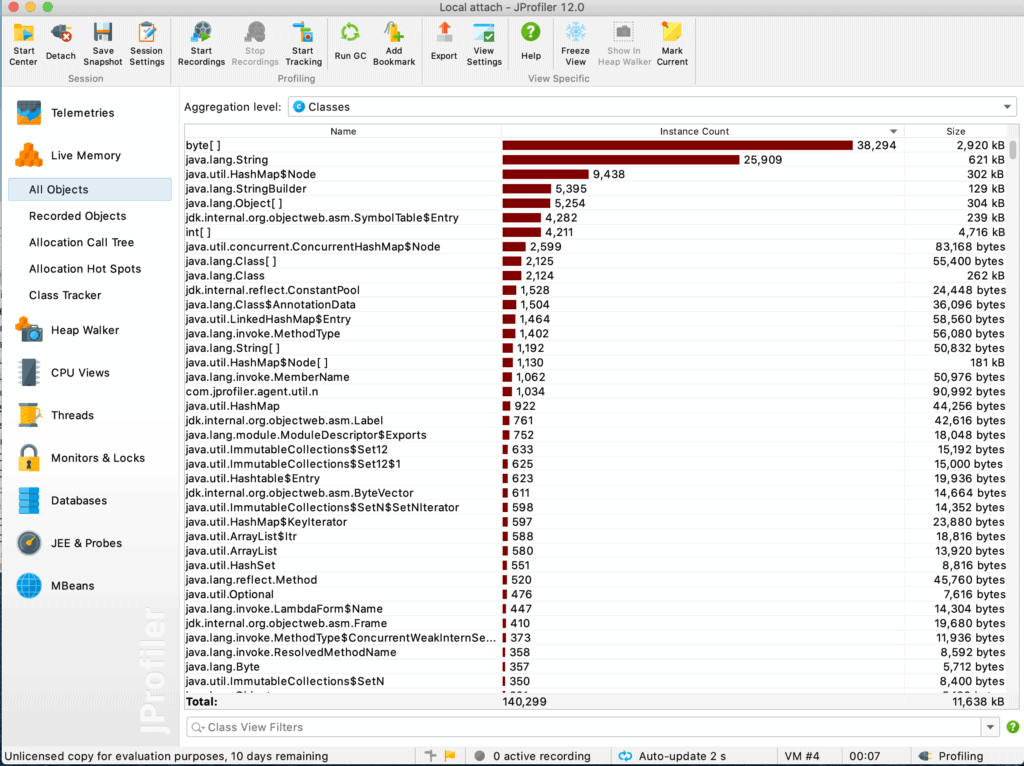
5.1. JProfiler
JProfiler is the most powerful tool in the market, and well-known among the Java developer community. It is possible to test the functionality with a 10-day trial license. JProfiler allows the creation of profiles and attaches running applications to them. It includes multiple functionalities to identify problems on the spot, such as CPU and memory usage and database analysis. It supports also integration with IDEs:
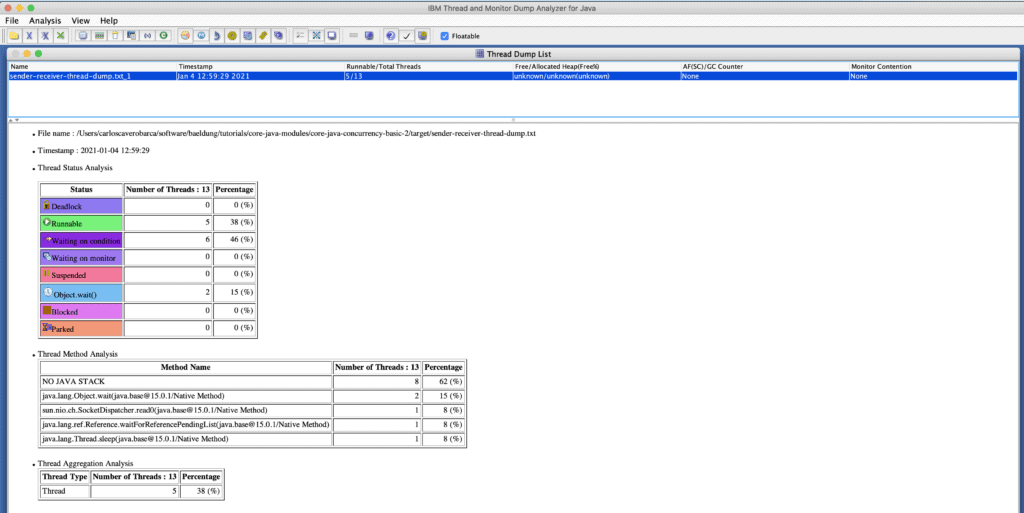
5.2. IBM Thread Monitor and Dump Analyzer for Java (TMDA)
IBM TMDA can be used to identify thread contention, deadlocks, and bottlenecks. It is freely distributed and maintained but it does not offer any guarantee or support from IBM:
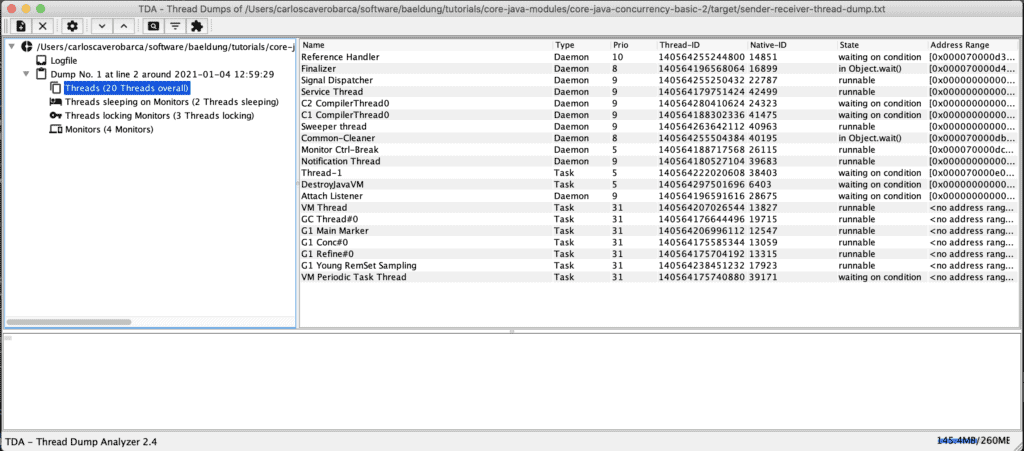
5.3. Irockel Thread Dump Analyser (TDA)
Irockel TDA is a standalone open-source tool licensed with LGPL v2.1. The last version (v3.0) was released in January 2026 so it is well maintained. It displays the thread dump as a tree providing also some statistics to ease the navigation:
Finally, IDEs support basic analysis of thread dumps so it is possible to debug the application during development time. It also includes modern features like MCP integration, so we can analyze thread dumps with AI Agents.
5. Conclusion
In this article, we demonstrated how Java thread dump analysis can help us pinpoint synchronization or execution issues.
Most importantly, we reviewed how to analyze them properly including recommendations to organize the enormous amount of information embedded in the snapshot.


