IoT Data Pipeline with MQTT, NiFi, and InfluxDB
Last updated: January 24, 2026


Mocking is an essential part of unit testing, and the Mockito library makes it easy to write clean and intuitive unit tests for your Java code.
Get started with mocking and improve your application tests using our Mockito guide:
Handling concurrency in an application can be a tricky process with many potential pitfalls. A solid grasp of the fundamentals will go a long way to help minimize these issues.
Get started with understanding multi-threaded applications with our Java Concurrency guide:
Spring 5 added support for reactive programming with the Spring WebFlux module, which has been improved upon ever since. Get started with the Reactor project basics and reactive programming in Spring Boot:
Since its introduction in Java 8, the Stream API has become a staple of Java development. The basic operations like iterating, filtering, mapping sequences of elements are deceptively simple to use.
But these can also be overused and fall into some common pitfalls.
To get a better understanding on how Streams work and how to combine them with other language features, check out our guide to Java Streams:
Explore Spring Boot 3 and Spring 6 in-depth through building a full REST API with the framework:
Yes, Spring Security can be complex, from the more advanced functionality within the Core to the deep OAuth support in the framework.
I built the security material as two full courses - Core and OAuth, to get practical with these more complex scenarios. We explore when and how to use each feature and code through it on the backing project.
You can explore the course here:
Spring Data JPA is a great way to handle the complexity of JPA with the powerful simplicity of Spring Boot.
Get started with Spring Data JPA through the guided reference course:
Refactor Java code safely — and automatically — with OpenRewrite.
Refactoring big codebases by hand is slow, risky, and easy to put off. That’s where OpenRewrite comes in. The open-source framework for large-scale, automated code transformations helps teams modernize safely and consistently.
Each month, the creators and maintainers of OpenRewrite at Moderne run live, hands-on training sessions — one for newcomers and one for experienced users. You’ll see how recipes work, how to apply them across projects, and how to modernize code with confidence.
Join the next session, bring your questions, and learn how to automate the kind of work that usually eats your sprint time.
Yes, we're now running our only Summer Sale. All Courses are 30% off until 20th July, 2026:
Yes, we're now running our only Summer Sale. All Courses are 30% off until 20th July, 2026:
1. Introduction
In this tutorial, we’ll learn what’s required when creating data pipelines for IoT applications.
Along the way, we’ll understand the characteristics of IoT architecture and see how to leverage different tools like MQTT broker, NiFi, and InfluxDB to build a highly scalable data pipeline for IoT applications.
2. IoT and Its Architecture
First, let’s go through some of the basic concepts and understand an IoT application’s general architecture.
2.1. What Is IoT?
The Internet of Things (IoT) broadly refers to the network of physical objects, known as “things”. For example, things can include anything from common household objects, like a light bulb, to sophisticated industrial equipment. Through this network, we can connect a wide array of sensors and actuators to the internet for exchanging data:
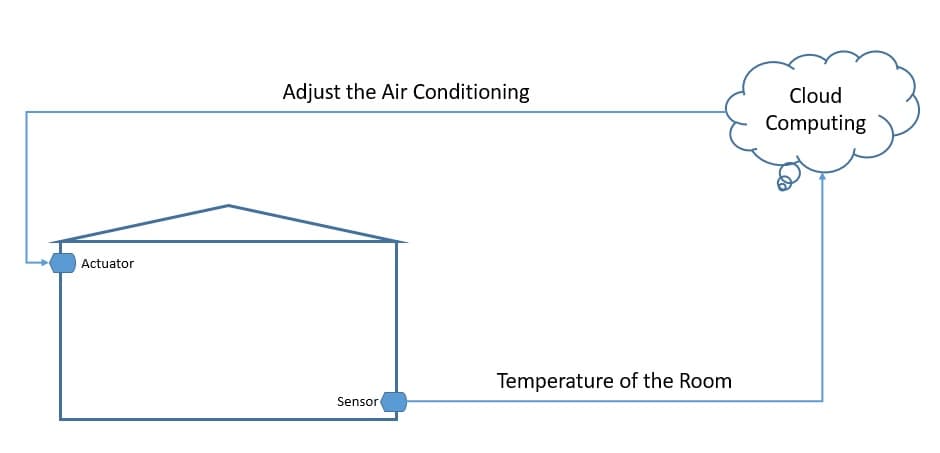
Now, we can deploy things in very different environments — for example, the environment can be our home or something quite different, like a moving freight truck. However, we can’t really make any assumptions about the quality of the power supply and network that will be available to these things. Consequently, this gives rise to unique requirements for IoT applications.
2.2. Introduction to IoT Architecture
A typical IoT architecture usually structures itself into four different layers. Let’s understand how the data actually flow through these layers:
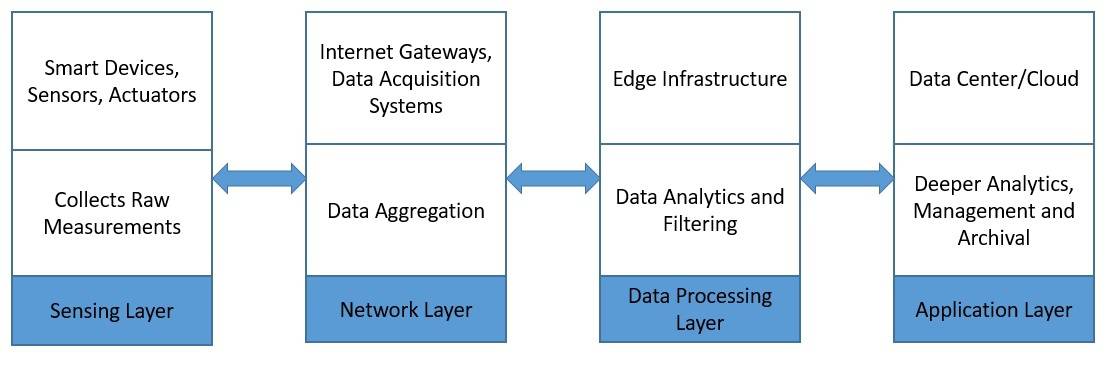
First, the sensing layer is comprised primarily of the sensors that gather measurements from the environment. Then, the network layer helps aggregate the raw data and send it over the Internet for processing. Further, the data processing layer filters the raw data and generates early analytics. Finally, the application layer employs powerful data processing capabilities to perform deeper analysis and management of data.
3. Introduction to MQTT, NiFi, and InfluxDB
Now, let’s examine a few products that we widely use in the IoT setup today. These all provide some unique features that make them suitable for the data requirements of an IoT application.
3.1. MQTT
Message Queuing Telemetry Transport (MQTT) is a lightweight publish-subscribe network protocol. It’s now an OASIS and ISO standard. IBM originally developed it for transporting messages between devices. MQTT is suitable for constrained environments where memory, network bandwidth, and power supply are scarce.
MQTT follows a client-server model, where different components can act as clients and connect to a server over TCP. We know this server as an MQTT broker. Clients can publish messages to an address known as the topic. They can also subscribe to a topic and receive all messages published to it.
In a typical IoT setup, sensors can publish measurements like temperature to an MQTT broker, and upstream data processing systems can subscribe to these topics to receive the data:
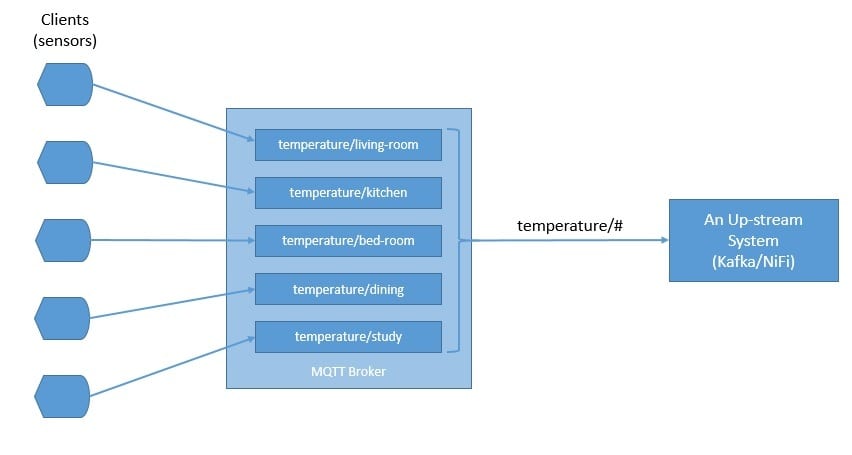
As we can see, the topics in MQTT are hierarchical. A system can easily subscribe to a whole hierarchy of topics by using a wildcard.
MQTT supports three levels of Quality of Service (QoS). These are “delivered at most once”, “delivered at least once”, and “delivered exactly once”. QoS defines the level of agreement between the client and the server. Each client can choose the level of service that suits its environment.
The client can also request the broker to persist a message while publishing. In some setups, an MQTT broker may require a username and password authentication from clients in order to connect. Further, for privacy, the TCP connection may be encrypted with SSL/TLS.
There are several MQTT broker implementations and client libraries available for use — for example, HiveMQ, Mosquitto, and Paho MQTT. We’ll be using Mosquitto in our example in this tutorial. Mosquitto is part of the Eclipse Foundation, and we can easily install it on a board like Raspberry Pi or Arduino.
3.2. Apache NiFi
Apache NiFi was originally developed as NiagaraFiles by NSA. It facilitates automation and management of data flow between systems and is based on the flow-based-programming model that defines applications as a network of black-box processes.
Let’s go through some of the basic concepts first. An object moving through the system in NiFi is called a FlowFile. FlowFile Processors actually perform useful work like routing, transformation, and mediation of FlowFiles. The FlowFile Processors are connected with Connections.
A Process Group is a mechanism to group components together to organize a dataflow in NiFi. A Process Group can receive data via Input Ports and send data via Output Ports. A Remote Process Group (RPG) provides a mechanism to send data to or receive data from a remote instance of NiFi.
Now, with that knowledge, let’s go through the NiFi architecture:
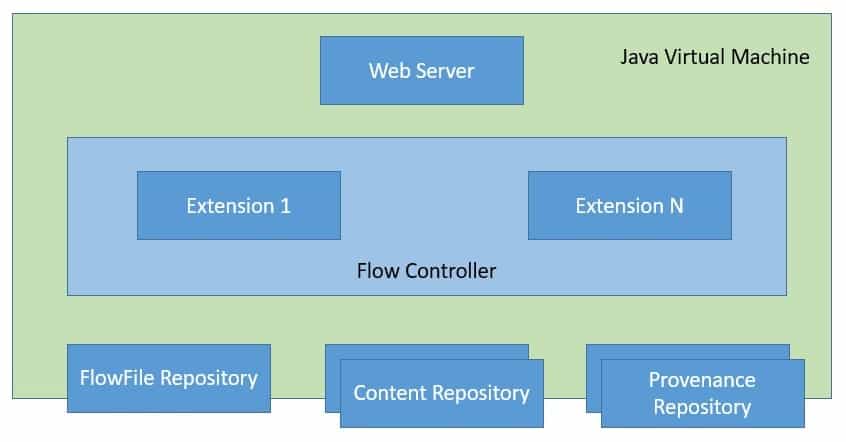
NiFi is a Java-based program that runs multiple components within a JVM. Web-server is the component that hosts the command and control API. Flow Controller is the core component of NiFi that manages the schedule of when extensions receive resources to execute. Extensions allow NiFi to be extensible and support integration with different systems.
NiFi keeps track of the state of a FlowFile in the FlowFile Repository. The actual content bytes of the FlowFile reside in the Content Repository. Finally, the provenance event data related to the FlowFile resides in the Provenance Repository.
As data collection at source may require a smaller footprint and low resource consumption, NiFi has a subproject known as MiNiFi. MiNiFi provides a complementary data collection approach for NiFi and easily integrates with NiFi through Site-to-Site (S2S) protocol:
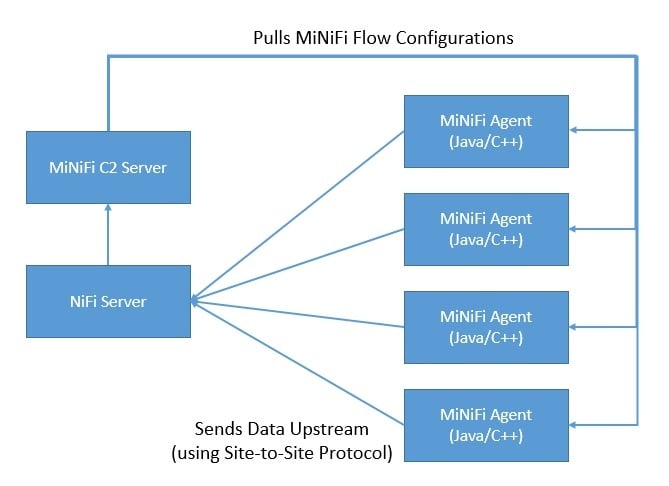
Moreover, it enables central management of agents through MiNiFi Command and Control (C2) protocol. Further, it helps in establishing the data provenance by generating a full chain of custody information.
3.3. InfluxDB
InfluxDB is a time-series database written in Go and developed by InfluxData. It’s designed for fast and high-availability storage and retrieval of time-series data. This is especially suitable for handling application metrics, IoT sensor data, and real-time analytics.
To begin with, data in InfluxDB is organized by time-series. A time-series can contain zero or many points. A point represents a single data record that has four components —measurement, tag-set, field-set, and timestamp:
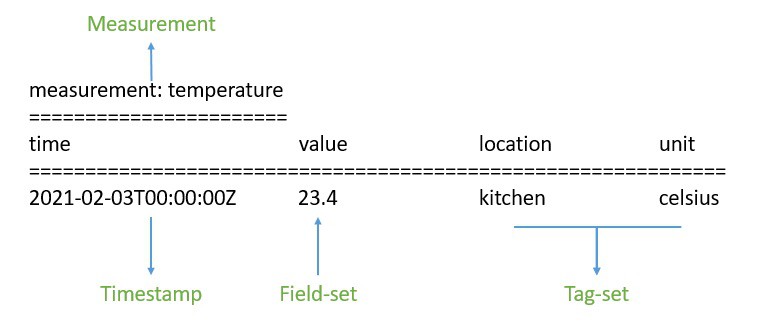
First, the timestamp shows the UTC date and time associated with a particular point. Field-set is comprised of one or more field-key and field-value pairs. They capture the actual data with labels for a point. Similarly, tag-set is comprised of tag-key and tag-value pairs, but they are optional. They basically act as metadata for a point and can be indexed for faster query responses.
The measurement acts as a container for tag-set, field-set, and timestamp. Additionally, every point in InfluxDB can have a retention policy associated with it. The retention policy describes how long InfluxDB will keep the data and how many copies it’ll create through replication.
Finally, a database acts as a logical container for users, retention policies, continuous queries, and time-series data. We can understand the database in InfluxDB to be loosely similar to a traditional relational database.
Moreover, InfluxDB is part of the InfluxData platform that offers several other products to efficiently handle time-series data. InfluxData now offers it as InfluxDB OSS 2.0, an open-source platform, and InfluxDB Cloud, a commercial offering:
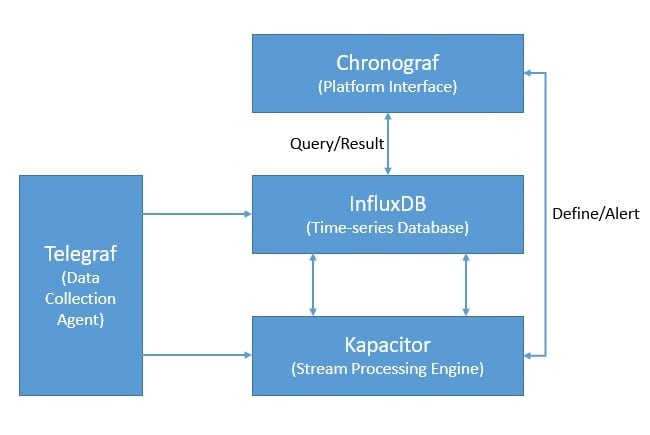
Apart from InfluxDB, the platform includes Chronograf, which offers a complete interface for the InfluxData platform. Further, it includes Telegraf, an agent for collecting and reporting metrics and events. Finally, there is Kapacitor, a real-time streaming data processing engine.
4. Hands-on with IoT Data Pipeline
Now, we’ve covered enough ground to use these products together to create a data-pipeline for our IoT application. We’ll assume that we are gathering air-quality-related measurements from multiple observation stations across multiple cities for this tutorial. For example, the measurements include ground-level ozone, carbon monoxide, sulfur dioxide, nitrogen dioxide, and aerosols.
4.1. Setting Up the Infrastructure
First, we’ll assume that every weather station in a city is equipped with all sensing equipment. Further, these sensors are wired to a board like Raspberry Pi to collect the analog data and digitize it. The board is connected to the wireless to send the raw measurements upstream:
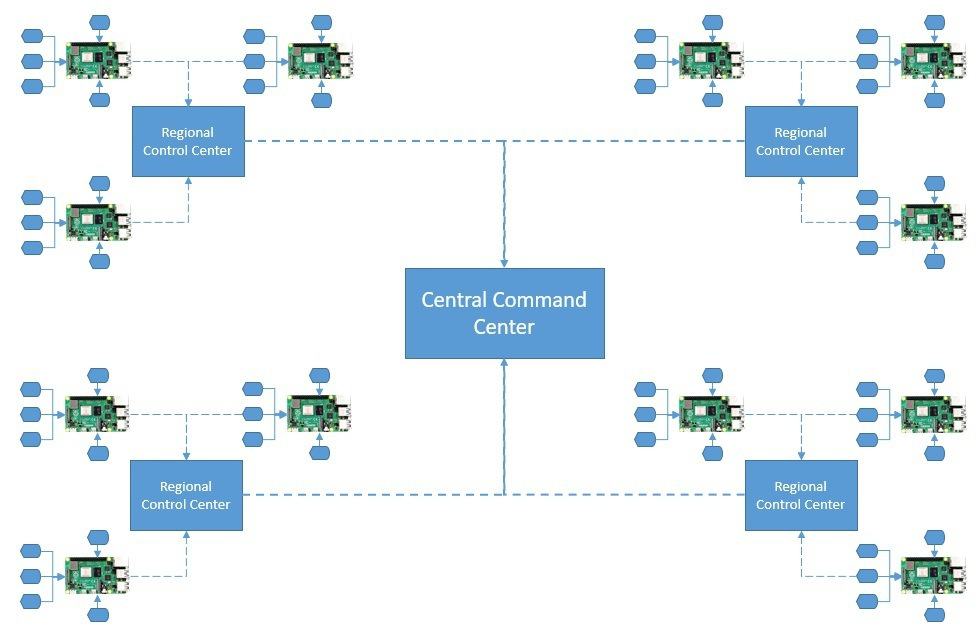
A regional control station collects data from all weather stations in a city. We can aggregate and feed this data into some local analytics engine for quicker insights. The filtered data from all regional control centers are sent to a central command center, which is mostly hosted in the cloud.
4.2. Creating the IoT Architecture
Now, we’re ready to design the IoT architecture for our simple air-quality application. We’ll be using MQTT broker, MiNiFi Java agents, NiFi, and InfluxDB here:

As we can see, we’re using Mosquitto MQTT broker and MiNiFi Java agent on the weather station sites. At the regional control centers, we’re using the NiFi server to aggregate and route data. Finally, we’re using InfluxDB to store measurements at the command-center level.
4.3. Performing Installations
Installing Mosquitto MQTT broker and MiNiFi Java agent on a board like Raspberry Pi is quite easy. However, for this tutorial, we’ll install them on our local machine.
The official download page of Eclipse Mosquito provides binaries for several platforms. Once installed, starting Mosquitto is quite simple from the installation directory:
net start mosquittoFurther, NiFi binaries are also available for download from its official site. We have to extract the downloaded archive in a suitable directory. Since MiNiFi will connect to NiFi using the site-to-site protocol, we have to specify the site-to-site input socket port in <NIFI_HOME>/conf/nifi.properties:
# Site to Site properties
nifi.remote.input.host=
nifi.remote.input.secure=false
nifi.remote.input.socket.port=1026
nifi.remote.input.http.enabled=true
nifi.remote.input.http.transaction.ttl=30 sec
Then, we can start NiFi:
<NIFI_HOME>/bin/run-nifi.batSimilarly, Java or C++ MiNiFi agent and toolkit binaries are available for download from the official site. Again, we have to extract the archives in a suitable directory.
MiNiFi, by default, comes with a very minimal set of processors. Since we’ll be consuming data from MQTT, we have to copy the MQTT processor into the <MINIFI_HOME>/lib directory. These are bundled as NiFi Archive (NAR) files and can be located in the <NIFI_HOME>/lib directory:
COPY <NIFI_HOME>/lib/nifi-mqtt-nar-x.x.x.nar <MINIFI_HOME>/lib/nifi-mqtt-nar-x.x.x.narWe can then start the MiNiFi agent:
<MINIFI_HOME>/bin/run-minifi.batLastly, we can download the open-source version of InfluxDB from its official site. As before, we can extract the archive and start InfluxDB with a simple command:
<INFLUXDB_HOME>/influxd.exeWe should keep all other configurations, including the port, as the default for this tutorial. This concludes the installation and setup on our local machine.
4.4. Defining the NiFi Dataflow
Now, we’re ready to define our dataflow. NiFi provides an easy-to-use interface to create and monitor dataflows. This is accessible on the URL http://localhost:8080/nifi.
To begin with, we’ll define the main dataflow that will be running on the NiFi server:

Here, as we can see, we’ve defined an input port that will receive data from MiNiFi agents. It further sends data through a connection to the PutInfluxDB processor responsible for storing the data in the InfluxDB. In this processor’s configuration, we’ve defined the connection URL of InfluxDB and the database name where we want to send the data.
4.5. Defining the MiNiFi Dataflow
Next, we’ll define the dataflow that will run on the MiNiFi agents. We’ll use the same user interface of NiFi and export the dataflow as a template to configure this in the MiNiFi agent. Let’s define the dataflow for the MiNiFi agent:
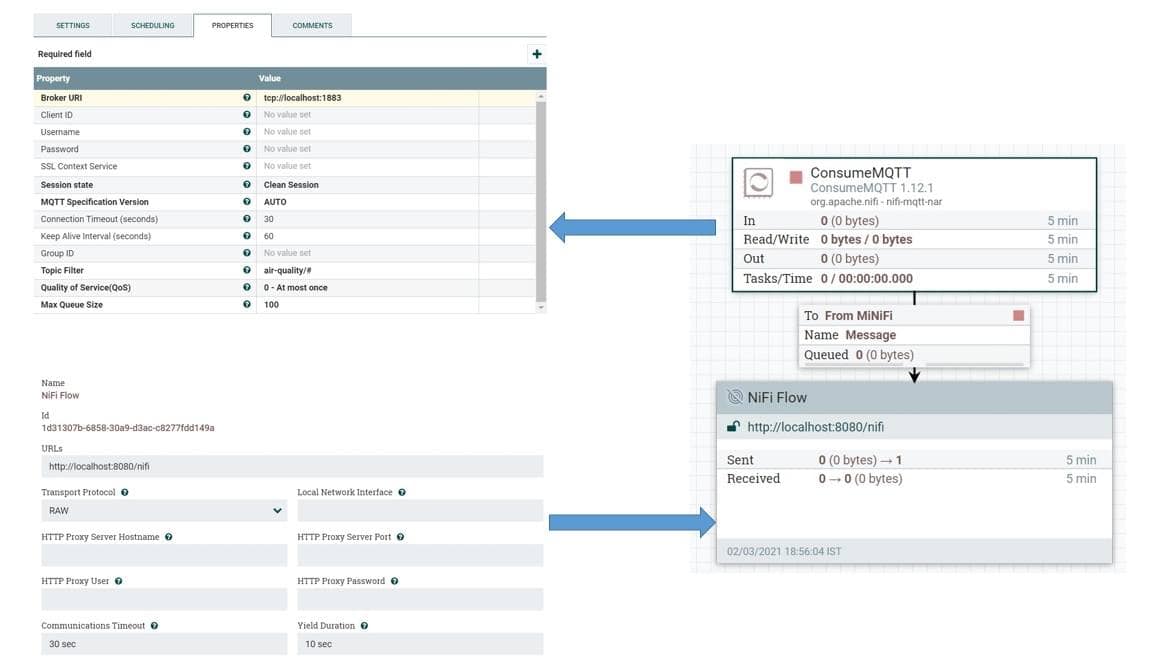
Here, we’ve defined the ConsumeMQTT processor that is responsible for getting data from the MQTT broker. We’ve provided the broker URI, as well as the topic filter, in the properties. We’re pulling data from all topics defined under the hierarchy air-quality.
We’ve also defined a remote process group and connected it to the ConcumeMQTT processor. The remote process group is responsible for pushing data to NiFi through the site-to-site protocol.
We can save this dataflow as a template and download it as an XML file. Let’s name this file config.xml. Now, we can use the converter toolkit to convert this template from XML into YAML, which the MiNiFi agent uses:
<MINIFI_TOOLKIT_HOME>/bin/config.bat transform config.xml config.ymlThis will give us the config.yml file where we’ll have to manually add the host and port of the NiFi server:
  Input Ports:
  - id: 19442f9d-aead-3569-b94c-1ad397e8291c
    name: From MiNiFi
    comment: ''
    max concurrent tasks: 1
    use compression: false
    Properties: # Deviates from spec and will later be removed when this is autonegotiated
      Port: 1026
      Host Name: localhost
We can now place this file in the directory <MINIFI_HOME>/conf, replacing the file that may already be present there. We’ll have to restart the MiNiFi agent after this.
Here, we’re doing a lot of manual work to create the dataflow and configure it in the MiNiFi agent. This is impractical for real-life scenarios where hundreds of agents may be present in remote locations. However, as we’ve seen earlier, we can automate this by using the MiNiFi C2 server. But this is not in the scope of this tutorial.
4.6. Testing the Data Pipeline
Finally, we are ready to test our data pipeline! Since we do not have the liberty to use real sensors, we’ll create a small simulation. We’ll generate sensor data using a small Java program:
class Sensor implements Callable<Boolean> {
    String city;
    String station;
    String pollutant;
    String topic;
    Sensor(String city, String station, String pollutant, String topic) {
        this.city = city;
        this.station = station;
        this.pollutant = pollutant;
        this.topic = topic;
    }

    @Override
    public Boolean call() throws Exception {
        MqttClient publisher = new MqttClient(
          "tcp://localhost:1883", UUID.randomUUID().toString());
        MqttConnectOptions options = new MqttConnectOptions();
        options.setAutomaticReconnect(true);
        options.setCleanSession(true);
        options.setConnectionTimeout(10);
        publisher.connect(options);
        IntStream.range(0, 10).forEach(i -> {
            String payload = String.format("%1$s,city=%2$s,station=%3$s value=%4$04.2f",
              pollutant,
              city,
              station,
              ThreadLocalRandom.current().nextDouble(0, 100));
            MqttMessage message = new MqttMessage(payload.getBytes());
            message.setQos(0);
            message.setRetained(true);
            try {
                publisher.publish(topic, message);
                Thread.sleep(1000);
            } catch (MqttException | InterruptedException e) {
                e.printStackTrace();
            }
        });
        return true;
    }
}
Here, we’re using the Eclipse Paho Java client to generate messages to an MQTT broker. We can add as many sensors as we want to create our simulation:
ExecutorService executorService = Executors.newCachedThreadPool();
List<Callable<Boolean>> sensors = Arrays.asList(
  new Simulation.Sensor("london", "central", "ozone", "air-quality/ozone"),
  new Simulation.Sensor("london", "central", "co", "air-quality/co"),
  new Simulation.Sensor("london", "central", "so2", "air-quality/so2"),
  new Simulation.Sensor("london", "central", "no2", "air-quality/no2"),
  new Simulation.Sensor("london", "central", "aerosols", "air-quality/aerosols"));
List<Future<Boolean>> futures = executorService.invokeAll(sensors);
If everything works as it should, we’ll be able to query our data in the InfluxDB database:

For example, we can see all the points belonging to the measurement “ozone” in the database “airquality”.
5. Conclusion
To sum up, we covered a basic IoT use-case in this tutorial. We also understood how to use tools like MQTT, NiFi, and InfluxDB to build a scalable data pipeline. Of course, this does not cover the entire breadth of an IoT application, and the possibilities of extending the pipeline for data analytics are endless.
Further, the example we’ve picked in this tutorial is for demonstration purposes only. The actual infrastructure and architecture for an IoT application can be quite varied and complex. Moreover, we can complete the feedback cycle by pushing the actionable insights backward as commands.


