Hibernate Query Plan Cache
Last updated: February 4, 2026

Mocking is an essential part of unit testing, and the Mockito library makes it easy to write clean and intuitive unit tests for your Java code.
Get started with mocking and improve your application tests using our Mockito guide:
Handling concurrency in an application can be a tricky process with many potential pitfalls. A solid grasp of the fundamentals will go a long way to help minimize these issues.
Get started with understanding multi-threaded applications with our Java Concurrency guide:
Spring 5 added support for reactive programming with the Spring WebFlux module, which has been improved upon ever since. Get started with the Reactor project basics and reactive programming in Spring Boot:
Since its introduction in Java 8, the Stream API has become a staple of Java development. The basic operations like iterating, filtering, mapping sequences of elements are deceptively simple to use.
But these can also be overused and fall into some common pitfalls.
To get a better understanding on how Streams work and how to combine them with other language features, check out our guide to Java Streams:
Explore Spring Boot 3 and Spring 6 in-depth through building a full REST API with the framework:
Yes, Spring Security can be complex, from the more advanced functionality within the Core to the deep OAuth support in the framework.
I built the security material as two full courses - Core and OAuth, to get practical with these more complex scenarios. We explore when and how to use each feature and code through it on the backing project.
You can explore the course here:
Spring Data JPA is a great way to handle the complexity of JPA with the powerful simplicity of Spring Boot.
Get started with Spring Data JPA through the guided reference course:
Refactor Java code safely — and automatically — with OpenRewrite.
Refactoring big codebases by hand is slow, risky, and easy to put off. That’s where OpenRewrite comes in. The open-source framework for large-scale, automated code transformations helps teams modernize safely and consistently.
Each month, the creators and maintainers of OpenRewrite at Moderne run live, hands-on training sessions — one for newcomers and one for experienced users. You’ll see how recipes work, how to apply them across projects, and how to modernize code with confidence.
Join the next session, bring your questions, and learn how to automate the kind of work that usually eats your sprint time.
1. Introduction
In this quick tutorial, we’ll explore the query plan cache provided by Hibernate and its impact on performance.
2. Query Plan Cache
Every JPQL query or Criteria query is parsed into an Abstract Syntax Tree (AST) prior to execution so that Hibernate can generate the SQL statement. Since query compilation takes time, Hibernate provides a QueryPlanCache for better performance.
For native queries, Hibernate extracts information about the named parameters and query return type and stores it in the ParameterMetadata.
For every execution, Hibernate first checks the plan cache, and only if there’s no plan available, it generates a new plan and stores the execution plan in the cache for future reference.
3. Configuration
The query plan cache configuration is controlled by the following properties:
- hibernate.query.plan_cache_max_size – controls the maximum number of entries in the plan cache (defaults to 2048)
- hibernate.query.plan_parameter_metadata_max_size – manages the number of ParameterMetadata instances in the cache (defaults to 128)
So, if our application executes more queries than the size of query plan cache, Hibernate will have to spend extra time in compiling queries. Hence, overall query execution time will increase.
4. Setting Up the Test Case
As the saying goes in the industry, when it comes to performance, never trust the claims. So, let’s test how the query compilation time varies as we change the cache settings.
4.1. Entity Classes Involved in Test
Let’s start by having a look at the entities we’ll use in our example, DeptEmployee and Department:
@Entity
public class DeptEmployee {
    @Id
    @GeneratedValue(strategy = GenerationType.SEQUENCE)
    private long id;

    private String employeeNumber;

    private String title;

    private String name;

    @ManyToOne
    private Department department;

   // standard getters and setters
}
@Entity
public class Department {
@Id
@GeneratedValue(strategy = GenerationType.SEQUENCE)
private long id;
private String name;
@OneToMany(mappedBy="department")
private List<DeptEmployee> employees;
// standard getters and setters
}
4.2. Hibernate Queries Involved in Test
We’re interested in measuring the overall query compilation time only, so, we can pick any combination of valid HQL queries for our test.
For the purpose of this article, we’ll be using the following three queries:
- findEmployeesByDepartmentName
session.createQuery("SELECT e FROM DeptEmployee e " +
  "JOIN e.department WHERE e.department.name = :deptName")
  .setMaxResults(30)
.setHint(QueryHints.HINT_FETCH_SIZE, 30);- findEmployeesByDesignation
session.createQuery("SELECT e FROM DeptEmployee e " +
  "WHERE e.title = :designation")
.setHint(QueryHints.SPEC_HINT_TIMEOUT, 1000);- findDepartmentOfAnEmployee
session.createQuery("SELECT e.department FROM DeptEmployee e " +
  "JOIN e.department WHERE e.employeeNumber = :empId");
5. Measuring the Performance Impact
5.1. Benchmark Code Setup
We’ll vary the cache size from one to three – after that, all three of our queries will already be in the cache. Therefore, there’s no point in increasing it further:
@State(Scope.Thread)
public static class QueryPlanCacheBenchMarkState {
    @Param({"1", "2", "3"})
    public int planCacheSize;

    public Session session;

    @Setup
    public void stateSetup() throws IOException {
       session = initSession(planCacheSize);
    }

    private Session initSession(int planCacheSize) throws IOException {
        Properties properties = HibernateUtil.getProperties();
        properties.put("hibernate.query.plan_cache_max_size", planCacheSize);
        properties.put("hibernate.query.plan_parameter_metadata_max_size", planCacheSize);
        SessionFactory sessionFactory = HibernateUtil.getSessionFactoryByProperties(properties);
        return sessionFactory.openSession();
    }
    //teardown...
}
5.2. Code Under Test
Next, let’s have a look at the benchmark code used to measure the average time taken by Hibernate while compiling the queries:
@Benchmark
@BenchmarkMode(Mode.AverageTime)
@OutputTimeUnit(TimeUnit.MICROSECONDS)
@Fork(1)
@Warmup(iterations = 2)
@Measurement(iterations = 5)
public void givenQueryPlanCacheSize_thenCompileQueries(
  QueryPlanCacheBenchMarkState state, Blackhole blackhole) {

    Query query1 = findEmployeesByDepartmentNameQuery(state.session);
    Query query2 = findEmployeesByDesignationQuery(state.session);
    Query query3 = findDepartmentOfAnEmployeeQuery(state.session);

    blackhole.consume(query1);
    blackhole.consume(query2);
    blackhole.consume(query3);
}
Note that we’ve used JMH to write our benchmark.
5.3. Benchmark Results
Now, let’s visualize the compilation time vs cache size graph that we prepared by running the above benchmark:
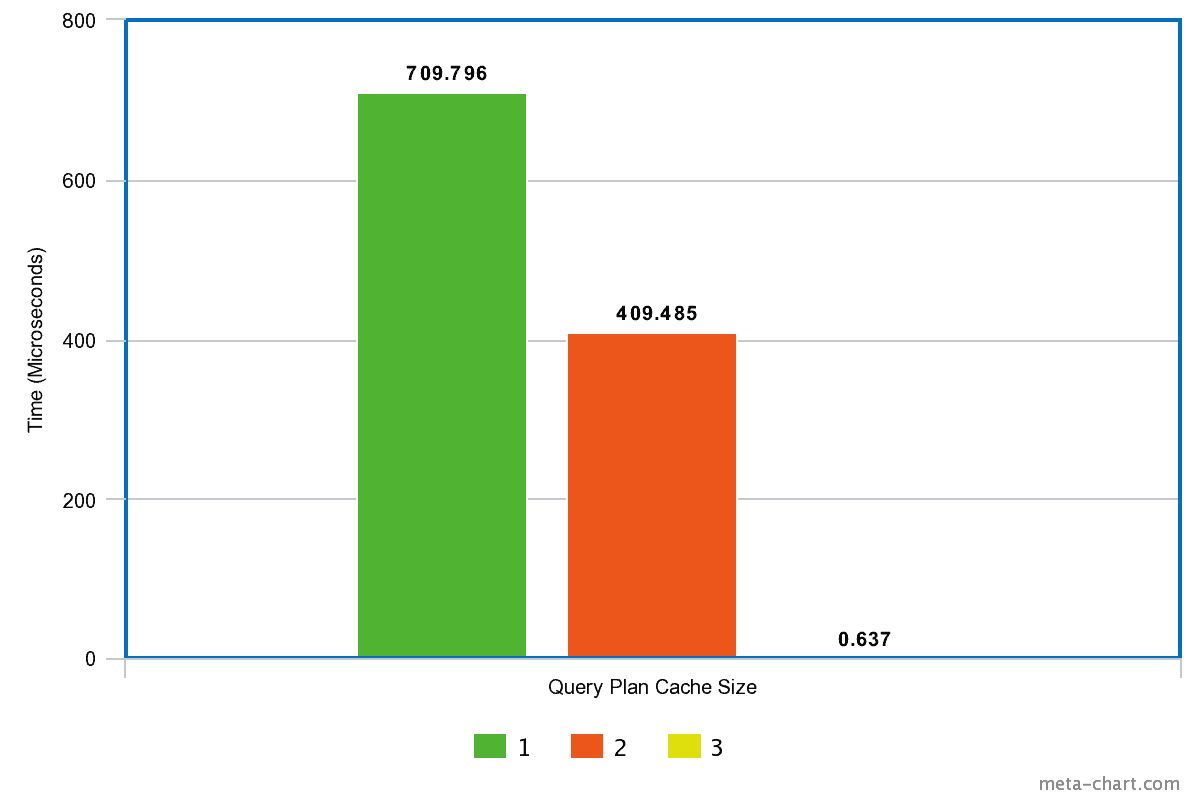
As we can clearly see in the graph, increasing the number of queries that Hibernate is allowed to cache consequently reduces the compilation time.
For a cache size of one, the average compilation time is the highest at 709 microseconds, then it decreases to 409 microseconds for a cache size of two, and all the way to 0.637 microseconds for a cache size of three.
6. Using Hibernate Statistics
To monitor the effectiveness of the query plan cache, Hibernate exposes the following methods via the Statistics interface:
- getQueryPlanCacheHitCount
- getQueryPlanCacheMissCount
So, if the hit count is high and the miss count is low, then most of the queries are served from the cache itself, instead of being compiled over and over again.
7. Conclusion
In this article, we learned what the query plan cache is in Hibernate and how it can contribute to the overall performance of the application. Overall, we should try to keep the query plan cache size in accordance to the number of queries running in the application.


