

Mocking is an essential part of unit testing, and the Mockito library makes it easy to write clean and intuitive unit tests for your Java code.
Get started with mocking and improve your application tests using our Mockito guide:
Handling concurrency in an application can be a tricky process with many potential pitfalls. A solid grasp of the fundamentals will go a long way to help minimize these issues.
Get started with understanding multi-threaded applications with our Java Concurrency guide:
Spring 5 added support for reactive programming with the Spring WebFlux module, which has been improved upon ever since. Get started with the Reactor project basics and reactive programming in Spring Boot:
Since its introduction in Java 8, the Stream API has become a staple of Java development. The basic operations like iterating, filtering, mapping sequences of elements are deceptively simple to use.
But these can also be overused and fall into some common pitfalls.
To get a better understanding on how Streams work and how to combine them with other language features, check out our guide to Java Streams:
Explore Spring Boot 3 and Spring 6 in-depth through building a full REST API with the framework:
Yes, Spring Security can be complex, from the more advanced functionality within the Core to the deep OAuth support in the framework.
I built the security material as two full courses - Core and OAuth, to get practical with these more complex scenarios. We explore when and how to use each feature and code through it on the backing project.
You can explore the course here:
Spring Data JPA is a great way to handle the complexity of JPA with the powerful simplicity of Spring Boot.
Get started with Spring Data JPA through the guided reference course:
Refactor Java code safely — and automatically — with OpenRewrite.
Refactoring big codebases by hand is slow, risky, and easy to put off. That’s where OpenRewrite comes in. The open-source framework for large-scale, automated code transformations helps teams modernize safely and consistently.
Each month, the creators and maintainers of OpenRewrite at Moderne run live, hands-on training sessions — one for newcomers and one for experienced users. You’ll see how recipes work, how to apply them across projects, and how to modernize code with confidence.
Join the next session, bring your questions, and learn how to automate the kind of work that usually eats your sprint time.
Yes, we're now running our only Summer Sale. All Courses are 30% off until 20th July, 2026:
Yes, we're now running our only Summer Sale. All Courses are 30% off until 20th July, 2026:
1. Overview
In this quick guide, we’ll see how to debug Java programs using the Eclipse IDE.
2. Basic Concepts
Eclipse has great support for debugging an application. It visualizes step-by-step execution and helps us uncover bugs.
To demonstrate the debugging features in Eclipse, we’ll use a sample program PerfectSquareCounter. This program counts the total perfect squares and even perfect squares under a given number:
public class PerfectSquareCounter {

    static int evenPerfectSquareNumbers = 0;

    public static void main(String[] args) {
        int i = 100;
        System.out.println("Total Perfect Squares: " + calculateCount(i));
        System.out.println("Even Perfect Squares : " + evenPerfectSquareNumbers);
    }

    public static int calculateCount(int i) {
        int perfectSquaresCount = 0;
        for (int number = 1; number <= i; number++) {
            if (isPerfectSquare(number)) {
                perfectSquaresCount++;
                if (number % 2 == 0) {
                    evenPerfectSquareNumbers++;
                }
            }
        }
        return perfectSquaresCount;
    }

    private static boolean isPerfectSquare(int number) {
        double sqrt = Math.sqrt(number);
        return sqrt - Math.floor(sqrt) == 0;
    }
}
2.1. Debug Mode
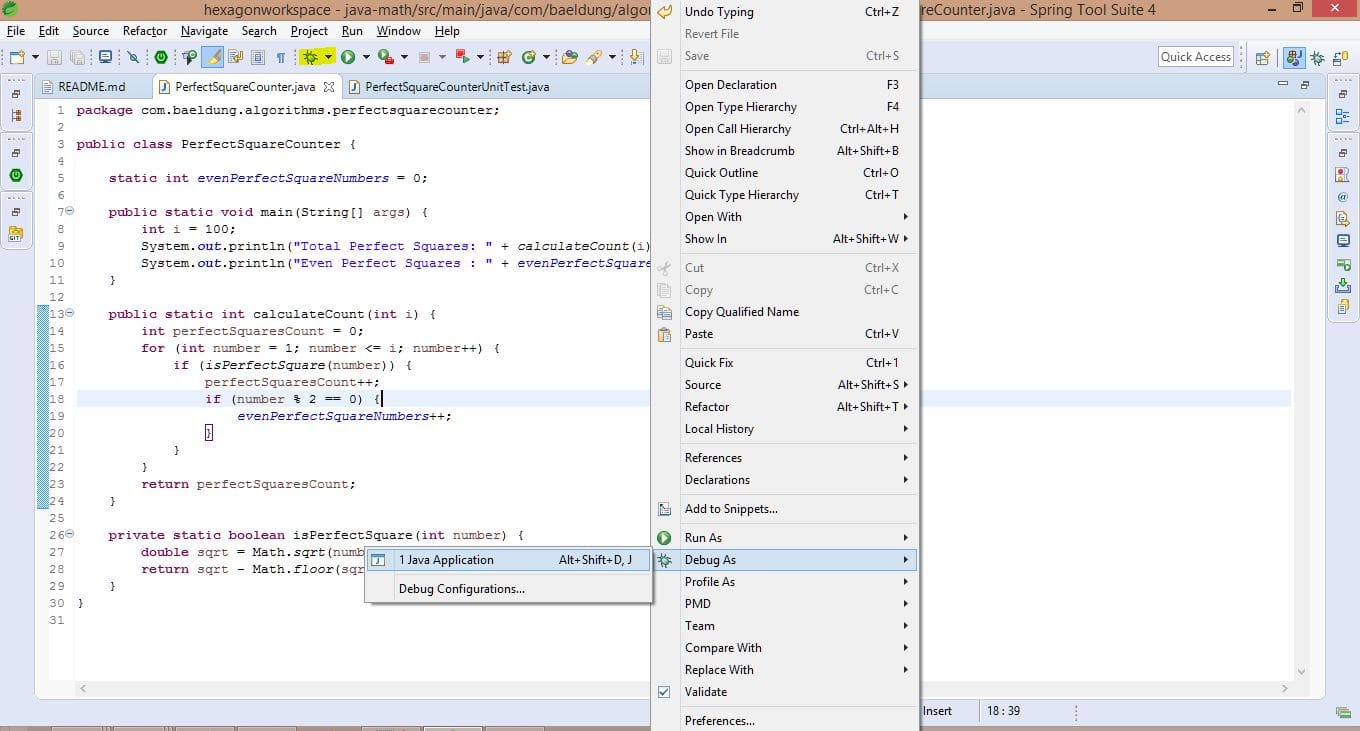
First, we need to start the Java program within Eclipse in debug mode. This can be achieved in two ways:
- Right-click on the editor and select Debug As -> Java Application (shown in below screenshot)
- Debug the program from the toolbar (highlighted in below screenshot)
2.2. Breakpoints
We need to define the points at which the program execution should pause for investigation. These are called breakpoints and are applicable for methods. They can also be defined anytime before or during execution.
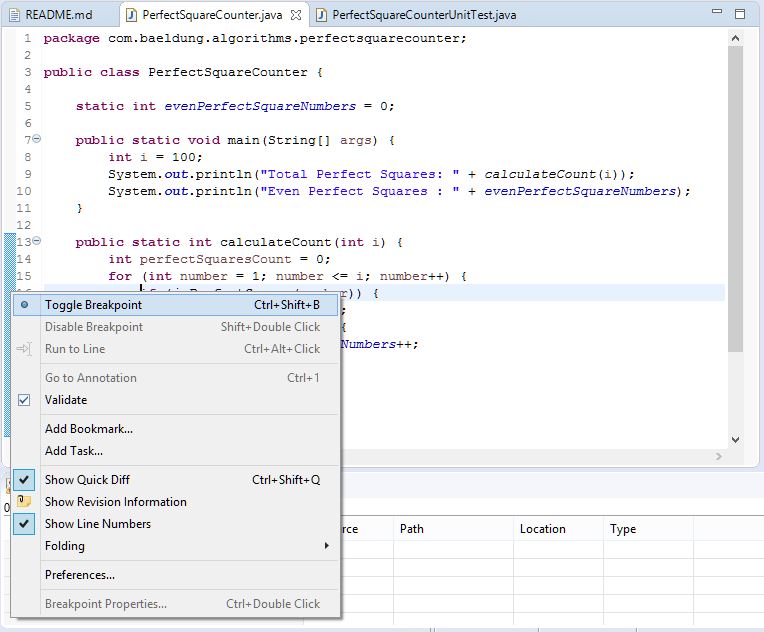
Basically, there are 3 ways to add breakpoints to the program:
- Right-click on the marker bar (vertical ruler) corresponding to the line and select Toggle Breakpoint (shown in the below screenshot)
- Press Ctrl+Shift+B on the necessary line while in the editor
- Double-click on the marker bar (vertical ruler) corresponding to the necessary line
2.3. Code-Flow Controls
Now that the debugger stops at the given breakpoints, we can proceed with further execution.
Let’s assume that the debugger is currently positioned as per the below screenshot, at Line 16:
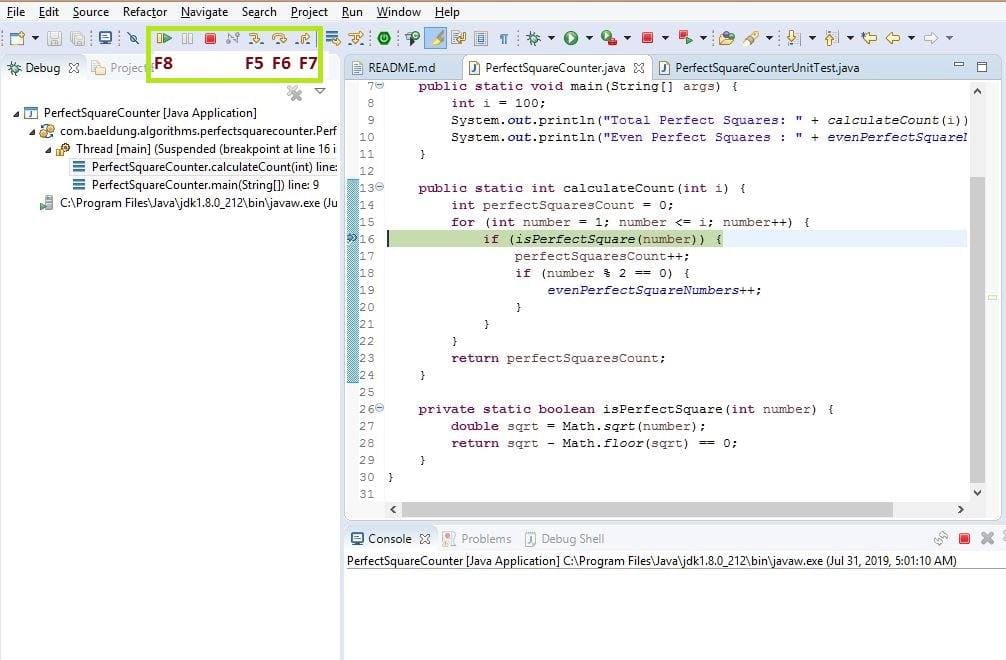
The most commonly used debug options are:
- Step Into (F5) – This operation goes inside the methods used in the current line (if any); else, it proceeds to the next line. In this example, it will take the debugger inside the method isPerfectSquare()
- Step Over (F6) – This operation processes the current line and proceeds to the next line. In this example, this will execute the method isPerfectSquare() and proceed to the next line
- Step Return (F7) – This operation finishes the current method and takes us back to the calling method. Since in this case, we have a breakpoint in the loop, it will be still within the method, else it would go back to the main method
- Resume (F8) – This operation will simply continue with the execution until the program ends unless we hit any further breakpoint
2.4. Debug Perspective
When we start the program in debug mode, Eclipse will prompt with an option to switch to the Debug perspective. The Debug perspective is a collection of some useful views that help us visualize and interact with the debugger.
We can also switch to the Debug perspective manually at any time.
Here are some of the most useful views that this contains:
- Debug view – This shows the different threads and call stack traces
- Variables view – This shows the values of the variables at any given point. If we need to see the static variables, we need to explicitly specify that
- Breakpoints – This shows the different breakpoints and watchpoints (which we will see below)
- Debug Shell – This allows us to write and evaluate custom code while debugging (an example is covered later)
3. Techniques
In this section, we’ll go through some important techniques that will help us to master debugging in Eclipse.
3.1. Variables
We can see the values of variables during the execution under the Variables view. In order to see the static variables, we can select the drop-down option Java -> Show Static Variables.
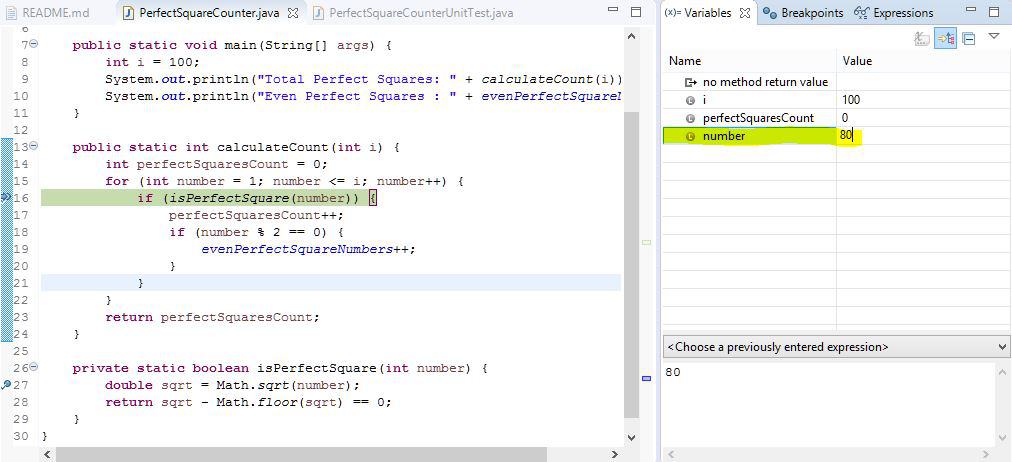
Using the variables view, it’s possible to change any value to the desired value during the execution.
For example, if we need to skip a few numbers and directly start with the number 80, we could do that by changing the value of the variable number:
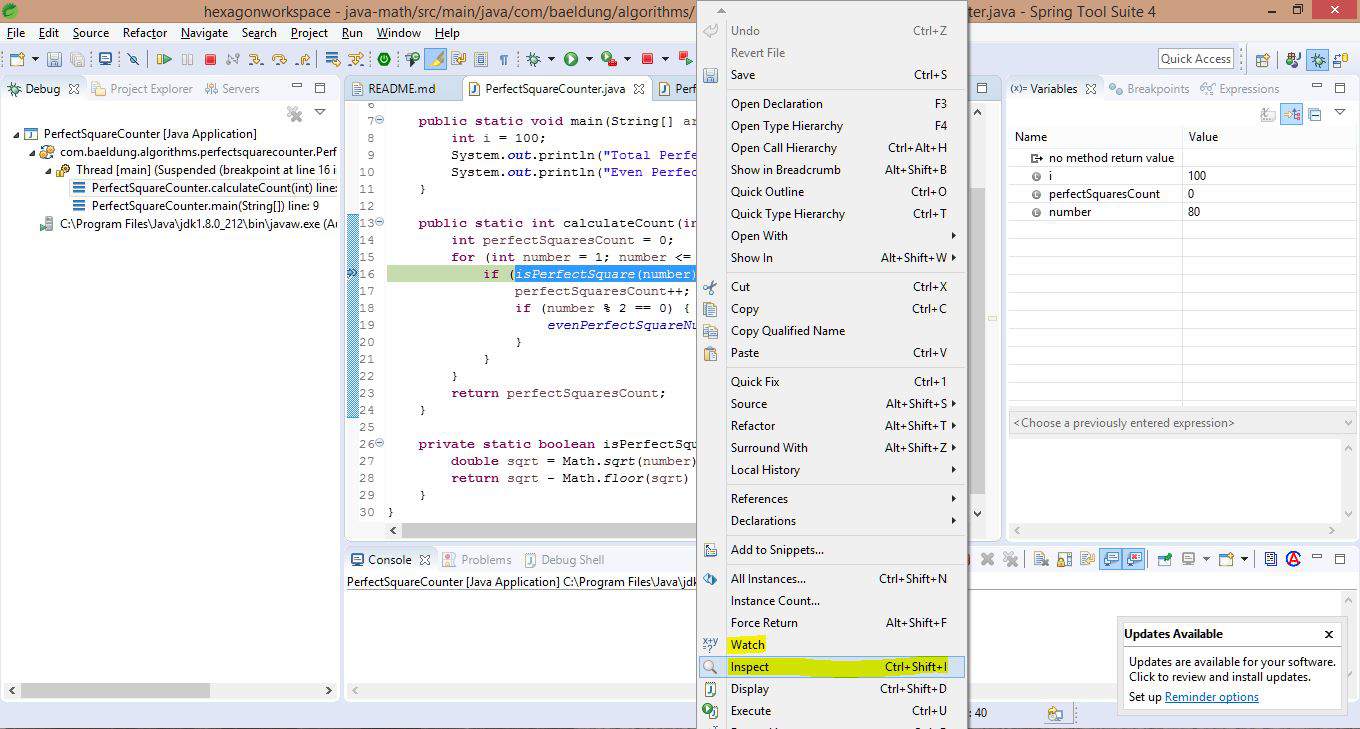
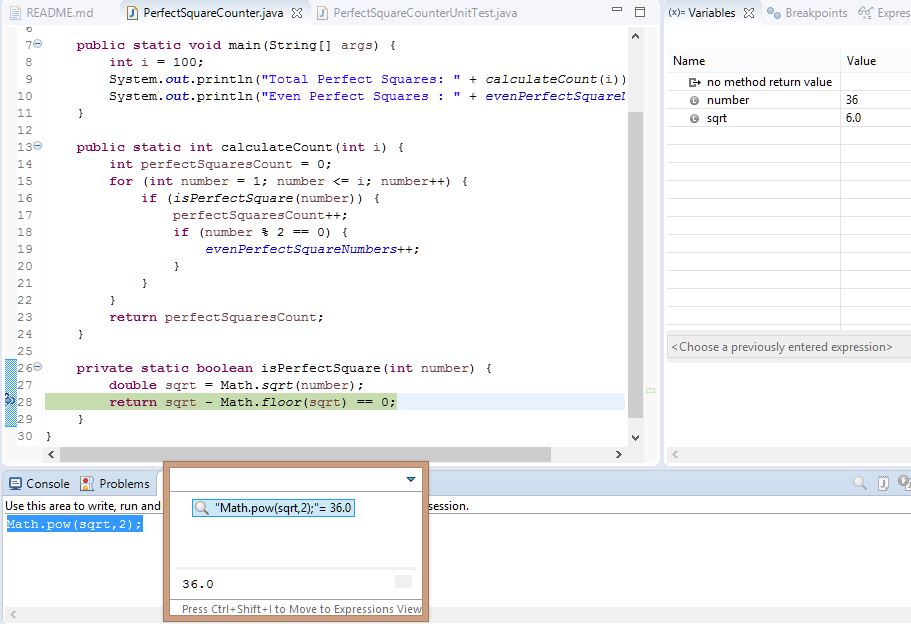
3.2. Inspecting Values
If we need to inspect the value of a Java expression or statement, we can select the particular expression in the editor, right-click, and Inspect, as shown below. A handy shortcut is to hit Ctrl+Shift+I on the expression to see the value:
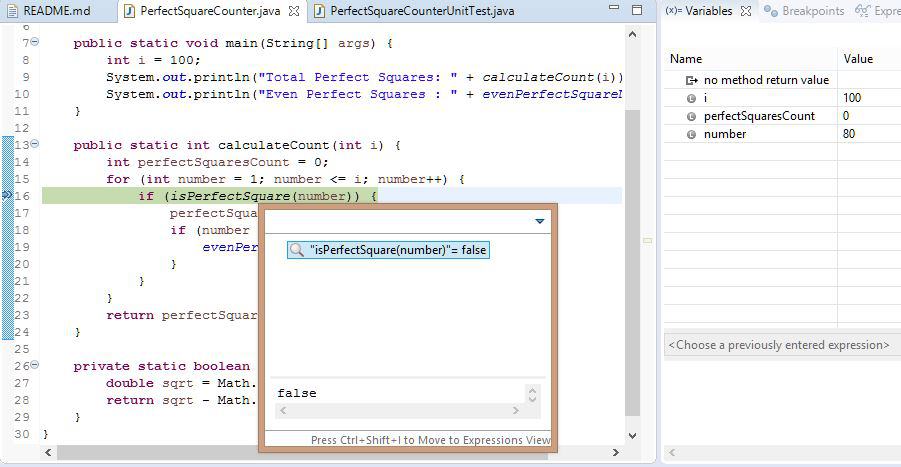
In case we need to permanently inspect this expression, we can right-click and Watch. Now, this gets added to the Expressions view and the value of this expression can be seen for different runs.
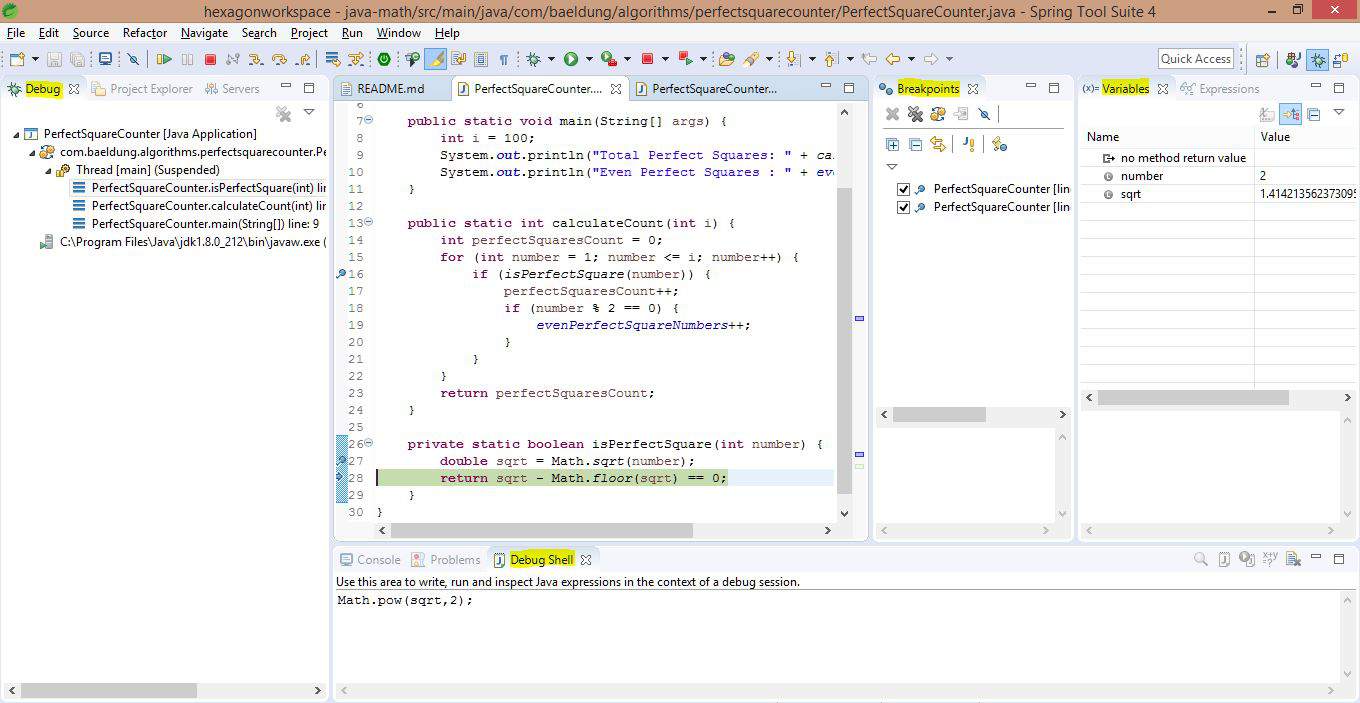
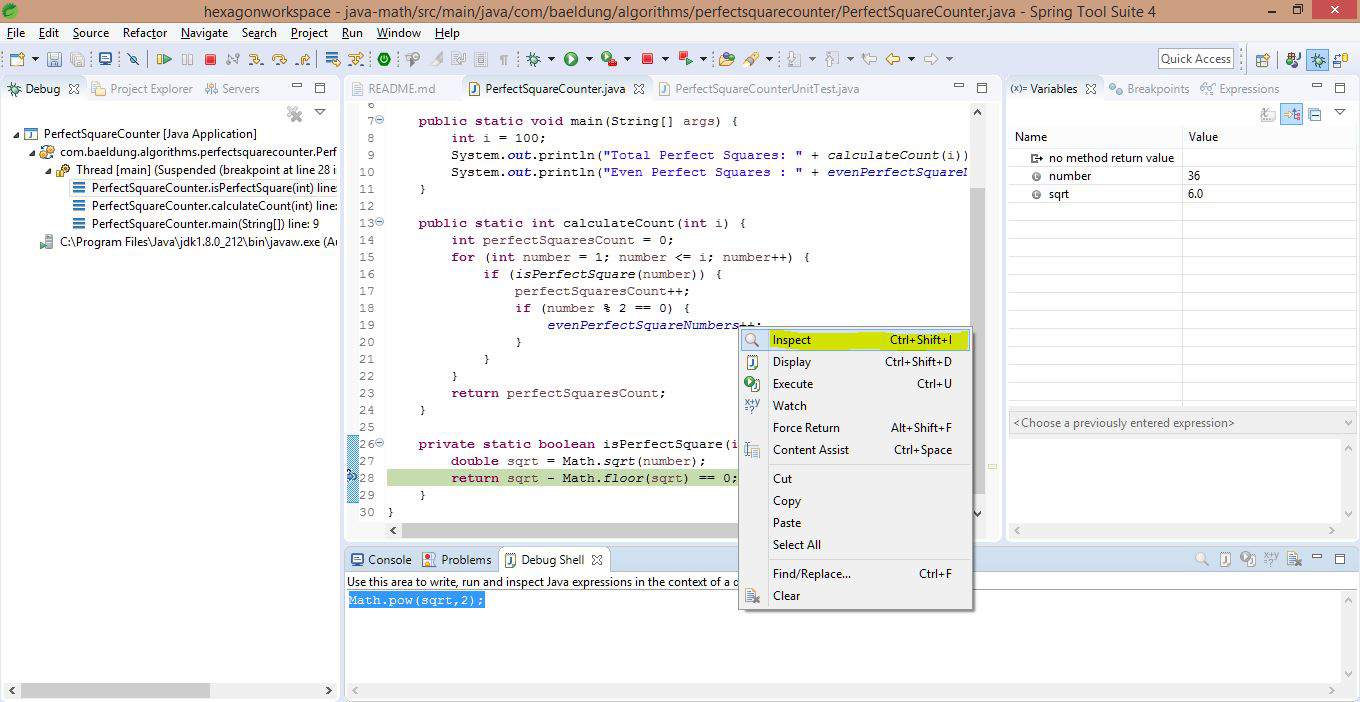
3.3. Debug Shell
In the context of the debugging session, we can write and run custom code to evaluate possibilities. This is done in the Debug Shell.
For example, if we need to cross-check the correctness of the sqrt functionality, we could do it in the Debug Shell. On the code, Right-click -> Inspect to see the value:
3.4. Conditional Breakpoints
There will be cases in which we want to debug only for specific conditions. We can achieve this by adding conditions to a breakpoint in one of two ways:
- Right-click on the breakpoint and choose Breakpoint Properties
- In Breakpoint view, select the breakpoint and specify the condition
For example, we can specify the breakpoint to suspend the execution only if number is equal to 10:

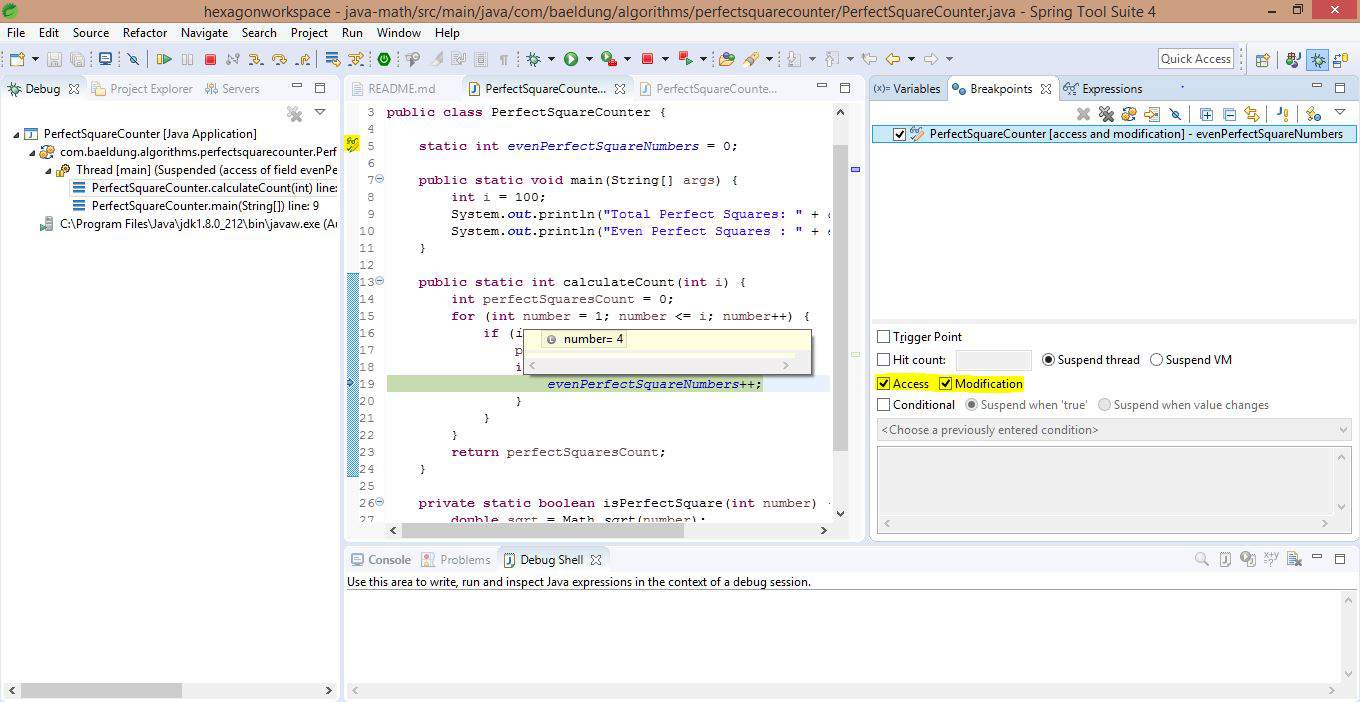
3.5. Watchpoints
What breakpoints are for methods, watchpoints are for class-level variables. In this current example, the breakpoint on evenPerfectSquareNumbers declaration is called a watchpoint. Now, the debugger will pause the execution every time the field is accessed or modified on a watchpoint.
This is the default behavior, which can be changed in the watchpoint’s properties.
In this example, the debugger will stop execution every time a perfect square is an even number:
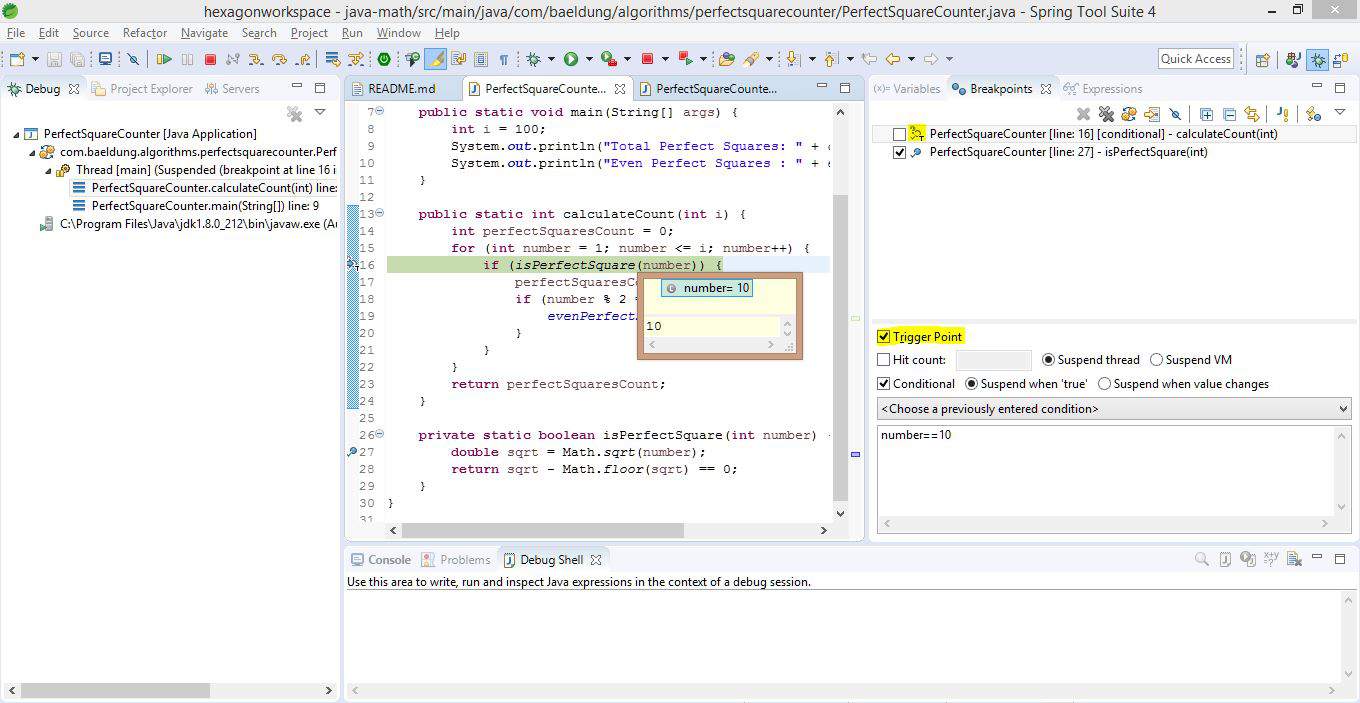
3.6. Trigger Points
Let’s assume that we’re debugging a complex issue in an application with a huge amount of source code. The debugger will keep suspending the flow due to scattered breakpoints.
When a breakpoint is marked as a trigger point, it means that the rest of the breakpoints will be enabled only if this breakpoint is hit.
For example, in the screenshot below, the breakpoint on isPerfectSquare() is supposed to be hit for every iteration in the loop. However, we’ve specified the breakpoint on calculateCount() method as a trigger point, along with a condition.
So, when the iteration count reaches 10, this will trigger the rest of the breakpoints. Hence, from now on, if the breakpoint on isPerfectSquare() is hit, the execution will get suspended:
3.7. Remote Debugging
Finally, if the application is running outside Eclipse, we can still use all the above functionalities, provided that the remote application allows debugging. From Eclipse, we would select Debug as Remote Java Application.
4. Conclusion
In this quick guide, we’ve seen the basics and different techniques of debugging programs in Eclipse IDE.


